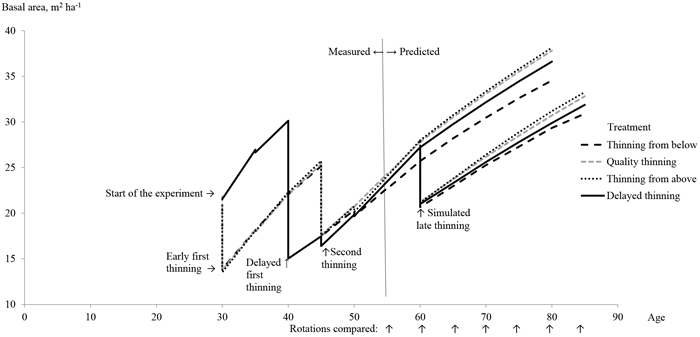
Fig. 1. Development of stand basal areas in the four thinning treatments including the effect of mortality. View larger in new window/tab.
| Table 1. Minimum top diameters (D, over bark), log lengths (L), and stumpage prices of different timber assortments used in thinnings and final cuttings according to the mean unit prices during the years 2011–2014 in Finland (Luke’s statistical services 2015). | ||||||
| Early first thinning | Delayed first thinning | Second thinning | Simulated late thinning | Final cutting | ||
| Timber assortment | Diameter and log length | Stumpage prices (€ m–3) | ||||
| Grade A butt log | D ≥ 22 cm, L = 28−58 dm | 65 | 65 | 65 | ||
| Conventional saw log | D ≥ 15 cm, L = 37−58 dm | 40 | 47.5 | 47.5 | 55 | |
| Small-diam. saw log | D ≥ 12 cm, L = 31−43 dm | 20 | 20 | 20 | 25 | |
| Pulpwood | D ≥ 6 cm, L = 28−55 dm | 12.5 | 13.5 | 14.5 | 14.5 | 17.5 |
| Table 2. Mean characteristics of the growing stock at the stand age of 55 years in the plots of four different thinning treatments. | ||||||||
| Thinning from below | Quality thinning | Thinning from above + pruning | Delayed thinning | |||||
| Variable | Mean | SD | Mean | SD | Mean | SD | Mean | SD |
| Stem number, ha–1 | (a)593 | 93 | 753 | 55 | (a)792 | 97 | 663 | 119 |
| Mean DBH, cm | (a)22.1 | 1.8 | 20.1 | 0.9 | (a)19.5 | 1.1 | 21.2 | 2.1 |
| Mean height, m | 19.3 | 0.7 | 18.6 | 0.7 | 18.6 | 0.7 | 19.1 | 0.9 |
| Basal area, m2 ha–1 | 22.7 | 0.8 | 24.2 | 0.7 | 24.0 | 1.4 | 23.4 | 0.6 |
| Total volume, m3 ha–1 | 211.6 | 3.8 | 218.0 | 9.2 | 220.5 | 18.0 | 219.3 | 8.6 |
| Saw log-sized volume, m3 ha–1 | 167.7 | 19.4 | 151.5 | 20.4 | 144.2 | 26.3 | 164.8 | 29.3 |
| Saw logs (b), m3 ha–1 | 105.3 | 15.1 | 118.3 | 29.2 | 96.0 | 28.1 | 92.9 | 15.8 |
| Reduction in saw log volume, % (c) | 37% | 23% | 33% | 43% | ||||
| Grade A butt logs, m3 ha–1 | 0.7 | 1.2 | 0.6 | 1.1 | 3.9 | 4.1 | 0.0 | 0.0 |
| Small-diameter saw logs, m3 ha–1 | 28.1 | 10.5 | 46.9 | 10.1 | 46.3 | 9.5 | 34.6 | 12.6 |
| Pulpwood, m3 ha–1 | 70.8 | 17.4 | 50.3 | 14.3 | 72.6 | 8.0 | 84.3 | 5.1 |
| Cumulative mortality, m3 ha–1 during 25 yrs | 15.2 | 10.8 | 6.7 | 2.4 | 11.6 | 5.7 | 12.2 | 1.4 |
| (a) nearly significant difference (0.05 < p <0.10) between these two treatments, (b) includes grade A butt logs, (c) quality reduction in the saw log volume due to the defects according to the bucking simulation, as a percentage of the total saw log-sized volume. | ||||||||
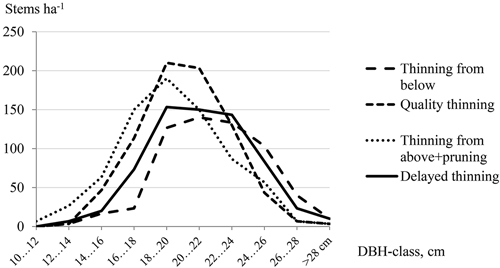
Fig. 2. DBH distributions for the four thinning treatments at the stand age of 55 years.
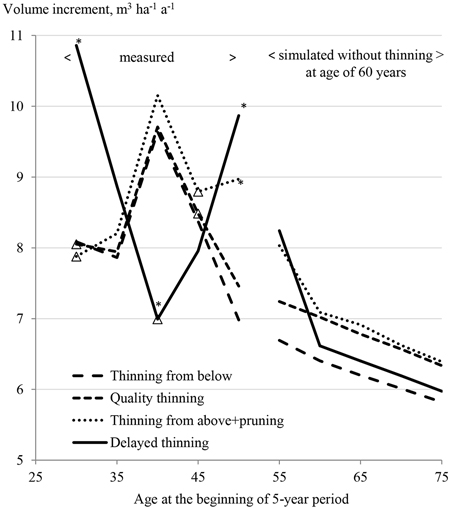
Fig. 3. Current annual volume increment in the coming 5-year period (m3 ha–1 a–1) from the establishment of the experiment to the end of the stand rotation in the four thinning treatments. Stand development was measured from the age of 30 years to 55 years and simulated thereafter. ∆ indicates the thinning realised at the beginning of the targeted growth period and * indicates a significant difference (p < 0.05) compared with the other treatments.
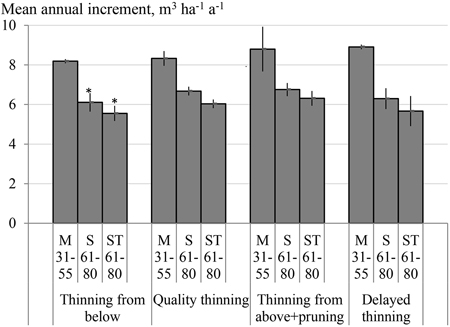
Fig. 4. Mean annual volume increment (m3 ha–1 a–1) with standard deviation in the four thinning treatments during the measurement period (M 31–55 years) and during the simulated period without a late thinning at the age of 60 years (S 61–80 years) and with that thinning (ST 61–80 years). * indicated a significant difference (p < 0.05) between the treatments during the corresponding period.
| Table 3. Thinning and final cutting removals (m3 ha–1) by timber assortments using alternative rotation lengths of 55–85 years in the four different treatments without and with the simulated late thinning at the age of 60 years. * indicates significantly (p < 0.05) higher volume of saw logs (incl. grade A butt logs) in the plots of quality thinning compared with the other treatments using the same rotation period. View in new window/tab. |
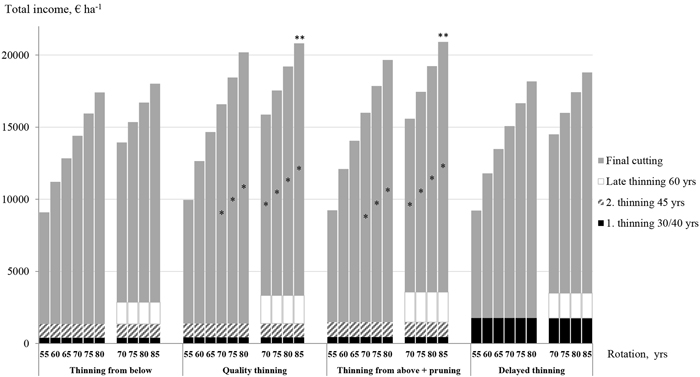
Fig. 5. Total incomes (€ ha–1) from all thinnings and final cuttings using alternative rotation lengths of 55–85 years in the four different treatments without and with the late thinning at the age of 60 years. * indicated a significant difference (p < 0.05) between the plots of quality thinning and thinning from above with pruning vs. the other treatments in the final cutting incomes and ** in the total incomes. View larger in new window/tab.
| Table 4. Bare land values (BLV, € ha–1) at the moment of final cutting calculated from cutting incomes and given regeneration costs for the four different thinning treatments with alternative rotation lengths of 60, 70 and 80 years with and without the late thinning at the age of 60 years. | ||||||
| Bare land values, € ha–1 | ||||||
| Simulated late thinning at the age of 60 years excluded | Simulated late thinning at the age of 60 years included | |||||
| Interest rate | Thinning treatment | Rotation length, yrs. | Rotation length, yrs. | |||
| 60 | 70 | 80 | 70 | 80 | ||
| 1% | Below | 10167 | 11253 | 11636 | 10948 | 11329 |
| Quality | 11932 | 13441 | 13939 | 12931 | 13486 | |
| Above + pruning | 11293 | 12882 | 13538 | 12696 | 13564 | |
| Delayed | 11003 | 12070 | 12434 | 11683 | 12131 | |
| 2% | Below | 2753 | 2895 | 2771 | 2850 | 2777 |
| Quality | 3392 | 3638 | 3503 | 3541 | 3494 | |
| Above + pruning | 3173 | 3463 | 3393 | 3480 | 3544 | |
| Delayed | 3100 | 3233 | 3097 | 3169 | 3121 | |
| 3% | Below | 530 | 474 | 304 | 482 | 357 |
| Quality | 832 | 802 | 605 | 795 | 665 | |
| Above + pruning | 735 | 734 | 570 | 778 | 699 | |
| Delayed | 716 | 655 | 478 | 658 | 545 | |
| 4% | (appointment) | 250 | 250 | 250 | 250 | 250 |
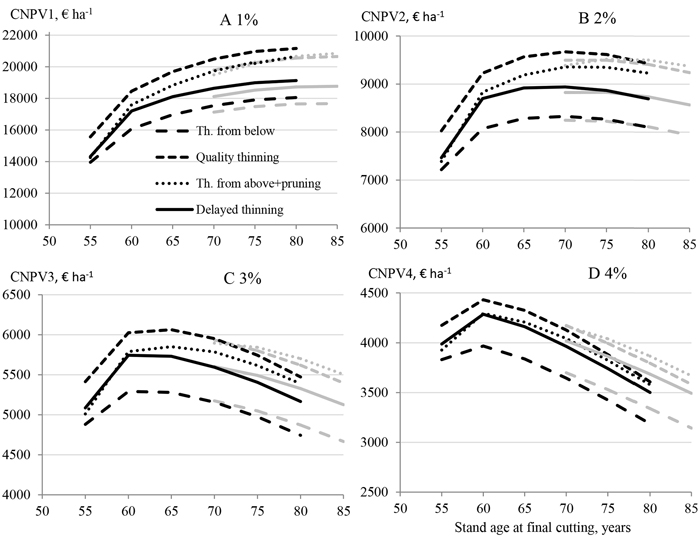
Fig. 6. Combined net present values (CNPV, € ha–1) discounted to the stand age of 30 years using alternative stand ages of 55–85 years at final cutting in the four treatments when interest rates of 1% (A), 2% (B), 3% (C) and 4% (D) were applied. Bare land values discounted from the final cutting date are included. Grey lines mean the CNPVs after simulated late thinnings at the age of 60 years.