| Table 1. Forest statistics of study area 1 (average, maximum and standard deviation of values for the 263 sample plots used). | |||
| Forest variable | Average | Max. | Std. |
| Total stem volume, m3/ha | 190.9 | 575.4 | 109.1 |
| Stem volume of Scots pine, m3/ha | 74.5 | 560.6 | 87.8 |
| Stem volume of Norway spruce, m3/ha | 68.0 | 575.4 | 96.6 |
| Stem volume of other species, m3/ha | 48.4 | 312.0 | 56.7 |
| Total ABVG biomass, tonnes/ha | 96.4 | 251.8 | 50.4 |
| ABVG biomass of Scots pine, tonnes/ha | 34.2 | 197.3 | 38.2 |
| ABVG biomass of Norway spruce, tonnes/ha | 35.4 | 251.8 | 46.7 |
| ABVG biomass of other species, tonnes/ha | 26.7 | 164.3 | 30.2 |
| Total biomass of branches, tonnes/ha | 19.2 | 54.5 | 10.5 |
| Biomass of Scots pine branches, tonnes/ha | 5.7 | 36.7 | 6.2 |
| Biomass of Norway spruce branches, tonnes/ha | 9.3 | 54.4 | 11.3 |
| Biomass of other species’ branches, tonnes/ha | 4.1 | 27.9 | 4.5 |
| Table 2. Forest statistics for study area 2 (average, maximum, and standard deviation of values for the 504 sample plots used). | |||
| Forest variable | Average | Max. | Std. |
| Total stem volume, m3/ha | 206.5 | 798.5 | 126.3 |
| Stem volume of Scots pine, m3/ha | 51.8 | 577.6 | 81.7 |
| Stem volume of Norway spruce, m3/ha | 111.3 | 739.2 | 130.4 |
| Stem volume of deciduous species, m3/ha | 43.4 | 400.4 | 64.6 |
| Total ABVG biomass, tonnes/ha | 110.0 | 341.9 | 59.5 |
| ABVG biomass of Scots pine, tonnes/ha | 25.1 | 229.5 | 37.6 |
| ABVG biomass of Norway spruce, tonnes/ha | 60.5 | 325.1 | 66.0 |
| ABVG biomass of deciduous species, tonnes/ha | 24.3 | 214.9 | 35.7 |
| Total biomass of branches, tonnes/ha | 22.8 | 75.6 | 14.1 |
| Biomass of Scots pine branches, tonnes/ha | 4.8 | 36.0 | 6.8 |
| Biomass of Norway spruce branches, tonnes/ha | 16.2 | 75.5 | 16.4 |
| Biomass of deciduous species branches, tonnes/ha | 1.7 | 18.0 | 2.6 |
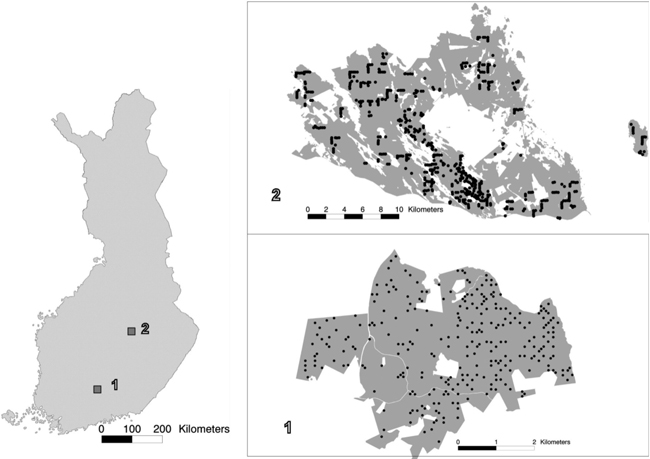
Fig. 1. The location of study areas 1 and 2 within Finland, and the spatial distribution of the field plots within the study areas.
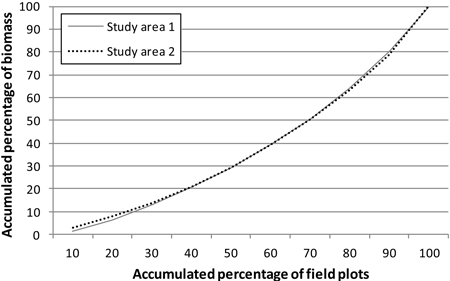
Fig. 2. Total aboveground biomass (per hectare) distribution in the study areas.
| Table 3. Number of features selected in each case when both laser and aerial photograph features were available. Percentage of aerial photograph features is in parentheses. | ||
| GA optimization case | Study area 1 | Study area 2 |
| Minimize RMSE of total volume | 12 (25%) | 18 (28%) |
| Minimize RMSE of total ABVG biomass | 9 (11%) | 8 (25%) |
| Minimize RMSE of total volume and species-specific volumes | 15 (47%) | 21 (33%) |
| Minimize RMSE of total ABVG biomass and species-specific ABVG biomasses | 13 (31%) | 17 (29%) |
| Table 4. Number of features selected in each case when only laser features were available. | ||
| GA optimization case | Study area 1 | Study area 2 |
| Minimize RMSE of total volume | 16 | 13 |
| Minimize RMSE of total ABVG biomass | 9 | 16 |
| Minimize RMSE of total volume and species-specific volumes | 16 | 15 |
| Minimize RMSE of total ABVG biomass and species-specific ABVG biomasses | 12 | 19 |
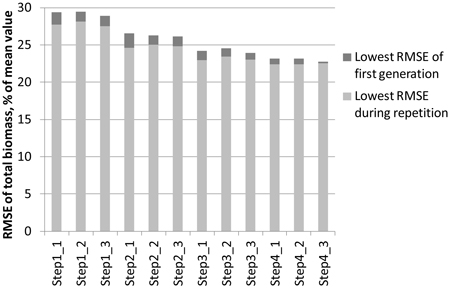
Fig. 3. Lowering of the RMSEs during the steps taken in the genetic algorithm process. The objective was to minimise the total ABVG biomass of study area 1. In each step, three 30‑generation repetitions are made, after which the best feature combination is used as the starting point for the next step.
| Table 5. Relative stem volume RMSEs and biases (% of mean values) for study areas 1 and 2, where the forest variables used in the objective criterion in the feature selection process were total volume and volumes of Scots pine, Norway spruce, and other tree species (values obtained with minimisation of only the RMSE of total volume in the feature selection process are in brackets). | ||||
| Forest variable | Study area 1 | Study area 2 | ||
| RMSE | Bias | RMSE | Bias | |
| Total stem volume | 27.5 (23.4) | 0.7 (2.3) | 28.5 (26.1) | 0.4 (0.2) |
| Volume of Scots pine | 70.9 (98.3) | 0.2 (0.1) | 121.1 (128.9) | 0.5 (9.0) |
| Volume of Norway spruce | 78.8 (109.6) | 0.5 (6.8) | 57.6 (58.7) | 1.7 (6.6) |
| Volume of other species | 75.6 (101.0) | 2.4 (0.8) | 91.1 (96.9) | 6.9 (7.4) |
| Table 6. Relative ABVG biomass RMSEs and biases (% of mean values) for study areas 1 and 2, where both aerial photograph and laser features were used in the estimation and the forest variables used in the objective criterion in the feature selection process were total biomass and biomass figures for Scots pine, Norway spruce, and other tree species (values obtained with minimisation of only the RMSE of total biomass in the feature selection process are in brackets). | ||||
| Forest variable | Study area 1 | Study area 2 | ||
| RMSE | Bias | RMSE | Bias | |
| Total ABVG biomass | 24.8 (22.5) | 0.7 (1.3) | 24.5 (23.6) | 0.3 (0.5) |
| ABVG biomass of Scots pine | 66.9 (83.4) | 3.5 (4.7) | 109.9 (132.5) | 4.6 (5.2) |
| ABVG biomass of Norway spruce | 75.8 (95.3) | 2.0 (9.7) | 51.5 (55.4) | 6.7 (3.4) |
| ABVG biomass of other species | 75.7 (90.7) | 0.6 (2.1) | 92.6 (111.3) | 10.6 (6.1) |
| Total ABVG biomass of branches | 30.4 (30.1) | 0.1 (2.5) | 32.2 (34.6) | 3.4 (1.6) |
| ABVG biomass of Scots pine branches | 68.5 (84.2) | 2.9 (4.2) | 103.7 (124.4) | 4.2 (3.5) |
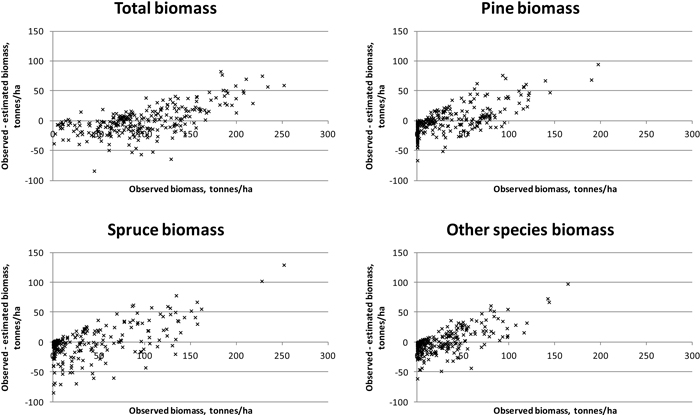
Fig. 4. Residuals of biomasses on study area 1. Species-specific biomasses were taken into account in the feature selection process.
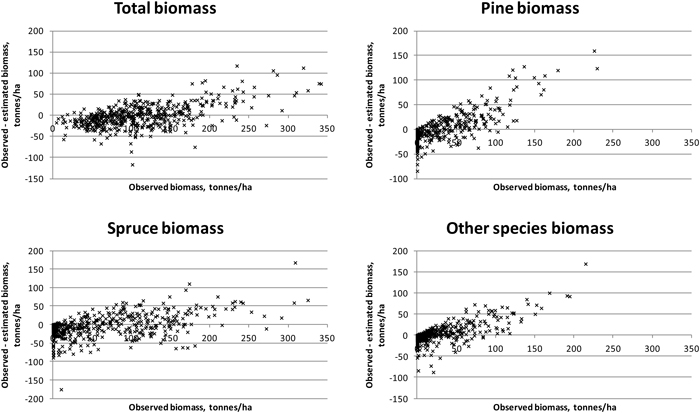
Fig. 5. Residuals of biomasses on study area 2. Species-specific biomasses were taken into account in the feature selection process.
| Table 7. Relative stem volume and ABVG biomass RMSEs and biases (% of mean values) for study areas 1 and 2. In this case, only laser features were used in the estimation and the forest variables used in the objective criteria in the feature selection process are total volume or biomass and volume (biomass) figures for Scots pine, Norway spruce, and other tree species (values obtained with minimisation of only the RMSE of total volume or biomass in the feature selection process are in brackets). | ||||
| Forest variable | Study area 1 | Study area 2 | ||
| RMSE | Bias | RMSE | Bias | |
| Total stem volume | 26.1 (22.9) | 1.1 (0.4) | 30.6 (28.5) | 0.7 (1.4) |
| Volume of Scots pine | 74.2 (88.8) | 5.3 (5.3) | 134.2 (139.3) | 6.9 (3.6) |
| Volume of Norway spruce | 83.5 (96.4) | 3.6 (4.7) | 61.9 (65.0) | 6.9 (8.5) |
| Volume of other species | 88.2 (96.3) | 1.2 (3.2) | 105.4 (119.3) | 6.2 (10.8) |
| Total ABVG biomass | 24.3 (22.1) | 0.7 (0.1) | 27.4 (24.8) | 1.3 (1.3) |
| ABVG biomass of Scots pine | 70.9 (91.2) | 3.7 (7.2) | 117.9 (133.5) | 8.0 (6.3) |
| ABVG biomass of Norway spruce | 74.7 (102.7) | 0.4 (4.3) | 61.8 (70.6) | 9.9 (9.8) |
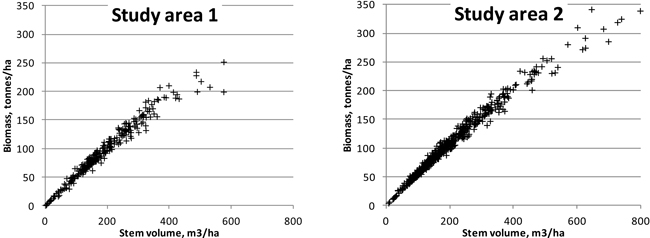
Fig. 6. Relationship of plot-level stem volumes with aboveground biomasses in the study areas.