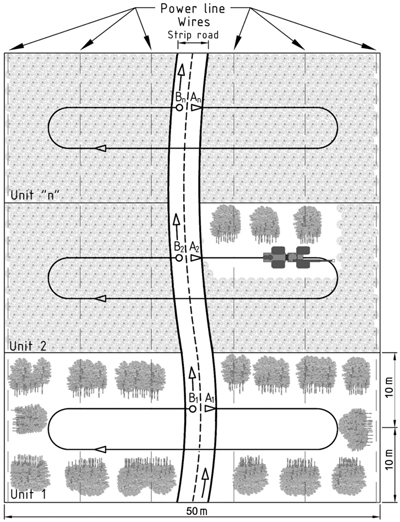
Fig. 1. Sketch of the working method of the harvester in the PL corridor (unit surface of 0.1 ha). The harvester started to work at “A1”, followed the path shown and finished when it reached the point “B1” (unit 1). The harvested moved from “B1” to “A2”, in the next unit (unit 2). The forwarder followed the same path as the harvester.
| Table 1. Main parameters of the harvesting units. | |||||||||
| Unit | Species a) % b/s/p | DBH b) (cm) | DSH b) (cm) | Height b) (m) | Density (trees/ha) | Harvested area (m2) | Harvested biomass c) (OD t) | Harvested volume d) (m3s) | Biomass removal (OD t/ha) |
| 1 | 86/12/2 | 2.7 | 4.0 | 3.7 | 15 717 | 908 | 2.52 | 5.1 | 27.8 |
| 2 | 93/7/0 | 2.3 | 3.4 | 3.5 | 30 239 | 795 | 1.64 | 3.3 | 20.6 |
| 3 | 73/24/2 | 2.3 | 3.5 | 3.4 | 20 640 | 812 | 1.85 | 3.7 | 22.8 |
| 4 | 86/11/4 | 3.1 | 4.4 | 4.0 | 14 854 | 819 | 1.90 | 3.8 | 23.2 |
| 5 | 86/14/0 | 4.7 | 6.5 | 4.9 | 15 385 | 592 | 2.16 | 4.3 | 36.5 |
| 6 | 93/7/1 | 4.7 | 6.2 | 4.7 | 15 099 | 677 | 2.17 | 4.4 | 32.1 |
| 7 | 85/15/0 | 3.1 | 4.5 | 4.0 | 13 396 | 659 | 1.51 | 3.0 | 22.9 |
| 8 | 94/6/0 | 2.5 | 3.7 | 3.8 | 15 648 | 921 | 1.76 | 3.5 | 19.1 |
| 9 | 92/8/0 | 2.4 | 3.6 | 3.7 | 15 252 | 1120 | 2.14 | 4.3 | 19.1 |
| 10 | 95/5/0 | 3.7 | 5.2 | 4.5 | 10 080 | 600 | 1.61 | 3.2 | 26.8 |
| 11 | 99/1/0 | 3.5 | 4.9 | 4.5 | 12 202 | 668 | 1.45 | 2.9 | 21.7 |
| 12 | 95/5/0 | 3.0 | 4.3 | 4.1 | 12 732 | 609 | 1.52 | 3.1 | 25.0 |
| 13 | 98/2/0 | 3.9 | 5.1 | 6.3 | 17 507 | 620 | 2.19 | 4.4 | 35.3 |
| Av. | 90/9/1 | 3.2 | 4.6 | 4.2 | 16 058 | 754 | 1.88 | 3.8 | 25.6 |
| a) b, broadleaves (mostly birch, Betula spp., and willow, Salix spp.); s, spruce (Picea abies); p, pine (Pinus sylvestris). b) DBH, diameter at breast height; DSH, diameter at stump height. The mean values are weighted by basal area. c) As weighed during the field study. d) Given the density 497 OD kg/m3s (m3s = solid cubic meters). | |||||||||
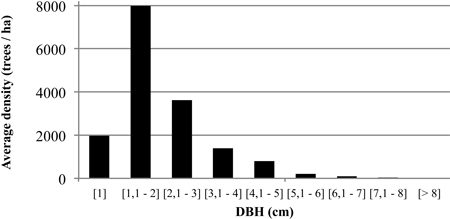
Fig. 2. Average distribution of DBH classes (cm) in the harvested units.
| Table 2. Definition of the work elements in the harvester work cycle. | ||||
| Work element | Description | Priority a) | ||
| Boom out | Starts when an empty crane moves towards a tree to be harvested and stops when the tree has been reached. | 1 | ||
| Felling | Starts when the first tree has been reached and stops when the last tree has been felled (moving to successive trees included). | 1 | ||
| Boom in | Starts when the last tree in the crane cycle has been felled and stops when trees have been dropped on the ground (including fixing the bunch). | 2 | ||
| Moving | Starts when the base machine wheels are turning and ends when the base machine stops. | 3 | ||
| Miscellaneous | Other activities such as trees being dropped and then picked up again, bucking of long trees | 4 | ||
| Delays | Time not related to effective work time e.g. personal breaks, repairs. | 5 | ||
| a) If work elements were performed simultaneously, the element with the highest priority (lowest number) was recorded. | ||||
| Table 3. Definition of the work elements in the forwarder work cycle. | ||||
| Work element | Description | Priority a) | ||
| Loading | Starts when the empty crane starts to move from the base position in the load bunk and stops when the crane returns to the base position and the machine starts to move to the next loading area (machine position). | 1 | ||
| Moving while loading | Starts when the base machine wheels are turning and ends when the base machine stops for loading. | 2 | ||
| Driving loaded | Starts when the base machine starts to move from the cutting area and ends when the machine stops at the landing. | 2 | ||
| Unload | Starts when the crane moves to grab the first bunch and ends when the crane returns in its base position in the loading space. | 1 | ||
| Driving unloaded | Starts when the base machine starts to move from the landing and ends when the machine stops at the cutting area. | 2 | ||
| Miscellaneous | Other activities e.g. bunches are dropped and then picked up again, load adjusting. | 3 | ||
| Delays | Time not related to effective work time e.g. personal breaks, repairs. | 4 | ||
| a) If work elements were performed simultaneously, the element with the highest priority (lowest number) was recorded. | ||||
| Table 4. Hourly operating cost of the harvester (including the accumulating felling head) and the forwarder, VAT excluded. | ||
| Harvester (including AFH) | Forwarder | |
| Economic lifespan (years) | 4.6 | 4.6 |
| Interest rate (%) | 6 | 6 |
| Purchase price (SEK) | 3 450 000 | 3 200 000 |
| Salvage value, present value (SEK) | 527 767 | 489 523 |
| Operating hours per year (WT-hours) | 2500 | 2500 |
| Fixed costs (SEK/WT-hour) | 330 | 309 |
| Capital costs (SEK/year) | 745 720 | 691 682 |
| Fixed maintenance costs (SEK/year) (insurance and administration) | 79 650 | 79 650 |
| Variable costs (SEK/WT-hour) | 491 | 421 |
| Variable maintenance costs (SEK/WT-hour) | 67 | 21 |
| Fuel costs (incl. lubricant) (SEK/WT-hour) | 174 | 150 |
| Driver salary (SEK/WT-hour) | 250 | 250 |
| Profit margin (5%) (SEK/WT-hour) | 41 | 36 |
| Operating hourly cost (SEK/WT-hour) | 862 | 766 |
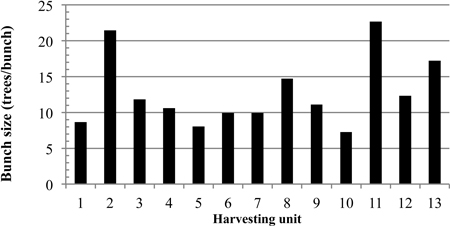
Fig. 3. Average bunch size (number of trees per bunch) in each of the harvested units.
| Table 5. Productive work time consumption (minutes) per oven-dry tonnes of the harvester (average, minimum, maximum, standard deviation and percentage), divided into the work elements (n = 13). | |||||
| Work element | Average | Min. | Max. | sd | (%) |
| Boom out | 5.80 | 2.73 | 7.83 | 1.28 | 16.6 |
| Felling | 20.88 | 11.10 | 28.56 | 6.55 | 59.7 |
| Boom in | 4.51 | 2.10 | 6.61 | 1.38 | 12.9 |
| Moving | 3.53 | 2.30 | 5.33 | 1.00 | 10.1 |
| Miscellaneous | 0.26 | 0.06 | 0.68 | 0.18 | 0.7 |
| Total time | 34.98 | 20.24 | 45.77 | 9.11 | 100.0 |
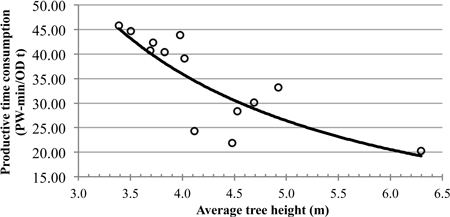
Fig. 4. Productive work time consumption per oven-dry tonne of the harvester as a function of the average tree height harvested.
| Table 6. Productive work time consumption (min) per oven-dry tonne of the forwarder (average, standard deviation and percentage), divided into work elements (n = 13), given a full load and 100 m forwarding distance. | |||
| Work element | Average | sd | (%) |
| Loading | 3.21 | 0.78 | 40.3 |
| Moving while loading | 2.11 | 0.70 | 26.4 |
| Unloading | 1.08 | 0.25 | 13.6 |
| Driving unloaded | 0.48 | 1.56 | 6.0 |
| Driving loaded | 0.59 | 1.78 | 7.4 |
| Miscellaneous | 0.51 | 0.34 | 6.3 |
| Total time | 7.97 | 3.70 | 100.0 |
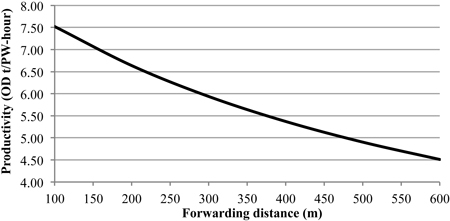
Fig. 5. Forwarding productivity given a fixed removal of biomass (25.6 OD t/ha), as a function of forwarding distance.
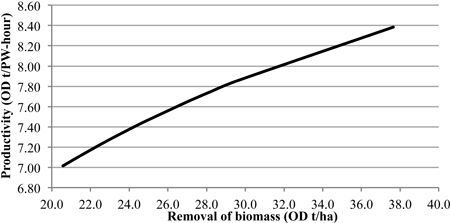
Fig. 6. Forwarding productivity as a function of the removal of biomass per ha (in turn, calculated as a function of the average tree height of the study units), given a constant forwarding distance of 100 m.
| Table 7. Economic result of the mechanized clearing system and motor-manual clearing, as a function of the average tree height (lowest height 3.4 m, highest 6.3 m), in a stand of 1 ha. The percentage (Δ) represents the variation between the lowest and the highest heights of trees in the modelled stands. | ||||||
| Stand types / Tree heights | ||||||
| 3.4 m | 6.3 m | 3.4 m | 6.3 m | |||
| SEK/ha | SEK/ha | Δ% | SEK/OD t | SEK/OD t | Δ% | |
| Mechanized clearing system | ||||||
| Harvester cost | 14 841 | 11 562 | –22 | 721 | 307 | –57 |
| Forwarder cost | 2499 | 3823 | +53 | 121 | 102 | –16 |
| Relocation cost | 4000 | 4000 | 0 | 194 | 106 | –45 |
| Total costs | 21 340 | 19 385 | –9 | 1037 | 515 | –50 |
| Revenues | 8692 | 15 896 | +83 | 422 | 422 | 0 |
| Net income | –12 647 | –3489 | +72 | –614 | –93 | +85 |
| Motor-manual clearing | ||||||
| Total cost | –4097 | –4681 | +14 | –199 | –124 | –38 |
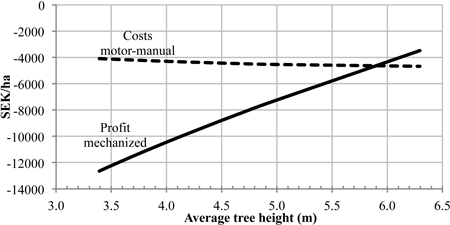
Fig. 7. Net income of the mechanized harvesting system (as a function of the average tree height, given a constant forwarding distance of 100 m) and costs of motor-manual clearing. Modelled stand size was 1 ha.
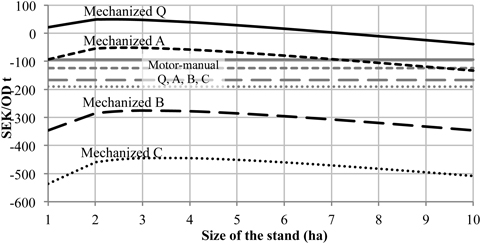
Fig. 8. Net income of the mechanized harvesting system and costs of motor-manual clearing, as a function of quality classes C, B, A and Q and the modelled size of the stands (from 1 to 10 ha).
| Table 8. The “Break-even point” (tree height) of the mechanized clearing system for stand sizes from 1 to 5 ha. | ||
| Stand size (ha) | Forwarding distance (m) | “Break-even point” (Tree height) (m) |
| 1 | 100 | 7.6 |
| 2 | 200 | 7.1 |
| 3 | 300 | 7.1 |
| 4 | 400 | 7.2 |
| 5 | 500 | 7.4 |