| Table 1. Characteristics of the test chippers. |
| Type | Drum | Disc |
| Make | Pezzolato | Pezzolato |
| Model | PTH 300 G | H880/250 |
| Year | 2012 | 2012 |
| Serial # | CI 5240 | CI 5389 |
| Weight kg | 2320 | 1460 |
| Knives n° | 2 | 2 |
| Blade offset mm | 15 | 13 |
| Screen mm | 50 | NA |
| Piece breaker | NA | 3 blades, 40 mm |
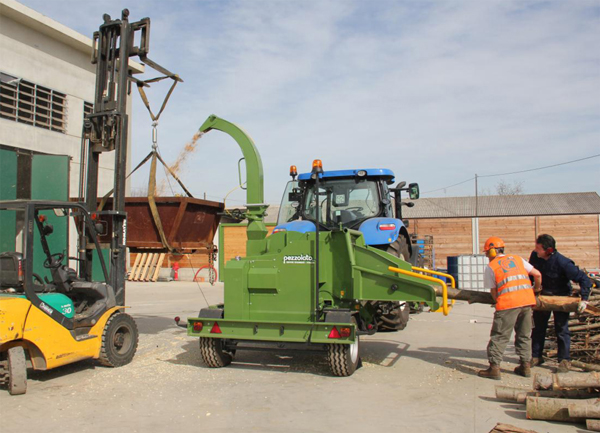
Fig. 1. The experimental set up with the PTH 300 G drum chipper.
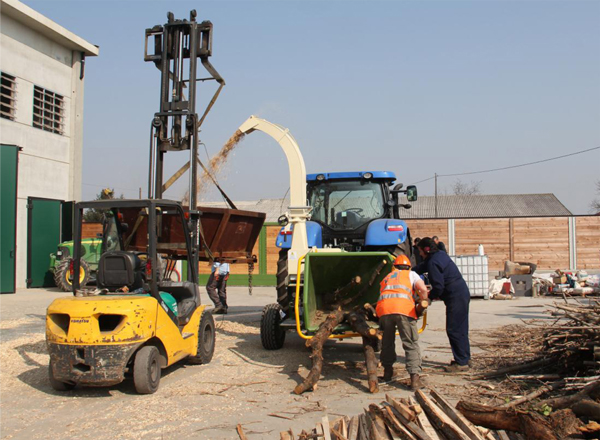
Fig. 2. The experimental set up with the H 880/250 disc chipper.
| Table 2. Average time consumption (minutes) per oven-dry tonne chips by chipper and feedstock type. |
| Feedstock type | Disc | Drum | ∆ Disc (%) |
| Chestnut stem | 6.28a | 5.46a | 15.0 |
| Poplar branches | 10.17b | 8.99b | 13.1 |
| Poplar logs | 6.73a | 6.24a | 7.9 |
| Poplar mill residue | 9.46b | 9.46b | 0.0 |
| Table 3. Anova table for time consumption per oven-dry tonne by chipper and feedstock type. |
| Source | DF | Type III SS | p |
| Chipper | 1 | 118441.383 | 0.0535 |
| Feedstock | 3 | 3447703.362 | <0.0001 |
| Chipper*Feedstock | 3 | 56431.216 | 0.6132 |
| Table 4. Average power consumption (kW) when chipping by chipper and feedstock type. |
| Feedstock type | Disc | Drum | ∆ Disc (%) |
| Chestnut stem | 35.39a | 46.26a | –23.5 |
| Poplar branches | 21.66b | 28.83b | –24.9 |
| Poplar logs | 37.89a | 45.99a | –17.6 |
| Poplar mill residue | 27.92c | 34.51c | –19.1 |
| Table 5. Ancova table for average power consumption when chipping by chipper and feedstock type with productivity as covariate. |
| Source | DF | Type III SS | p |
| Chipper | 1 | 1239.876 | <0.0001 |
| Feedstock | 3 | 1117.873 | <0.0001 |
| Chipper*Feedstock | 3 | 49.275 | 0.2561 |
| Productivity | 1 | 2423.577 | <0.0001 |
| Table 6. Consumed energy (MJ) per oven-dry tonne chips by chipper and feedstock type. |
| Feedstock type | Disc | Drum | ∆ Disc (%) |
| Chestnut stem | 20.80a | 24.81a | –16.2 |
| Poplar branches | 21.38a | 25.34a | –15.6 |
| Poplar logs | 24.95b | 28.40b | –12.1 |
| Poplar mill residue | 26.12b | 32.15b | –18.8 |
| Table 7. Anova table for consumed energy per oven-dry tonne by chipper and feedstock type. |
| Source | DF | Type III SS | p |
| Chipper | 1 | 575710069.9 | <0.0001 |
| Feedstock | 3 | 800329555.6 | <0.0001 |
| Chipper*Feedstock | 3 | 29352520.4 | 0.5779 |
| Table 8. Consumed diesel fuel (L) per oven-dry tonne chips by chipper and feedstock type. |
| Feedstock type | Disc | Drum | ∆ Disc (%) |
| Chestnut stem | 2.36a | 2.73a | –13.6 |
| Poplar branches | 2.92b | 3.35b | –12.8 |
| Poplar logs | 2.67b | 3.21b | –16.8 |
| Poplar mill residue | 3.11c | 3.94c | –21.1 |
| Table 9. Anova table for consumed diesel fuel per oven-dry tonne by chipper and feedstock type. |
| Source | DF | Type III SS | p |
| Chipper | 1 | 8.957 | <0.0001 |
| Feedstock | 3 | 15.375 | <0.0001 |
| Chipper*Feedstock | 3 | 0.924 | 0.3818 |
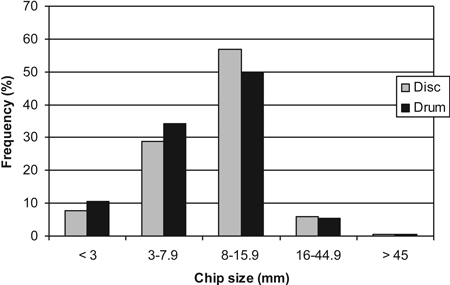
Fig. 3. Average chip size distribution for the disc chipper (grey bars) and drum chipper (black bars).
| Table 10. Particle size distribution by chipper and feedstock type. |
| Chipper | Disc | Drum |
| | Chestnut logs |
| >45 mm | 0.1 | 0.1 |
| 45–16 mm | 3.8 | 3.4 |
| 15.9–8 mm | 50.9 | 43.7 |
| 7.9–3 mm | 36.4 | 42.6 |
| <3 mm | 8.8 | 10.2 |
| | Poplar logs |
| >45 mm | 0.0 | 0.1 |
| 45–16 mm | 3.8 | 3.5 |
| 15.9–8 mm | 63.7 | 60.5 |
| 7.9–3 mm | 25.7 | 27.0 |
| <3 mm | 6.8 | 8.9 |
| | Poplar branches |
| >45 mm | 0.3 | 0.4 |
| 45–16 mm | 5.5 | 5.5 |
| 15.9–8 mm | 52.7 | 44.9 |
| 7.9–3 mm | 32.0 | 36.5 |
| <3 mm | 9.5 | 12.7 |
| | Sawmill residues |
| >45 mm | 0.5 | 0.4 |
| 45–16 mm | 9.6 | 7.8 |
| 15.9–8 mm | 62.9 | 50.5 |
| 7.9–3 mm | 21.5 | 31.1 |
| <3 mm | 5.6 | 10.2 |
| Table 11. Anova table for particle size distribution. |
| Source | DF | Type III SS | p |
| >45 mm |
| Chipper | 1 | 6.502 * 10–5 | 0.8889 |
| Feedstock | 3 | 0.043 | 0.0063 |
| Chipper*Feedstock | 3 | 0.001 | 0.9505 |
| 45–16 mm |
| Chipper | 1 | 0.005 | 0.1926 |
| Feedstock | 3 | 0.237 | <0.0001 |
| Chipper*Feedstock | 3 | 0.004 | 0.6782 |
| 15.9–8 mm |
| Chipper | 1 | 0.179 | <0.0001 |
| Feedstock | 3 | 0.455 | <0.0001 |
| Chipper*Feedstock | 3 | 0.031 | 0.1114 |
| 7.9–3 mm |
| Chipper | 1 | 859.638 | <0.0001 |
| Feedstock | 3 | 3730.834 | <0.0001 |
| Chipper*Feedstock | 3 | 263.547 | 0.0529 |
| <3 mm |
| Chipper | 1 | 0.074 | <0.0001 |
| Feedstock | 3 | 0.065 | <0.0001 |
| Chipper*Feedstock | 3 | 0.016 | 0.0458 |