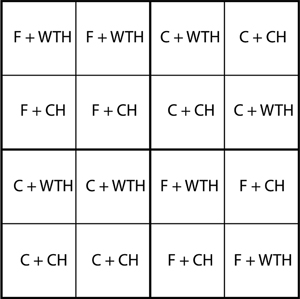
Fig. 1. Schematic map of the experiment showing the four main plots, 16 sub-plots, and four combinations of treatments: non-fertilised + conventional harvest (C + CH), non-fertilised + whole-tree harvest (C + WTH), fertilised + conventional harvest (F + CH), and fertilised + whole-tree harvest (F + WTH).
| Table 1. Degrees of freedom for the variables and their respective error terms included in the GLMs. |
| Source | | df |
| Intercept | Hypothesis | 1 |
| Error | 2 |
| Fertilisation | Hypothesis | 1 |
| Error | 2 |
| WTH | Hypothesis | 1 |
| Error | 10 |
| Block(Fertilisation) | Hypothesis | 2 |
| Error | 10 |
| Fertilisation * WTH | Hypothesis | 1 |
| Error | 10 |
| Table 2. Estimated amount of biomass and N and C/N-ratio in branches, foliage, and total slash on fertilised and non-fertilised plots. Statistics from One-Way ANOVA. The N concentrations and C/N-ratios of branches and foliage were not testable due to absence of within group variation. |
| | Control | Fertilised | P |
| Branches (Mg ha–1) | 17 | 25 | 0.019 |
| N concentration in branches | 0.43 | 0.49 | |
| N in branches (Mg ha–1) | 0.07 | 0.12 | 0.012 |
| C/N in branches | 115 | 101 | - |
| Foliage (Mg ha–1) | 17 | 22 | 0.015 |
| N concentration in foliage | 1.23 | 1.30 | |
| N in foliage (Mg ha–1) | 0.21 | 0.30 | 0.007 |
| C/N in foliage | 41 | 36 | - |
| Slash (Mg ha–1) | 34 | 47 | 0.018 |
| Total N in slash (Mg ha–1) | 0.29 | 0.43 | 0.009 |
| N in slash (%) | 0.9 | 0.8 | 0.004 |
| C/N in slash | 60 | 55 | 0.003 |
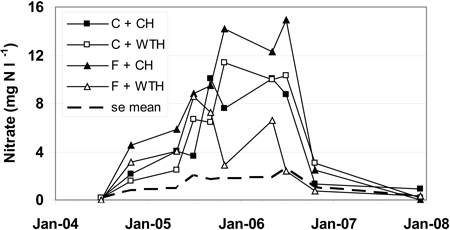
Fig. 2. Nitrate concentrations in soil water (mg NO3-N l–1). The abbreviations are: non-fertilised plots with conventional harvest (C + CH), non-fertilised plots with whole-tree harvest (C + WTH), fertilised plots with conventional harvest (F + CH), fertilised plots with whole-tree harvest (F + WTH), and average standard error (se mean).
| Table 3. Precipitation (P), and total drainage in clear-cut (control and fertilised), and intact control (C), and fertilised plots (F), respectively (mm per year). |
| | P | Clear-cut | C | F |
| 2004 | 860 | 620 | 400 | 350 |
| 2005 | 490 | 360 | 170 | 150 |
| 2006 | 730 | 450 | 240 | 210 |
| 2007 | 840 | 700 | 340 | 290 |
| Mean | 730 | 530 | 290 | 250 |
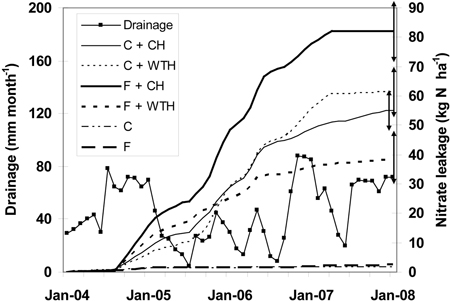
Fig. 3. Drainage (mm month–1) and cumulative nitrate leakage (kg N ha–1) at 0.5 m depth in the soil after clear-cutting in December 2003. The abbreviations are: non-fertilised plots with conventional harvest (C + CH), non-fertilised plots with whole-tree harvest (C + WTH), fertilised plots with conventional harvest (F + CH), fertilised plots with whole-tree harvest (F + WTH), fertilised (F), and control plots (C) that were not clear-cut in 1994. Double arrows to the right indicate final standard error for the respective series.
| Table 4. Statistics for effects of fertilisation and whole-tree harvest (WTH) on the levels of aluminium, calcium, DOC (dissolved organic carbon), DON (dissolved organic nitrogen), potassium, magnesium, ammonium, nitrate, phosphate, and pH in soil water. Effects significant at the 0.1 level in bold. |
| | Fertilisation | WTH | Fertilisation x WTH |
| P | P | P |
| Aluminium | 0.647 | 0.176 | 0.055 |
| Calcium | 0.698 | 0.060 | 0.557 |
| DOC | 0.251 | 0.057 | 0.488 |
| DON | 0.132 | 0.076 | 0.668 |
| Potassium | 0.001 | 0.015 | 0.258 |
| Magnesium | 0.051 | 0.019 | 0.054 |
| Ammonium | 0.419 | 0.016 | 0.057 |
| Nitrate | 0.821 | 0.007 | 0.012 |
| Phosphate | 0.538 | 0.957 | 0.239 |
| pH | 0.429 | 0.042 | 0.071 |
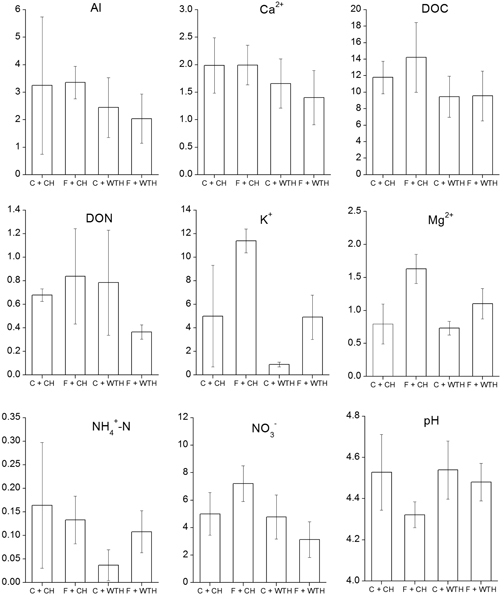
Fig. 4. Average soil water concentrations (mg l–1) of Al, Ca, DOC (dissolved organic carbon), DON (dissolved organic nitrogen), K, Mg, ammonium, nitrate, and pH, that were significant (P<0.1) in the GLM (Table 3). Bars represent from left non-fertilised plots with conventional harvest (C + CH), fertilised plots with conventional harvest (F + CH), non-fertilised plots with whole-tree harvest (C + WTH) and fertilised plots with whole-tree harvest (F + WTH).Error bars show ±2 standard errors.
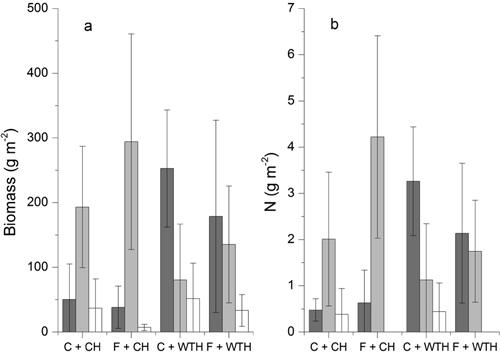
Fig. 5. a) Mean dry weight (g m–2) for Deschampsia flexuosa (dark grey), Rubus idaeus (light grey), and other species (white), b) Mean amount of N (g m–2) for D. flexuosa (dark grey), R. idaeus (light grey), and Pteridium aquilinum (white) in non-fertilised plots with conventional harvest (C + CH), fertilised plots with conventional harvest (F + CH), non-fertilised plots with whole-tree harvest (C + WTH), and fertilised plots with whole-tree harvest (F + WTH). Error bars show ±2 standard errors.
| Table 5. Pearson correlations between concentration of nitrate in the soil water (for 2007 and mean value for the whole period of measurement), weight of the biomass of the forest-floor vegetation, amount of N in the biomass of the forest-floor vegetation as continuous variables, and whole-tree harvest (WTH) and fertilisation as binomial variables. Partial correlation between concentration of nitrate in the soil water, weight of the biomass of the forest-floor vegetation, and amount of N in the biomass of the forest-floor vegetation with WTH and fertilisation as control variables. Correlations significant at the 0.1 level in bold. |
| Correlation | | | 2007 | Mean | Biomass |
| Pearson | Biomass | r | –0.189 | 0.224 | 1.000 |
| p | 0.535 | 0.423 | . |
| Biomass – N | r | –0.254 | 0.546 | 0.798 |
| p | 0.402 | 0.035 | <0.001 |
| WTH | r | –0.108 | –0.478 | 0.232 |
| p | 0.724 | 0.072 | 0.405 |
| Fertilisation | r | –0.256 | –0.034 | 0.201 |
| p | 0.398 | 0.906 | 0.472 |
| Partial | Biomass – weight | r | –0.187 | 0.399 | 1.000 |
| p | 0.582 | 0.177 | . |
| Biomass – N | r | –0.229 | 0.697 | 0.794 |
| p | 0.499 | 0.008 | 0.001 |
| Table 6. Soil compartment nitrogen mass balance (kg N ha–1) for the first four years following clear-cutting |
| | C + CH | C + WTH | F + CH | F + WTH |
| Input to soil |
| Atmospheric deposition | 36 | 36 | 36 | 36 |
| Slash – branches | 70 | 14 | 120 | 24 |
| Slash – foliage | 210 | 42 | 300 | 60 |
| Vegetation litter a) | 44 | 72 | 74 | 59 |
| Total input | 360 | 164 | 530 | 179 |
| Output from soil |
| Uptake in vegetation a) | 73 | 120 | 123 | 98 |
| Leakage | 55 | 61 | 82 | 38 |
| Total output | 128 | 181 | 205 | 136 |
| Change in storage | 232 | –17 | 325 | 43 |