| Table 1. The number of plots by tree species and tending need class in the training data. |
| Main species | Need for tending | Total |
| Immediately | 1–5 years | No need |
| Scots pine | 12 | 37 | 55 | 104 |
| Norway spruce | 19 | 21 | 37 | 77 |
| Deciduous trees | 6 | 8 | 13 | 27 |
| Total | 37 | 66 | 105 | 208 |
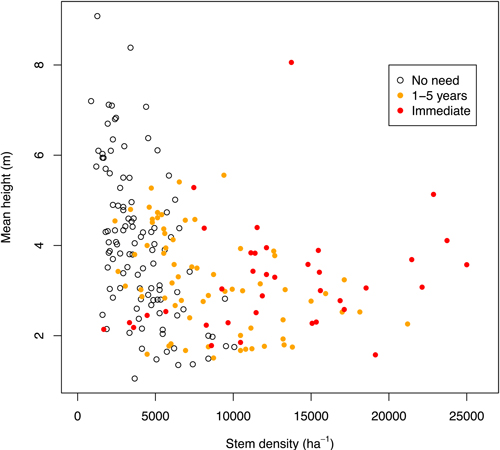
Fig. 1. The tending need classes in the training data as a function of stem density and mean height.
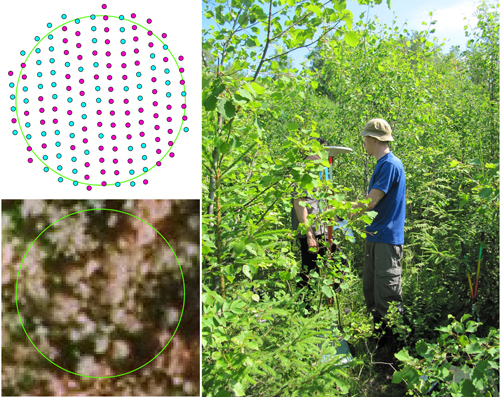
Fig. 2. An example of a seedling plot in ALS data, in aerial image with 25 cm resolution, and in the field. This plot needed tending immediately to free more growing space for the spruce seedlings. However, it is difficult to observe it from the ALS data (red dots are vegetation hits above 0.5 m, blue dots ground hits) or from the aerial image.
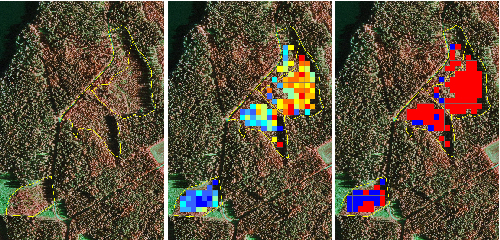
Fig. 3. Left: Four seedling stands delineated on an aerial image. Middle: Probability of tending need predicted by the logistic model. Right: Tending need predicted by the support vector machine. The red color indicates a need for tending and blue indicates no need. Note that some cells are missing because of the 10 meter height limit.
| Table 2. The number of stands by tree species and tending need class in the validation data. |
| Tree species | Need for tending | Total |
| Immediately | 1–5 years | No need |
| Scots pine | 2 | 18 | 9 | 29 |
| Norway spruce | 7 | 14 | 13 | 34 |
| Deciduous trees | 3 | 1 | 1 | 5 |
| Total | 12 | 33 | 23 | 68 |
| Table 3. The accuracies and predictive variables of the best models for tending need in the training data. Prefix f_ denotes first and l_ last echo. Savg is the “sum average” textural feature. |
| Model | Predictors | Overall accuracy | Kappa |
| Logit | f_h50, f_p40, log(savg) | 77% | 0.55 |
| SVM | l_h70, l_p40, l_p5, l_i50, f_h50, l_h30, l_h50 | 86% | 0.71 |
| Table 4. Confusion matrix of the tending need classification using the logistic model. OA = 77%, kappa = 0.55. |
| Logistic model | Field value | |
| Tending | No tending | Total | User’s accuracy |
| Tending | 80 | 24 | 104 | 77% |
| No tending | 23 | 81 | 104 | 78% |
| Total | 103 | 105 | 208 | |
| Producer’s accuracy | 78% | 77% | | |
| Table 5. Confusion matrix of the tending need classification using the support vector machine. OA = 86%, kappa = 0.71. |
| SVM | Field value | |
| Tending | No tending | Total | User’s accuracy |
| Tending | 90 | 17 | 107 | 84% |
| No tending | 13 | 88 | 101 | 87% |
| Total | 103 | 105 | 208 | |
| Producer’s accuracy | 87% | 84% | | |
| Table 6. Error rates in different stand parameter classes for the modeling and validation plots. Note that height was not estimated in the field for the validation stands, so ALS-based f_h80 was used instead*. |
| | Model data | Validation data |
| n | Logistic error % | SVM error % | n | Logistic error % | SVM error % |
| Tending need | No need | 105 | 22.9 | 16.2 | 23 | 30.4 | 43.5 |
| 1–5 years | 66 | 28.8 | 18.2 | 33 | 36.3 | 21.2 |
| Immediate | 37 | 10.8 | 2.7 | 12 | 8.3 | 16.7 |
| Species | Pine | 104 | 26.0 | 14.4 | 29 | 41.4 | 37.9 |
| Spruce | 77 | 20.8 | 15.6 | 34 | 20.6 | 20.6 |
| Deciduous | 27 | 14.8 | 11.1 | 5 | 20.0 | 20.0 |
| Site type | Very fertile | 20 | 20.0 | 20.0 | 6 | 16.7 | 16.7 |
| Fertile | 134 | 20.9 | 14.9 | 53 | 28.3 | 30.2 |
| Rather poor | 46 | 28.3 | 8.7 | 9 | 44.4 | 22.2 |
| Poor | 8 | 25.0 | 25.0 | 0 | - | - |
| Height (*f_h80) | 0–2 | 28 | 25.0 | 17.9 | 6 | 0.0 | 0.0 |
| 2–4 | 106 | 25.5 | 13.2 | 28 | 25.0 | 25.0 |
| 4–6 | 57 | 19.3 | 17.5 | 29 | 37.9 | 34.5 |
| 6+ | 17 | 11.8 | 5.9 | 5 | 40.0 | 40.0 |
| Density | 0–2500 | 32 | 9.4 | 6.2 | 16 | 31.3 | 50.0 |
| 2500–5000 | 61 | 26.2 | 19.7 | 25 | 24.0 | 20.0 |
| 5000–10000 | 66 | 33.3 | 21.2 | 23 | 34.8 | 26.1 |
| >10000 | 49 | 12.2 | 4.1 | 4 | 25.0 | 0.0 |
| Table 7. Confusion matrix of the logistic classifier in the validation stands. OA = 71%, kappa = 0.38. |
| Logistic model | Field value | |
| Tending | No tending | Total | User’s accuracy |
| Tending | 32 | 7 | 39 | 82% |
| No tending | 13 | 16 | 29 | 55% |
| Total | 45 | 23 | 68 | |
| Producer’s accuracy | 71% | 70% | | |
| Table 8. Confusion matrix of the SVM classifier in the validation stands. OA = 72%, kappa = 0.37. |
| SVM | Field value | |
| Tending | No tending | Total | User’s accuracy |
| Tending | 36 | 10 | 46 | 78% |
| No tending | 9 | 13 | 22 | 59% |
| Total | 45 | 23 | 68 | |
| Producer’s accuracy | 80% | 57% | | |
| Table 9. Confusion matrix of the logistic classifier for the omission of 25% of the validation stands having the highest reliability. OA = 100%, kappa = 1.00. |
| Logistic model | Field value | Total |
| Tending | No tending |
| Tending | 14 | 0 | 14 |
| No tending | 0 | 3 | 3 |
| Total | 14 | 3 | 27 |
| Table 10. Confusion matrix of the SVM for the omission of 25% of the validation stands having the highest reliability. Overall accuracy = 81%, kappa = 0.43. |
| SVM | Field value | |
| Tending | No tending | Total | User’s accuracy |
| Tending | 16 | 1 | 17 | 94% |
| No tending | 3 | 1 | 4 | 25% |
| Total | 19 | 2 | 21 | |
| Producer’s accuracy | 84% | 50% | | |
| Table 11. Confusion matrix of the logistic classifier for the omission of 50% of the validation stands having the highest reliability. Overall accuracy = 91%, kappa = 0.80. |
| Logistic model | Field value | |
| Tending | No tending | Total | User’s accuracy |
| Tending | 21 | 0 | 21 | 100% |
| No tending | 3 | 10 | 13 | 77% |
| Total | 24 | 10 | 34 | |
| Producer’s accuracy | 88% | 100% | | |
| Table 12. Confusion matrix of the SVM for the omission of 50% of the validation stands having the highest reliability. Overall accuracy = 79%, kappa = 0.40. |
| SVM | Field value | |
| Tending | No tending | Total | User’s accuracy |
| Tending | 23 | 3 | 26 | 88% |
| No tending | 4 | 4 | 8 | 50% |
| Total | 27 | 7 | 34 | |
| Producer’s accuracy | 85% | 57% | | |
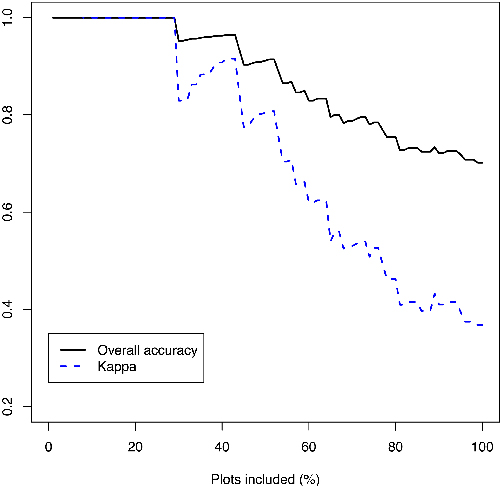
Fig. 4. Overall accuracy and kappa of the logistic model in the validation stands with the most reliable predictions. The percentage at the x-axis describes the proportion of stands that would be left without field check, and the y-axis shows the consequent model errors.