| Table 1. Total area of restoration fires, surveyed area and area of sampled plots in the three studied forests, Trollmosseskogen, Långsidberget and Berga. Number of dead wood objects (logs, stumps, high stumps and snags) and measured variables are presented. *Only logs measured. | ||||
| Trollmosseskogen | Långsidberget | Berga | Measured variables | |
| Restoration fire area | 70 ha | 52 ha | 32 ha | |
| Surveyed area | 6.3 ha | 5.3 ha | 12 ha | Pre-fire dead wood Consumption of pre-fire dead wood Fire severity |
| Number of dead wood objects | 328 | 193 | 153* | |
| Total area of sampled plots | 0.4 ha | 0.5 ha | 1 ha | Pre- and post fire basal areas Tree mortality and dead wood addition Fire intensity |
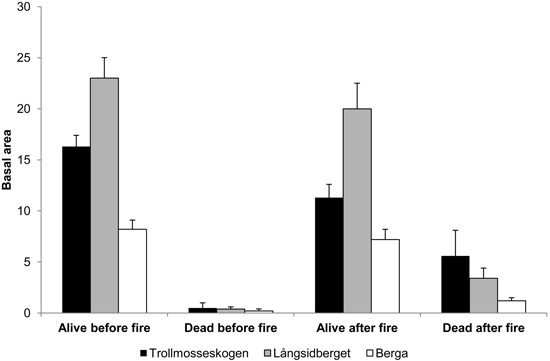
Fig. 1. Mean basal area (m2 ha–1) ± SE of all living and standing dead trees (Pinus sylvestris, Picea abies and Betula spp. ) before and after fire in the three studied forests: Trollmosseskogen, Långsidberget and Berga.
| Table 2. Dead coarse pine wood (m3 ha–1) before and after the fires in Trollmosseskogen, Långsidberget and Berga (only logs and snags). | |||
| Dead wood (m3 ha–1) | |||
| Trollmosseskogen | Långsidberget | Berga | |
| Before fire a) | 11.8 | 15.0 | 1.5 |
| Loss a) | 4.8 | 3.4 | 0.4 |
| Addition b) | 35.0 | 3.8 | 2.0 |
| After fire c) | 42.0 | 15.4 | 3.1 |
| a) Based on studied stands within the burned area. b) Based on 0.1 ha plots within the studied stands. c) Calculated. | |||
| Table 3. Mean volume (m3, ± SE) of individual dead pine wood before and after the restoration fires in Trollmosseskogen, Långsidberget and Berga. *Only logs measured. | ||||||||||||
| Mean volume per wood type (m3) | ||||||||||||
| All wood types | Trollmosseskogen | Långsidberget | Berga | |||||||||
| Before fire | After fire | % loss | n | Before fire | After fire | % loss | n | Before fire | After fire | % loss | n | |
| Logs | 0.3 ± 0.03 | 0.2 ± 0.02 | 33 | 188 | 0.6 ± 0.07 | 0.5 ± 0.06 | 17 | 101 | 0.13 ± 0.01 | 0.09 ± 0.01 | 31 | 153 |
| Stumps | 0.1 ± 0.01 | 0.05 ± 0.01 | 50 | 82 | 0.2 ± 0.02 | 0.1 ± 0.01 | 50 | 56 | * | * | * | * |
| High stumps | 0.2 ± 0.03 | 0.06 ± 0.02 | 70 | 16 | 0.2 ± 0.03 | 0.1 ± 0.02 | 50 | 13 | * | * | * | * |
| Snags | 0.3 ± 0.02 | 0.2 ± 0.03 | 33 | 42 | 0.5 ± 0.07 | 0.4 ± 0.06 | 20 | 23 | * | * | * | * |
| Mean | 0.2 ± 0.02 | 0.1 ± 0.01 | 50 | 328 | 0.4 ± 0.04 | 0.3 ± 0.03 | 25 | 193 | 0.13 ± 0.01 | 0.09 ± 0.01 | 31 | 153 |
| Table 4. Results from the GLM model of the effect of base diameter, decay stage and fire area on the consumption of logs. No interaction term was significant and included in the model. | ||||
| Estimate | SD | Z-value | P-value | |
| Base diameter | –0.02380 | 0.01099 | –2.165 | 0.03 |
| Decay stage | 0.65499 | 0.09969 | 6.570 | <0.001 |
| Fire area | –0.41851 | 0.14822 | –2.823 | 0.005 |
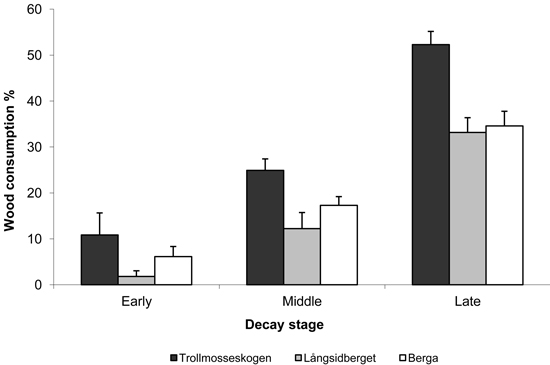
Fig. 2. Mean proportions (%) of wood in logs in indicated decay stages (± SE) consumed by fire in the three study areas. Early, middle and late decay stages refer to decay stages 1 & 2, 3 & 4 and 5 & 6, respectively (Söderström 1988 classification).
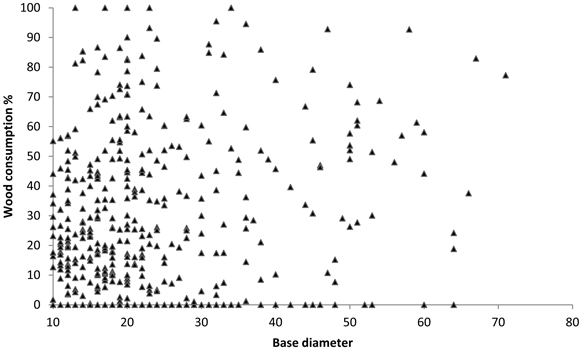
Fig. 3. Wood consumption of logs in relation to base diameter in all study areas. Each triangle representing one log, n = 188, 101, 153 in Trollmosseskogen, Långsidberget and Berga, respectively.
| Table 5. Numbers of logs and their characters before and after the fires. All values are mean values ± SE. *Not measured at Berga. | ||||||
| Logs | Trollmosseskogen | Långsidberget | Berga | |||
| Before fire | After fire | Before fire | After fire | Before fire | After fire | |
| Number | 188 | 182 | 101 | 101 | 153 | 153 |
| Base diameter (cm) | 23.5 ± 0.9 | 18.9 ± 1.0 | 29.7 ± 1.5 | 26.6 ± 1.5 | 18.7 ± 0.5 | 16.9 ± 0.5 |
| Length (m) | 9.0 ± 0.5 | 7.6 ± 0.4 | 10.3 ± 0.7 | 9.6 ± 0.7 | 7.5 ± 0.3 | 6.9 ± 0.3 |
| Charred wood (%) | 3 ± 2 | 57 ± 2 | 9 ± 2 | 68 ± 2 | 0 ± 0 | 63 ± 2 |
| Moss cover (%) | 15 ± 2 | 6 ± 1 | 42 ± 4 | 1 ± 1 | * | * |
| Ground contact (%) | 44 ± 2 | 39 ± 2 | 46 ± 3 | 44 ± 3 | 59 ± 3 | 30 ± 2 |
| Table 6. Results from the GLM model of the effect of tree base diameter, fire intensity and fire area on the tree mortality. No interaction term was significant and included in the model. | ||||
| Estimate | SD | Z-value | P-value | |
| Base diameter | 0.1793 | 0.0261 | 6.868 | <0.001 |
| Fire intensity | –0.7348 | 0.1260 | –5.830 | <0.001 |
| Fire area | 0.5994 | 0.2258 | 2.654 | 0.008 |
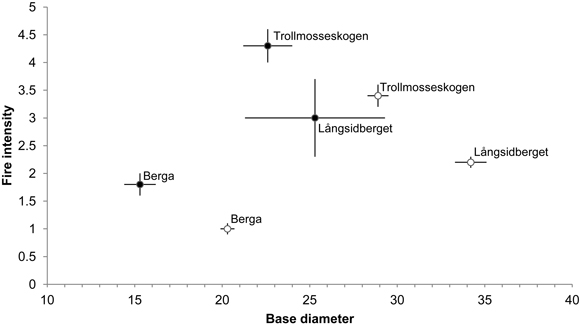
Fig. 4. Mean base diameter (cm) (± SE) in relation to mean fire intensity (i.e flame heigth (m)) (± SE) of dead (●) and alive (○) Pinus sylvestris trees following restoration fire. Numbers of dead and alive trees are: 42, 4 and 26, and 95, 126 and 301 at Trollmosseskogen, Långsidberget and Berga respectively.