| Table 1. Mean decay class 1 fine woody debris (FWD) and coarse woody debris (CWD) nutrient concentrations pooled across species and FWD nutrient concentrations for each species by decay class. Standard errors are in parentheses. Carbon is presented in percent total (%), while all other nutrients are in mg kg–1. Sample sizes are n = 50 for decay class 1 FWD and CWD nutrient concentrations within each group and n = 10 for FWD nutrient concentrations within each species/decay class combination. Within each row, values with similar letters are not significantly different (p > 0.05) for decay class 1 FWD and CWD nutrient concentrations pooled across species and separately for FWD nutrient concentrations by species and decay class. View in new window/tab. |
| Table 2. Analysis of variance (ANOVA) table for all nutrients analyzed in fine woody debris (FWD) including the main factors and interaction, F-values with degrees of freedom, and probabilities for each nutrient analyzed. Comparisons among species, decay class, and the interaction are presented with significant differences (p ≤ 0.05) highlighted in bold. | ||||||
| Nutrient | Species | Decay class | Species X decay class | |||
| F(4, 90) | p | F(1, 90) | p | F(4, 90) | p | |
| C | 38.11 | <.0001 | 6.28 | 0.0140 | 0.99 | 0.4175 |
| N | 5.26 | 0.0007 | 1.03 | 0.3124 | 1.28 | 0.2840 |
| P | 2.57 | 0.0431 | 27.09 | <.0001 | 3.03 | 0.0215 |
| K | 7.70 | <.0001 | 61.64 | <.0001 | 2.66 | 0.0377 |
| Ca | 6.37 | 0.0001 | 2.52 | 0.1160 | 1.59 | 0.1829 |
| Mg | 5.18 | 0.0008 | 0.32 | 0.5756 | 4.09 | 0.0043 |
| Na | 4.03 | 0.0048 | 1.90 | 0.1718 | 0.95 | 0.4385 |
| Mn | 80.90 | <.0001 | 11.14 | 0.0012 | 4.44 | 0.0026 |
| Al | 8.11 | <.0001 | 23.40 | <.0001 | 1.29 | 0.2804 |
| B | 11.40 | <.0001 | 2.01 | 0.1596 | 1.41 | 0.2361 |
| Cu | 6.52 | 0.0001 | 1.54 | 0.2185 | 1.14 | 0.3431 |
| Fe | 3.20 | 0.0167 | 20.86 | <.0001 | 1.69 | 0.1598 |
| Zn | 59.31 | <.0001 | 2.36 | 0.1279 | 0.20 | 0.9357 |
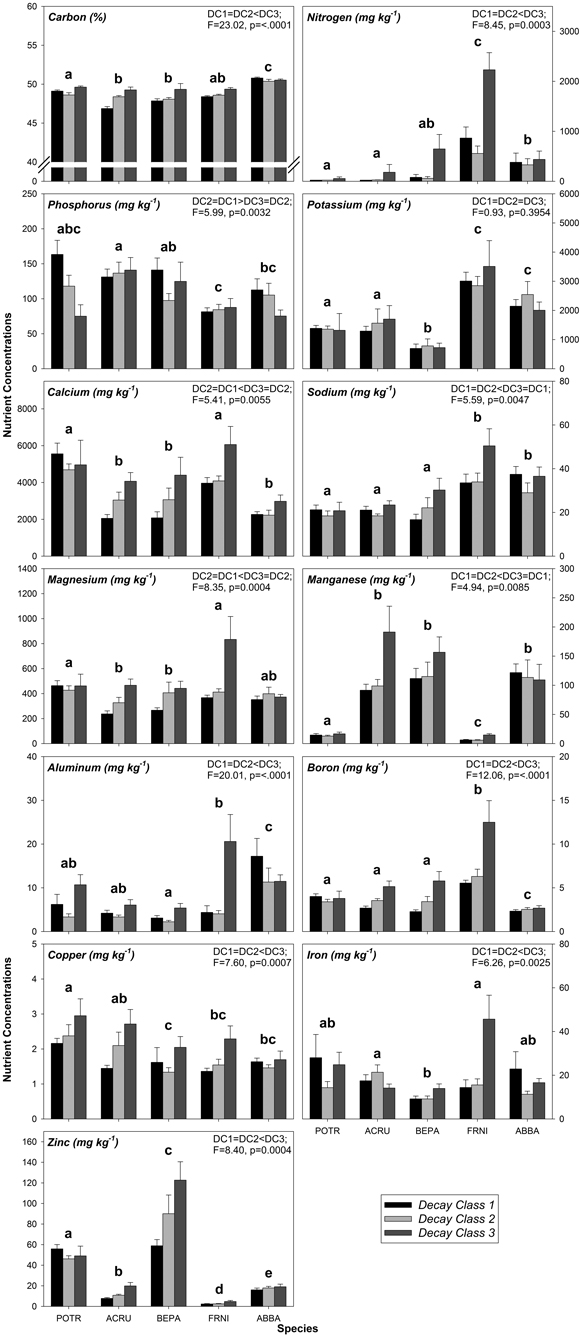
Fig. 1. Mean coarse woody debris (CWD) nutrient concentrations by decay class grouped by species. Similar letters above species groups within a graph indicate no significant differences (p > 0.05) between species, where POTR = Populus tremuloides, ACRU = Acer rubrum, BEPA = Betula papyrifera, FRNI = Fraxinus nigra, and ABBA = Abies balsamea. Data in upper right corner of each graph indicate significant differences (p ≤ 0.05) between decay classes alone, where DC = decay class. Sample sizes within each species/decay class are n = 10.
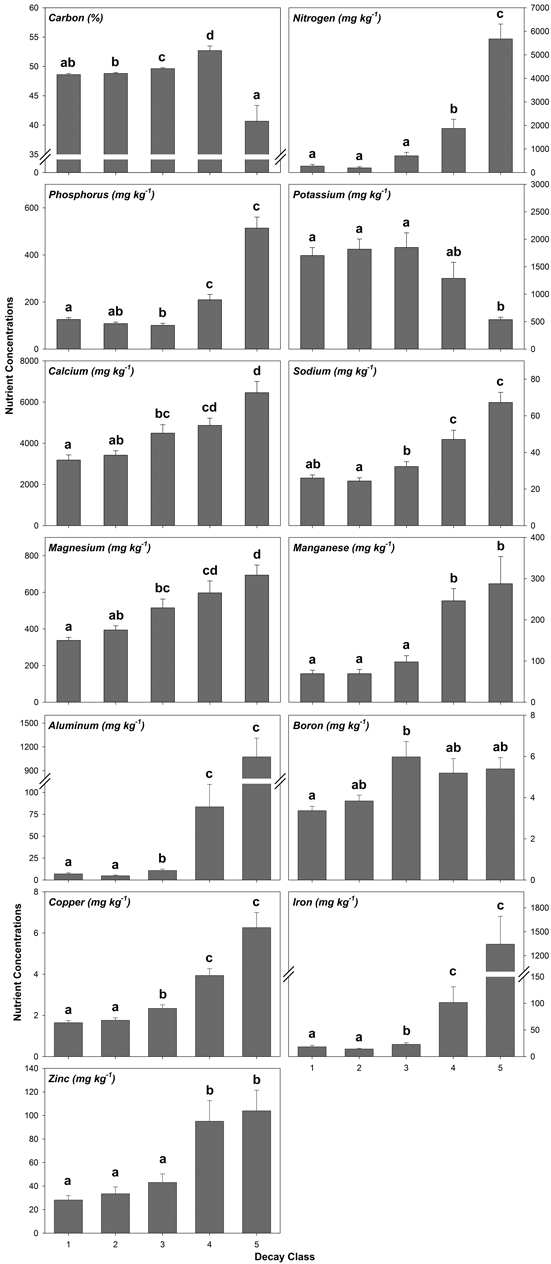
Fig. 2. Mean coarse woody debris (CWD) nutrient concentrations by decay class pooled across species/wood type. Values with similar letters are not significantly different (p > 0.05). Sample sizes within decay classes 1–3 are n = 50, decay class 4 are n = 20, and decay class 5 are n = 10.