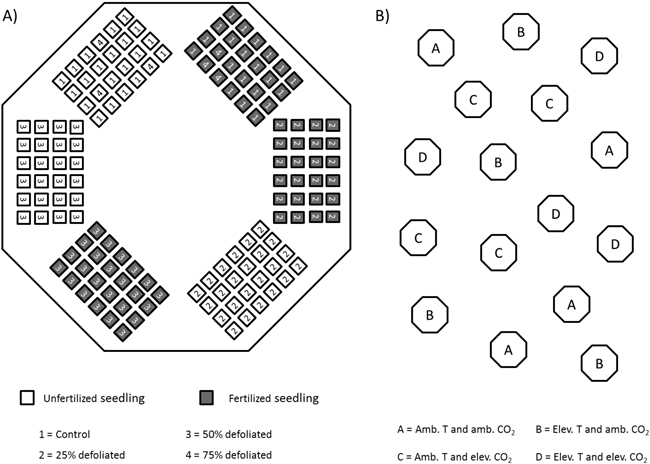
Fig. 1. Schematic figure of silver birch seedlings in climate-controlled closed-top chambers in 2002. A) randomized placement of seedling-trays in each chamber; B) location of chambers in the field.
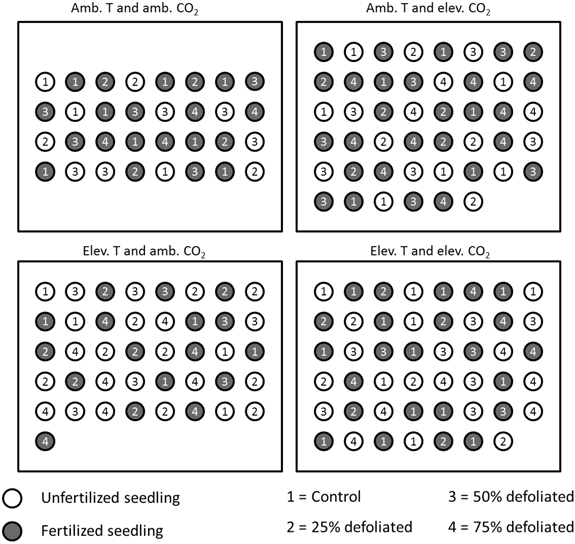
Fig. 2. Placement of differently treated silver birch seedlings in the built environments in 2003 (figure is not drawn to scale). Within each climate treatment, all the seedlings were located randomly, and their positions re-randomized each week. The distance between the seedlings was 20 cm.
| Table 1. Summary of cross tabulations for survived and dead seedlings. The term “survived” refers to overwintered seedlings and “dead” to seedlings that were winterkilled or suffered from broken stems. The percentage (%) of each group indicates the proportion of all the 384 seedlings in the 2003 experiment. | ||||||||||
| Treatment | ||||||||||
| Amb. T and amb. CO2 | Amb. T and elev. CO2 | Elev. T and amb. CO2 | Elev. T and elev. CO2 | Total | ||||||
| Number | % | Number | % | Number | % | Number | % | Number | % | |
| Survived | 32 | 8.3 | 46 | 12.0 | 41 | 10.7 | 47 | 12.2 | 166 | 43.2 |
| Dead | 64 | 16.7 | 50 | 13.0 | 55 | 14.3 | 49 | 12.8 | 218 | 56.8 |
| Total | 96 | 25.0 | 96 | 25.0 | 96 | 25.0 | 96 | 25.0 | 384 | 100.0 |
| Fertilized | Unfertilized | Total | ||||||||
| Number | % | Number | % | Number | % | |||||
| Survived | 90 | 23.4 | 76 | 19.8 | 166 | 43.2 | ||||
| Dead | 102 | 26.6 | 116 | 30.2 | 218 | 56.8 | ||||
| Total | 192 | 50.0 | 192 | 50.0 | 384 | 100.0 | ||||
| Control | 25% defoliated | 50% defoliated | 75% defoliated | Total | ||||||
| Number | % | Number | % | Number | % | Number | % | Number | % | |
| Survived | 49 | 12.8 | 41 | 10.7 | 40 | 10.4 | 36 | 9.4 | 166 | 43.2 |
| Dead | 47 | 12.2 | 55 | 14.3 | 56 | 14.6 | 60 | 15.6 | 218 | 56.8 |
| Total | 96 | 25.0 | 96 | 25.0 | 96 | 25.0 | 96 | 25.0 | 384 | 100.0 |
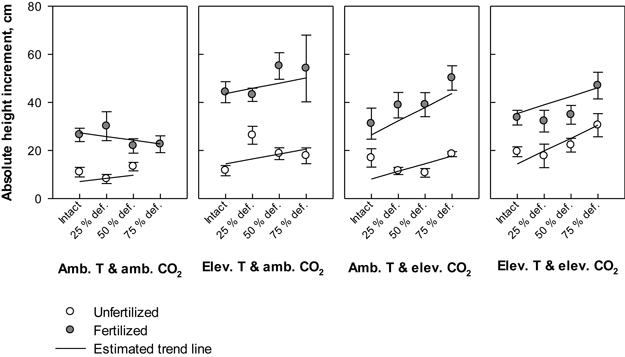
Fig. 3. Absolute height increment (cm) of silver birch seedlings during the growing season 2003. The plot results are based on untransformed data, where mean values of different treatment combinations with the standard errors are presented. The trend line is based on the least squares means (LS means) provided by SAS/MIXED. Abbreviations: Amb. T = ambient temperature; Elev. T = elevated temperature; Amb. CO2 = ambient CO2; Elev. CO2 = elevated CO2.
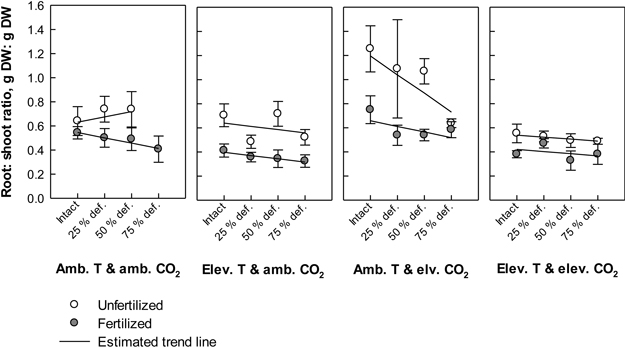
Fig. 4. Root: shoot ratios (biomass of roots in proportion to biomass of stems + leaves) of silver birch seedlings in different treatment combinations at the end of the experiment. The plot results are based on untransformed data, where mean values of different treatment combinations with the standard errors are presented. The trend line is based on the least squares means (LS means) provided by SAS/MIXED. Abbreviations: Amb. T = ambient temperature; Elev. T = elevated temperature; Amb. CO2 = ambient CO2; Elev. CO2 = elevated CO2.