| Table 1. Regime means of basal area, stem volume, biomass, number of stems ha–1, dominant height, mean diameter at breast height weighted against basal area (Dgv), mean Dgv for the 1000 and 2000 largest lodgepole pine trees ha–1 for each treatment after inventory autumn 2011. Means with different letters are different at the 0.05 level of significance according to Tukey's multiple comparison test (no test for number of stems). | ||||||||
| Silvicultural regime | Number of stems (ha–1) | Dgv (cm) | Dgv 1000 largest trees ha–1 (cm) | Dgv 2000 largest trees ha–1 (cm) | Basal area (m2 ha–1) | Stem volume (m3 ha–1) | Biomass (ton ha–1) | Dominant height (m) |
| Conventional | 2150 | 8.0 b | 8.9 a | 8.0 a | 9.3 c | 31.5 b | 21.6 c | 7.2 a |
| High biomass | 15331 | 6.2 c | 8.8 a | 8.1 a | 21.4 a | 73.9 a | 52.8 a | 7.6 a |
| Large dimension | 1663 | 8.9 a | 9.6 a | - | 8.8 c | 30.4 b | 20.6 c | 7.5 a |
| Combined | 4481 | 7.7 b | 9.6 a | 8.7 a | 16.1 b | 63.0 a | 39.5 b | 7.7 a |
| Table 2. Damage results of different regimes. Number of trees presented in total number of stems ha–1, as a ratio of total number of trees (%), in basal area (m2 ha–1), and as a ratio of total basal area (%). Means with different letters are different at the 0.05 level of significance according to Tukey´s multiple comparison test. | ||||
| Damage class | Number of trees (ha–1) | Ratio of total number of trees (%) | Basal area (m2 ha–1) | Ratio of total basal area (%) |
| Leaning and laying trees | ||||
| Conventional | 263 b | 12.0 a | 0.87 a | 9.3 a |
| High biomass | 319 ab | 2.1 a | 0.37 a | 1.6 a |
| Large dimension | 263 b | 15.8 a | 0.99 a | 11.3 a |
| Combined | 406 a | 9.0 a | 1.13 a | 7.0 a |
| Broken stems and dead trees | ||||
| Conventional | 38 a | 1.7 a | 0.09 a | 1.0 a |
| High biomass | 213 a | 1.3 a | 0.14 a | 0.6 a |
| Large dimension | 69 a | 4.0 a | 0.13 a | 1.4 a |
| Combined | 144 a | 3.3 a | 0.20 a | 1.3 a |
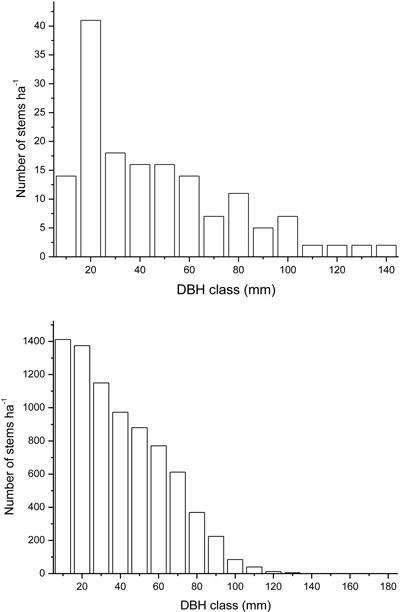
Fig. 1. a) In the top: diameter distribution of dead trees (stems ha–1) in all unthinned plots (High biomass treatment). b) Below: diameter distribution of all living trees in all unthinned plots (High biomass treatment). Different scales are used in the two diagrams.
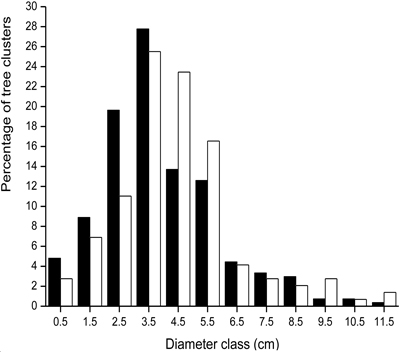
Fig. 2. Arithmetic mean diameter at breast height distribution (class-middle shown on the x axis) in the tree clusters remaining after 70% corridor thinning (black = 0.3 m wide strips left between 0.7 m wide corridors; white = 0.6 m wide strips left between 1.4 m wide corridors).
| Table 3. Stand characteristics after corridor thinning in High biomass regime, including number of trees and tree clusters, basal area, and mean diameter at breast height (1.3 m) weighted against basal area (Dgv) for all trees in autumn 2012. Number of trees ha–1 with DBH > 50 mm, and 80 mm, Dgv for the 1000 and 2000 largest trees (only lodgepole pines) per hectare, and Dgv and mean height for dominant trees within retained tree groups based on all trees left after harvest. Means with different letters are different at the 0.05 level of significance according to Tukey's multiple comparison test. View in new window/tab. |
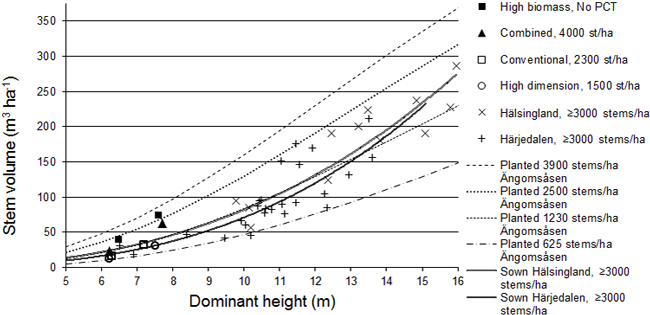
Fig. 3. Stem volume development with respect to dominant height of Bjärkliden regimes (as measured 2008 and 2011) compared to planted stands in Ängomsåsen, Sundsvall (Elfving 1996) and sown stands in Härjedalen and Hälsingland (Backlund and Bergsten 2012).