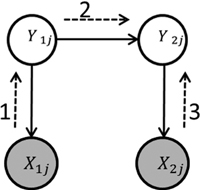
Fig. 1. Bayesian network representation of the joint probability distribution p(X1j, X2j, Y1j, Y2j). Shaded nodes represent the observed variables, the nodes without shading the hidden variables. The solid-line arrows represent the relationships between the variables. The numbered dashed-line arrows show the sequence of message propagation for inferring the posterior distribution of Y2j.
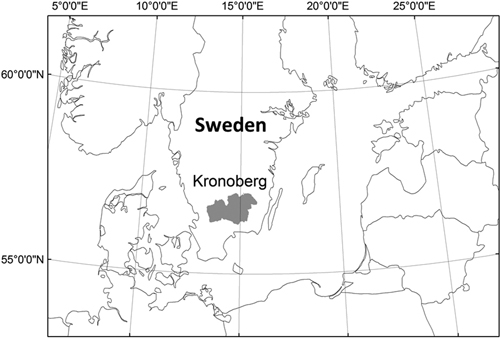
Fig. 2. Study area Kronoberg County.
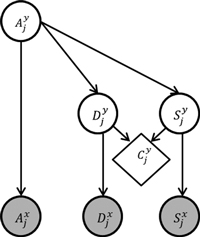
Fig. 3. Bayesian network model for estimating pixels’ class membership probabilities in deciduous forest mapping problem. The variable Djy is deciduous volume, Sjy coniferous volume, Ajy age, and Cjy is forest class. Djx, Sjx and Ajx represent the k-NN estimates of the respective forest attributes. Shaded nodes represent the observed variables, the nodes without shading the hidden variables. The rhomboid shape of the node indicates that Cjy is a deterministic function of Djy and Sjy.
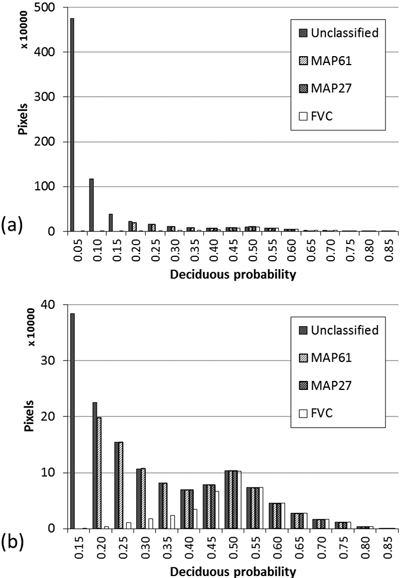
Fig. 4. Distribution of pixels by deciduous class membership probability. Unclassified – all pixels prior to classification; MAP61, MAP27 and FVC – only pixels labeled as deciduous using the respective classificationg method. (a) Full range of values; (b) left-hand side truncated at 0.10.
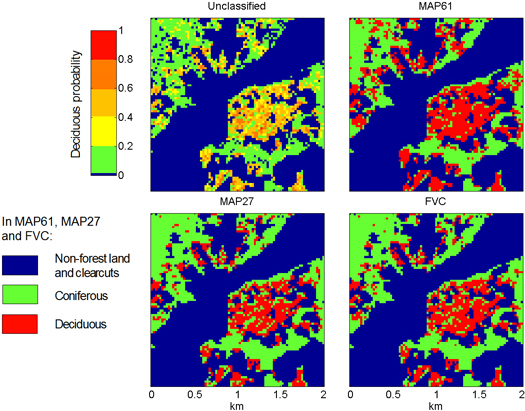
Fig. 5. A fragment of the study area (left bottom corner coordinates x: 1367200, y: 6334550 ; coordinate system RT1990). Unclassified – probability map with no class labels assigned; MAP61, MAP27 and FVC – maps produced using the respective classification method. The bar on the left shows the colors used for different levels of deciduous class membership probabilities in the unclassified map.
| Table A1. Pixel level relative RMSE and means for different forest attribute mapping projects using k-NN method. | |||||||
| 1-A | 1-B | 1-C | 1-D | 2-A | 2-B | 2-C | |
| RMSE, age (%) | - | 49 | 57 | 53 | - | - | - |
| Mean age (years) | - | 58.9 | 60.0 | 69.0 | - | - | - |
| RMSE, pine volume (%) | - | 73 | - | - | 147.6 | 131.2 | 121.7 |
| Mean pine volume (m3/ha) | - | - | - | - | - | - | 65.5 |
| RMSE, spruce volume (%) | - | 88 | - | - | 116.0 | 118.2 | 111.7 |
| Mean spruce volume (m3/ha) | - | - | - | - | - | - | 69.2 |
| RMSE, deciduous volume (%) | - | 163.3 | - | - | 157.5 | 206.9 | 148.0 |
| Mean deciduous volume (m3/ha) | - | 18.5 | - | - | - | - | 34.9 |
| RMSE, total volume (%) | 59 | 66 | 58 | 69 | 66.3 | 68.2 | 57.3 |
| Mean total volume (m3/ha) | 120.3 | 165.1 | 187 | 115 | - | - | 80.1 |
| Sources: 1-A Västerbotten, 1-B Gävleborg, 1-C Dalarna and 1-D Älvsbyn projects (Reese et al. 2003; Reese et al. 2002); 2-A and 2-B are two different study areas in Finland; 2-C includes only sample plots located at least 30 m from stand boundary (Tokola et al. 1996). | |||||||
| Table A2. Parameters of the probability distributions for age and volume estimates: relative, minimum and maximum standard deviation. | |||
| σr | σmin | σmax | |
| Age (A) | 50% | 30 years | 150 years |
| Deciduous volume (D) | 150% | 30 m3 | 250 m3 |
| Deciduous volume (D) a) | 75% | 30 m3 | 250 m3 |
| Coniferous volume (C) | 80% | 30 m3 | 250 m3 |
| a) sensitivity analysis | |||