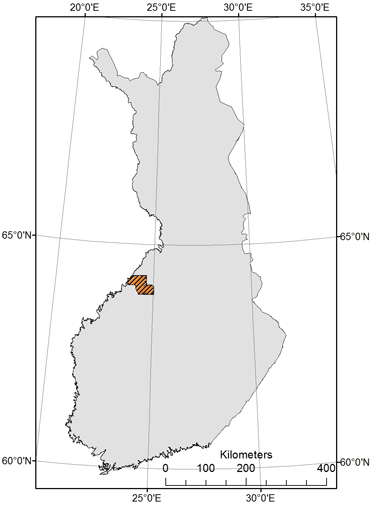
Fig. 1. The location of the study area.
| Table 1. Main features of the two data types. |
| | NFI | FC |
| Plot type | Relascope | Variable radius circular |
| Radius/relascope factor | Central Finland factor 2 (max. radius 12.52 m), Southern North Finland factor 1.5 (max. radius 12.45 m). | Radius 5.64–9 m |
| Selection of plots | Systematic clustered sampling | Subjective stratified selection |
| Positioning | GPS (appr. 5 m accuracy) | GPS (appr. 1 m accuracy) |
| Average number of tally trees | 11.5 | 37.7 |
| Range of the number of tally trees per plot | 1–29 | 8–109 |
| Area represented by one plot a) | Central Finland 338 ha, Southern North Finland 417 ha | 318 ha (varies per inventory area) |
| Measurement years | 2006–2010 | 2010 |
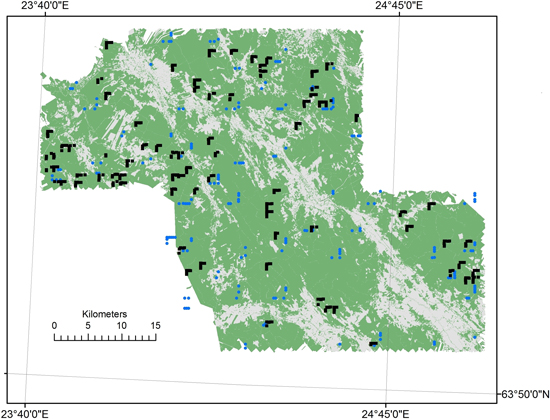
Fig. 2. The field sample layout in the study area defined by the laser scanning coverage (forestry land is shown in green, © MML, 2011). NFI plots = blue circles and FC plots = black rectangles.
| Table 2. The statistics of the used sample plot combinations: mean, standard deviation (SD), maximum (Max). |
| Statistic | Dataset | H, m | D, cm | Vol, m3/ha | Pine, m3/ha | Spruce, m3/ha | Broadl., m3/ha |
| Mean | FC | 12.07 | 14.29 | 116.97 | 62.22 | 32.54 | 22.22 |
| Mean | Replaced | 12.18 | 14.68 | 116.87 | 64.25 | 31.32 | 21.3 |
| Mean | NFIa | 12.93 | 16.08 | 117.42 | 64.79 | 24.35 | 28.28 |
| Mean | NFIb | 13.54 | 17.12 | 117.72 | 68.99 | 22.88 | 25.86 |
| Mean | FC+NFIa | 12.32 | 14.8 | 117.1 | 62.95 | 30.21 | 23.94 |
| Mean | FC+NFIb | 12.34 | 14.81 | 117.11 | 63.46 | 30.77 | 22.88 |
| SD | FC | 4.94 | 6.4 | 82.61 | 58.78 | 54.65 | 33.48 |
| SD | Replaced | 4.94 | 6.51 | 81.86 | 60.28 | 53.6 | 33.55 |
| SD | NFIa | 3.27 | 4.36 | 70.54 | 55 | 45.23 | 46.92 |
| SD | NFIb | 3.18 | 4.42 | 67.08 | 56.7 | 37.23 | 42.88 |
| SD | FC+NFIa | 4.54 | 5.94 | 79.31 | 57.7 | 52.24 | 37.85 |
| SD | FC+NFIb | 4.7 | 6.18 | 79.93 | 58.41 | 52 | 35.38 |
| Max | FC | 22 | 33.6 | 428.6 | 329.1 | 321.3 | 233.4 |
| Max | Replaced | 22 | 33.6 | 428.6 | 329.1 | 321.3 | 265.8 |
| Max | NFIa | 20.4 | 27.6 | 347.6 | 255.3 | 333 | 265.8 |
| Max | NFIb | 20.4 | 27.6 | 282.7 | 255.3 | 161.6 | 265.8 |
| Max | FC+NFIa | 22 | 33.6 | 428.6 | 329.1 | 333 | 265.8 |
| Max | FC+NFIb | 22 | 33.6 | 428.6 | 329.1 | 321.3 | 265.8 |
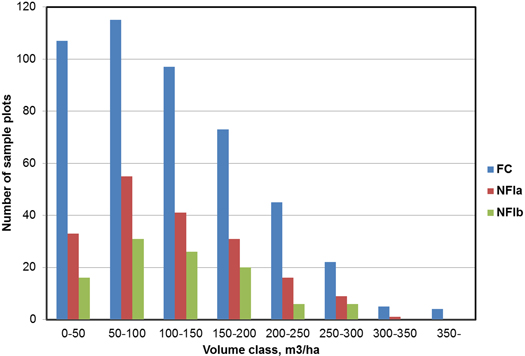
Fig. 3. The distribution of volume on the FC and NFI plots.
| Table 3. The attributes covered by the ALS data for lidar pulses. |
| Column | Attribute description |
| 1 | x co-ordinate (X, EUREF-FIN Easting) |
| 2 | y co-ordinate (Y, EUREF-FIN Northing) |
| 3 | z co-ordinate (Z, height above sea level) |
| 4 | Intensity (I) |
| 5 | Classification (ground pulse / other) |
| 6 | Number of the return |
| Table 4a. Accuracy of the mean-height estimates. |
| Reference | Target | RMSE (m) | RMSE (%) | Bias (m) |
| FC | FC | 1.05 | 8.67 | 0.01 |
| Replaced | FC | 1.11 | 9.20 | 0.05 |
| FC+NFIb | FC | 1.08 | 8.93 | 0.02 |
| Replaced | Replaced | 1.17 | 9.56 | 0.00 |
| FC+NFIb | NFIb | 1.42 | 10.49 | –0.12 |
| FC | FC+NFIb | 1.12 | 9.10 | –0.01 |
| FC+NFIb | FC+NFIb | 1.15 | 9.31 | –0.01 |
| FC+NFIa | FC+NFIa | 1.18 | 9.57 | 0.00 |
| Table 4b. Accuracy of the mean-diameter estimates. |
| Reference | Target | RMSE (cm) | RMSE (%) | Bias (cm) |
| FC | FC | 2.23 | 15.64 | –0.01 |
| Replaced | FC | 2.33 | 16.29 | 0.29 |
| FC+NFIb | FC | 2.26 | 15.83 | 0.14 |
| Replaced | Replaced | 2.39 | 16.27 | –0.01 |
| FC+NFIb | NFIb | 2.93 | 17.12 | –0.87 |
| FC | FC+NFIb | 2.38 | 16.10 | –0.18 |
| FC+NFIb | FC+NFIb | 2.40 | 16.20 | –0.05 |
| FC+NFIa | FC+NFIa | 2.35 | 15.88 | 0.00 |
| Table 4c. Accuracy of the total-volume estimates. |
| Reference | Target | RMSE (m3/ha) | RMSE (%) | Bias (m3/ha) |
| FC | FC | 25.43 | 21.74 | 0.02 |
| Replaced | FC | 27.70 | 23.68 | –0.18 |
| FC+NFIb | FC | 26.75 | 22.87 | –0.97 |
| Replaced | Replaced | 26.72 | 23.64 | 0.05 |
| FC+NFIb | NFIb | 32.69 | 27.77 | 4.82 |
| FC | FC+NFIb | 27.33 | 23.34 | 0.94 |
| FC+NFIb | FC+NFIb | 27.93 | 23.85 | 0.09 |
| FC+NFIa | FC+NFIa | 29.41 | 25.12 | 0.01 |
| Table 4d. Accuracy of the pine volume estimates. |
| Reference | Target | RMSE (m3/ha) | RMSE (%) | Bias (m3/ha) |
| FC | FC | 30.41 | 48.87 | 1.56 |
| Replaced | FC | 30.84 | 49.56 | 1.75 |
| FC+NFIb | FC | 29.85 | 47.98 | 0.55 |
| Replaced | Replaced | 30.90 | 48.09 | 0.92 |
| FC+NFIb | NFIb | 33.08 | 47.96 | 4.95 |
| FC | FC+NFIb | 32.02 | 50.46 | 2.27 |
| FC+NFIb | FC+NFIb | 30.47 | 48.01 | 1.36 |
| FC+NFIa | FC+NFIa | 32.58 | 51.76 | 1.54 |
| Table 4e. Accuracy of the spruce volume estimates. |
| Reference | Target | RMSE (m3/ha) | RMSE (%) | Bias (m3/ha) |
| FC | FC | 23.73 | 72.92 | –0.33 |
| Replaced | FC | 24.01 | 73.8 | –0.86 |
| FC+NFIb | FC | 23.16 | 71.16 | –1.00 |
| Replaced | Replaced | 23.53 | 75.12 | 0.06 |
| FC+NFIb | NFIb | 20.41 | 89.22 | 3.75 |
| FC | FC+NFIb | 23.95 | 77.84 | 0.57 |
| FC+NFIb | FC+NFIb | 22.68 | 73.7 | –0.13 |
| FC+NFIa | FC+NFIa | 24.12 | 79.85 | –0.12 |
| Table 4f. Accuracy of the broadleaf volume estimates. |
| Reference | Target | RMSE (m3/ha) | RMSE (%) | Bias (m3/ha) |
| FC | FC | 19.72 | 88.75 | –1.21 |
| Replaced | FC | 21.01 | 94.56 | –1.06 |
| FC+NFIb | FC | 19.21 | 86.45 | –0.52 |
| Replaced | Replaced | 20.29 | 95.29 | –0.94 |
| FC+NFIb | NFIb | 28.27 | 109.35 | –3.89 |
| FC | FC+NFIb | 21.6 | 94.37 | –1.90 |
| FC+NFIb | FC+NFIb | 21.16 | 92.47 | –1.14 |
| FC+NFIa | FC+NFIa | 22.12 | 92.40 | –1.40 |