| Table 1. Chipper characteristics and operators’ weight. |
| Chipper # | 1 | 2 | 3 | 4 |
| Manufacturer | A | A | B | B |
| Type | Tractor | Truck | Tractor | Truck |
| Power [kW] | 286 | 397 | 217 | 353 |
| Drum speed [rpm] | 600 | 600 | 560 | 560 |
| Mass tractor/ truck [kg] | 10 830 | 26 000 | 10 450 | 26 820 |
| Mass chipper [kg] | 17 500 | Included in truck’s
weight | 16 000 | Included in truck’s
weight |
| Total setup mass [kg] | 28 330 | 26 000 | 26 450 | 26 820 |
| Year of construction | 2012 | 2011 | 2008 | 2011 |
| Operating hours [PSH15] | 170 | 970 | 4741 | 3280 |
| Seat suspension | Mechanical | Mechanical | Mechanical | Mechanical |
| Weight of operator [kg] | 90 | 93 | 103 | 70 |
| Table 2. Raw material characteristics per chipper model and wood species. |
| Species | Poplar | Spruce | Poplar | Poplar | Oak | Oak | Oak | Oak |
| Chipper model | A1 | A2 | B3 | B4 | A1 | A2 | B3 | B4 |
| Fresh density [kg/m3] | 644 | 650 | 680 | 621 | 950 | 866 | 869 | 817 |
| Oven-dry density [kg/m3] | 411 | 438 | 483 | 431 | 673 | 658 | 641 | 616 |
| Water content [%] | 36 | 33 | 29 | 31 | 29 | 24 | 26 | 25 |
| Diameter (Mean ± Sd) [cm] | 25 ± 11 | 15 ± 5 | 15 ± 7 | 25 ± 10 | 20 ± 8 | 25 ± 10 | 17 ± 6 | 23 ± 9 |
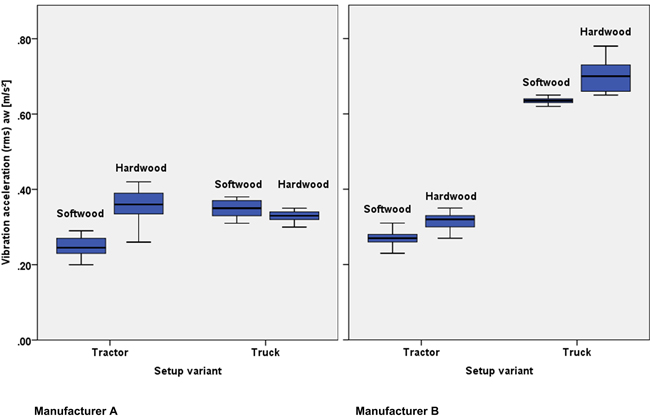
Fig. 2. Vibration during chipping per setup variant, manufacturer and wood type. The bottom and top of the box represent the first (25%, lower end) and third (75%, upper end) quartiles. The black strip in the middle is the median. The brackets outline maximum deviations in both directions.
| Table 3. Frequency-weighted vibration acceleration (rms) in m/s² – Manufacturer A. |
| Working element | Wood type | Tractor | Truck |
| Mean | Sd | Min | Max | Mean | Sd | Min | Max |
| Chipping | Soft | 0.25 | 0.03 | 0.20 | 0.29 | 0.35 | 0.02 | 0.31 | 0.38 |
| Hard | 0.35 | 0.04 | 0.26 | 0.39 | 0.33 | 0.01 | 0.30 | 0.34 |
| Driving | Soft/Hard | 0.64 | 0.05 | 0.58 | 0.68 | 0.60 | 0.09 | 0.50 | 0.77 |
| Delays | Soft/Hard | 0.11 | 0.04 | 0.07 | 0.17 | 0.06 | 0.01 | 0.04 | 0.07 |
| Table 4. Frequency-weighted vibration acceleration (rms) in m/s² – Manufacturer B. |
| Working element | Wood type | Tractor | Truck |
| Mean | Sd | Min | Max | Mean | Sd | Min | Max |
| Chipping | Soft | 0.27 | 0.02 | 0.23 | 0.31 | 0.63 | 0.02 | 0.58 | 0.65 |
| Hard | 0.31 | 0.03 | 0.27 | 0.35 | 0.70 | 0.04 | 0.65 | 0.78 |
| Driving | Soft/Hard | 0.84 | 0.17 | 0.53 | 1.08 | 0.50 | 0.12 | 0.24 | 0.64 |
| Delays | Soft/Hard | 0.05 | 0.02 | 0.02 | 0.08 | 0.13 | 0.02 | 0.10 | 0.14 |
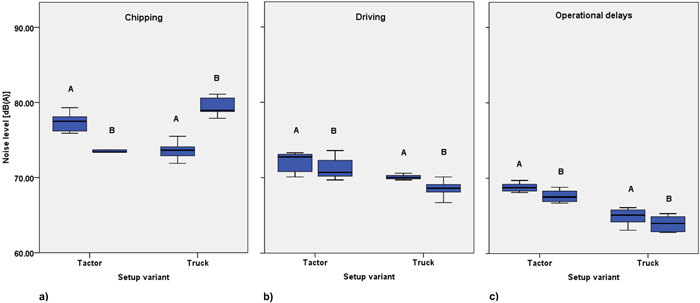
Fig. 3. Noise level for various working elements separated for setup variant, for manufacturer A and B. The bottom and top of the box represent the first (25%, lower end) and third (75%, upper end) quartiles. The black strip in the middle is the median. The brackets outline maximum deviations in both directions.
| Table 5. Noise level for various working elements during chipping hardwood – Manufacturer A. |
| Working element | Machine type | Lp,A,eq,Te [dB(A)] | Lp,C,peak [dB(C)] |
| Mean | Sd | Min | Max | Mean | Sd | Min | Max |
| Chipping | Tractor | 77.4 | 1.1 | 75.9 | 79.3 | 102.3 | 1.2 | 100.1 | 103.9 |
| Truck | 73.5 | 1.0 | 71.9 | 75.5 | 101.4 | 1.2 | 99.7 | 103.2 |
| Driving | Tractor | 72.1 | 1.2 | 70.1 | 73.3 | 99.9 | 0.8 | 98.8 | 100.8 |
| Truck | 70.0 | 1.0 | 68.5 | 72.3 | 99.1 | 0.8 | 97.9 | 100.1 |
| Delays | Tractor | 68.8 | 0.5 | 68.1 | 69.7 | 93.1 | 0.6 | 92.4 | 94.4 |
| Truck | 64.9 | 1.0 | 63.1 | 66.1 | 90.4 | 0.5 | 89.7 | 91.2 |
| Table 6. Noise level for various working elements during chipping hardwood – Manufacturer B. |
| Working element | Machine type | Lp,A,eq,Te [dB(A)] | Lp,C,peak [dB(C)] |
| Mean | Sd | Min | Max | Mean | Sd | Min | Max |
| Chipping | Tractor | 73.6 | 0.9 | 71.9 | 74.9 | 100.6 | 1.4 | 98.1 | 102.4 |
| Truck | 79.4 | 1.2 | 77.9 | 81.1 | 100.7 | 1.1 | 99.7 | 102.3 |
| Driving | Tractor | 71.2 | 1.3 | 69.7 | 73.6 | 100.2 | 0.9 | 98.7 | 101.7 |
| Truck | 68.3 | 1.2 | 65.9 | 70.1 | 99.6 | 0.9 | 97.9 | 100.7 |
| Delays | Tractor | 67.6 | 0.7 | 66.7 | 68.8 | 90.6 | 0.8 | 89.1 | 92.1 |
| Truck | 63.9 | 1.0 | 62.8 | 65.3 | 90.5 | 0.6 | 89.7 | 91.7 |
| Table 7. Total vibration and A(8) values during the chipping of hardwood. |
| Task | Time [hours] | Total vibration value aw [m/s²] |
| Chipper A1 | Chipper A2 | Chipper B3 | Chipper B4 |
| Chipping | 4.8 | 0.35 | 0.33 | 0.27 | 0.70 |
| Driving | 0.4 | 0.64 | 0.60 | 0.84 | 0.50 |
| Delays | 2.0 | 0.11 | 0.06 | 0.05 | 0.13 |
Maintenance and breaks
(no exposure to vibration) | 0.8 | 0 | 0 | 0 | 0 |
| A(8) | 8.0 | 0.31 | 0.29 | 0.28 | 0.56 |
| Table 8. Sound level per task and total exposure values during the chipping of hardwood. |
| Task | Time [hours] | Sound level Lp,A,eq,Te [dB(A)] |
| Chipper A1 | Chipper A2 | Chipper B3 | Chipper B4 |
| Chipping | 4.8 | 77.4 | 73.5 | 73.6 | 79.4 |
| Driving | 0.4 | 72.1 | 70.0 | 71.2 | 68.3 |
| Delays | 2.0 | 68.8 | 64.9 | 67.6 | 63.9 |
Maintenance and breaks
(machine not operating) | 0.8 | 55.0 | 55.0 | 55.0 | 55.0 |
| Total (LA,EX, 8h) | 8.0 | 75.5 | 71.7 | 72.0 | 77.3 |