| Table 1. Mean values and standard deviations of stem diameter and each wood property. | |||||||
| Family name | n | Stem diameter (cm) | ARW (mm) | MFA (degree) | AD (g cm–3) | MOE (GPa) | MOR (MPa) |
| Akan 101 | 9 | 20.5 ± 3.0 | 2.9 ± 0.4 | 9.5 ± 0.6 | 0.42 ± 0.03 | 8.57 ± 0.76 | 71.0 ± 4.8 |
| Akan 102 | 6 | 22.1 ± 3.6 | 3.0 ± 0.4 | 9.8 ± 0.6 | 0.43 ± 0.01 | 8.51 ± 0.39 | 72.0 ± 3.9 |
| Akan 104 | 4 | 20.3 ± 1.4 | 2.9 ± 0.2 | 10.9 ± 0.6 | 0.41 ± 0.03 | 7.51 ± 0.56 | 68.6 ± 4.1 |
| Asyoro 101 | 6 | 23.2 ± 5.0 | 3.1 ± 0.9 | 10.1 ± 0.6 | 0.40 ± 0.02 | 7.78 ± 0.64 | 66.1 ± 5.6 |
| Shirataki 102 | 7 | 19.8 ± 2.4 | 2.7 ± 0.4 | 10.1 ± 0.9 | 0.42 ± 0.02 | 8.44 ± 0.83 | 75.9 ± 6.0 |
| Honbetsu 106 | 7 | 17.2 ± 5.0 | 2.4 ± 0.6 | 9.0 ± 0.7 | 0.44 ± 0.02 | 8.85 ± 1.05 | 77.2 ± 9.6 |
| Honbetsu 107 | 6 | 21.0 ± 4.6 | 2.8 ± 0.6 | 9.7 ± 0.5 | 0.40 ± 0.02 | 7.67 ± 0.53 | 66.4 ± 4.2 |
| Honbetsu 111 | 4 | 19.7 ± 2.2 | 2.7 ± 0.3 | 9.0 ± 0.2 | 0.41 ± 0.02 | 8.23 ± 0.97 | 69.3 ± 6.7 |
| Rubeshibe 110 | 7 | 17.7 ± 3.6 | 2.5 ± 0.6 | 9.2 ± 0.8 | 0.41 ± 0.02 | 8.17 ± 0.58 | 71.0 ± 4.5 |
| Mean/Total | 56 | 20.2 ± 1.9 | 2.8 ± 0.2 | 9.7 ± 0.6 | 0.42 ± 0.01 | 8.19 ± 0.45 | 70.8 ± 3.8 |
| F-value | 1.684ns | 1.380ns | 4.588** | 2.150* | 2.246* | 2.775* | |
| ARW, annual ring width; MFA, microfibril angle of the S2 layer; AD, air-dry density; MOE, modulus of elasticity; MOR, modulus of rupture; **, significant difference (p < 0.01); *, significant difference (p < 0.05); ns, no significant difference among families. | |||||||
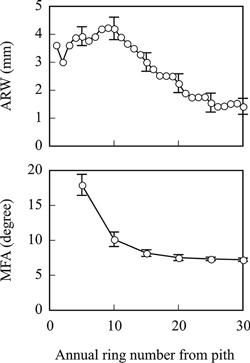
Fig. 1. Radial variation of the mean values of ARW and MFA in latewood tracheid of the nine families of Picea glehnii. Bars indicate standard deviation. ARW, annual ring width; MFA, microfibril angle of the S2 layer.
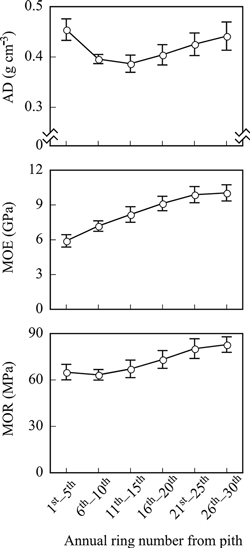
Fig. 2. Radial variations of mean values of AD, MOE, and MOR of the nine families of Picea glehnii. Bars indicate standard deviation. AD, air-dry density; MOE, modulus of elasticity; MOR, modulus of rupture.
| Table 2. Age trends of F-values and coefficient of variation for each wood property. | ||||
| Annual ring number from the pith | ||||
| 1st–5th | 6th–10th | 11th–15th | 16th–30th | |
| ARW | 2.074ns (7.5) | 2.734* (9.2) | 1.208ns (9.2) | 1.131ns (15.5) |
| MFA | 3.937** (8.4) | 5.382** (10.2) | 2.536* (5.8) | 4.146** (3.8) |
| AD | 2.774* (4.7) | 0.611ns (2.3) | 2.483* (4.4) | 2.653* (4.7) |
| MOE | 2.667* (9.0) | 3.892** (6.3) | 4.652** (8.2) | 1.737ns (6.0) |
| MOR | 3.627** (7.7) | 2.729* (5.4) | 3.955** (8.4) | 1.702ns (6.6) |
| Values between parentheses indicate coefficients of variation calculated from nine mean values in each family at each position; ARW, annual ring width; MFA, microfibril angle of the S2 layer; AD, air-dry density; MOE, modulus of elasticity; MOR, modulus of rupture; **, significant difference (p < 0.01); *, significant difference (p < 0.05); ns, no significant difference among families. | ||||
| Table 3. Relationships between ARW and wood properties in juvenile and mature woods. | ||||
| MFA | AD | MOE | MOR | |
| Juvenile wood | 0.470ns | 0.101ns | –0.466ns | –0.553ns |
| Mature wood | 0.465ns | –0.778* | –0.723* | –0.768* |
| n = 9; ARW, annual ring width; MFA, microfibril angle of the S2 layer; AD, air-dry density; MOE, modulus of elasticity; MOR, modulus of rupture; **, significant correlation (p < 0.01); *, significant correlation (p < 0.05); ns, not significant. Juvenile wood: mean value of 1st–15th annual ring; mature wood: mean value of 16th–30th annual ring. | ||||
| Table 4. Correlation coefficients between mean values from pith to bark and values at each age for each wood property. | ||||||
| 1st–5th | 6th–10th | 11th–15th | 16th–20th | 21st–25th | 26th–30th | |
| MFA | 0.923** | 0.972** | 0.931** | 0.866** | 0.780* | 0.903** |
| AD | 0.343ns | 0.869** | 0.779* | 0.771* | 0.779* | 0.919** |
| MOE | 0.758* | 0.961** | 0.896** | 0.791* | 0.821** | 0.611ns |
| MOR | 0.617ns | 0.897** | 0.772* | 0.841** | 0.863** | 0.871** |
| n = 9; MFA, microfibril angle of the S2 layer; AD, air-dry density; MOE, modulus of elasticity; MOR, modulus of rupture; **, significant correlation (p < 0.01); *, significant correlation (p < 0.05); ns, not significant. | ||||||