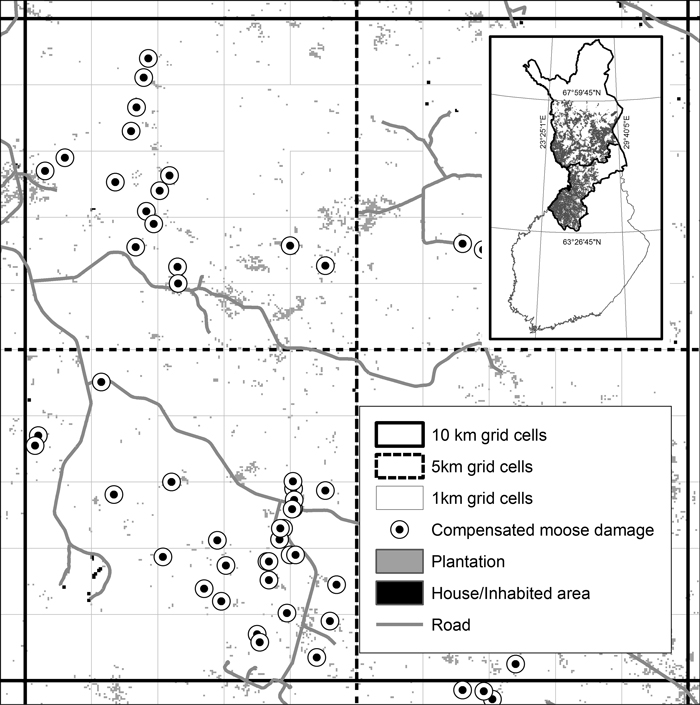
Fig. 1. An illustration of the study setup. Grid cells of 1 km, 5 km and 10 km were overlaid on located moose damage and land use and forest classification (for a complete list of variables see Tables 1a,b). Grey areas on the index map show the location of privately owned land in the study area and bolded lines delineate the provinces of Ostrobothnia and Lapland.
| Table 1a. Original land use and road classification was formed of 19 classes whose criteria are shown in right column (Variabes #1–19). Middle column gives a description of habitat type, land use and cover type and road class. | |||
| Var# | Acronym | Habitat-, land use- or road class | Criteria |
| 1 | OPENMIN | Treeless areas on mineral soil | Mineral soil, total tree volume ≤4 m3 ha–1 |
| 2 | OPENPEAT | Treeless areas on peatland | Peatland, total tree volume ≤4 m3 ha–1 |
| 3 | PINEPLAMIN | Pine-dominated plantations on mineral soil | Mineral soil, total tree volume 5–42 m3 ha–1 |
| 4 | PINEPLAPEATND | Pine-dominated plantations on non-drained peatland | Peatland, non-drained, total tree volume 5–42 m3 ha–1 |
| 5 | PINEPLAPEATDR | Pine-dominated plantations on drained peatland | Peatland, drained, total tree volume 5–42 m3 ha–1 |
| 6 | OTHERPLANT | Non-pine-dominated plantations on mineral soil or on either drained or non-drained peatland | Mineral soil and peatland, non-drained and drained, total tree volume 5–42 m3 ha–1 |
| 7 | PINETHIMIN | Young pine-dominated thinning forests on mineral soil | Mineral soil, total tree volume 43–81 m3 ha–1 |
| 8 | PINETHIPEATND | Young pine-dominated thinning forests on non-drained peatland | Peatland, non-drained, total tree volume 43–81 m3 ha–1 |
| 9 | PINETHIPEATDR | Young pine-dominated thinning forests on drained peatland | Peatland, drained, total tree volume 43–81 m3 ha–1 |
| 10 | OTHERTHI | Non-pine-dominated thinning forests on mineral soil or on either drained or on non-drained peatland | Mineral and peatland, non-drained and drained, total tree volume 43–81 m3 ha–1 |
| 11 | MATURE | Advanced thinning forests and mature forests on mineral soil or on either drained or non-drained peatland | Mineral and peatland, non-drained and drained, total tree volume >81 m3 ha–1 |
| 12 | WATER | Water | Classified as water in MS-NFI data |
| 13 | INHABITED | Inhabited area | Classified as inhabited area in MS-NFI data |
| 14 | AGRI | Agricultural field | Classified as agricultural in MS-NFI data |
| 15 | MANMADE | Other man-made | Classified as other man-made in MS-NFI data |
| 16 | MAINROAD | Motorways and main roads | Finnish Transport Agency (FTA) class I and class II main roads in national road classification, >8 m wide, asphalt pavement |
| 17 | REGROAD | Regional roads | FTA regional roads, 5–6.5 m wide, asphalt and oil gravel pavement |
| 18 | CONNROAD | Connecting roads | FTA connecting roads, 4–5 m wide, mainly asphalt and oil gravel pavement |
| 19 | FORROAD | Forestry road | FTA functional classes 5 and 6, gravel |
| Table 1b. In the different steps of modelling further variables #20–32 were formed by summing the original classes (right column). Middle column gives a description of habitat type, land use and cover type and road class. The average number of damage per year in neighboring cells (NNDAMAGE) was forced to both the count and zero models at each step and to the final models. | |||
| Var# | Acronym | Habitat-, land use- or road class | Criteria |
| 20 | FORESTSUM | Sum of all types of forests | Sum of variables #3–11 |
| 21 | MANMADESUM | Sum of man-made areas on non-forestry land | INHABITED + AGRI + MANMADE |
| 22 | PLANTSUM | Sum of all plantations | PINEPLAMIN + PINEPLAPEATND + PINEPLAPEATDR + OTHERPLANT |
| 23 | PINEPLANTSUM | Sum of pine-dominated plantations on mineral soil and peatlands | PINEPLAMIN + PINEPLAPEATND + PINEPLAPEATDR |
| 24 | PINEPLANTPEAT-SUM | Sum of pine-dominated plantations on peatlands | PINEPLAPEATND + PINEPLAPEATDR |
| 25 | THINNSUM | Sum of all thinning forests | PINETHIMIN + PINETHIPEATND + PINETHIPEATDR + OTHERTHI |
| 26 | PINETHINNSUM | Sum of pine dominated thinning forests | PINETHIMIN + PINETHIPEATND + PINETHIPEATDR |
| 27 | PINETHINNPEAT-SUM | Sum of pine-dominated thinning forests on peatlands | PINETHIPEATND + PINETHIPEATDR |
| 28 | PINEPEATSUM | Sum of pine-dominated plantations and thinning forests on peatlands | PINEPLAPEATND + PINEPLAPEATDR + PINETHIPEATND + PINETHIPEATDR |
| 29 | PINEDRSUM | Sum of pine-dominated plantations and thinning forests on drained peatlands | PINEPLAPEATDR + PINETHIPEATDR |
| 30 | PINENDSUM | Sum of pine-dominated younger forests on non-drained peatlands | PIENPLAPEATND + PINETHIPEATND |
| 31 | PINEMINSUM | Sum of pine-dominated plantations and thinning forests on mineral soil | PINEPLAMIN + PINETHIMIN |
| 32 | ROADSUM | Sum of the length of all types of roads | MAINROAD + REGHIGHWAY + CONNROAD + FORROAD |
| NNDAMAGE | An average number of damage per year in neighboring cells | ||
| Table 2. Model steps and the effect of different landscape features on moose damage that were tested in each step. At each step, models were constructed as many times as was necessary to find a combination of only significant variables in both the count and zero models. A final model was constructed by entering all significant variables from each step to the same model and by finding variable combinations with the lowest AIC and where all variables in the both count and zero models were significant. At each step, also the average number of damage in neighboring cells (NNDAMAGE) was forced to both the count and zero models. | |||
| Model step, unit | Original variables in model | Hypothesized effect on damage risk | Reference |
| #1, % | FORESTSUM | Sum of all types of forests | (Michaud et al. 2014) |
| #2, % | FORESTSUM and MANMADESUM | Effect of forests and man-made habitats | (Frid and Dill 2002; Michaud et al. 2014) |
| #3, % | OPENMIN, OPENPEAT, PLANTSUM, THINNSUM and MATURE | Effect of open habitats and forest development classes in forestry land | (Cederlund and Okarma 1988; Cassing et al. 2006; Olsson et al. 2011) |
| #4, % | PINEPLANTSUM, OTHERPLANT, PINETHINNSUM and OTHERTHI | Effect of tree species in plantations and thinning forests | (Bjørneraas et al., 2011; Bergqvist et al., 2014) |
| #5, % | PINEPLAMIN, PINEPLANTPEATSUM, PINETHIMIN and PINETHINNPEATSUM | Effect of soil type in pine dominated younger forest development classes | (Heikkilä et al. 1996; Olsson et al. 2011) |
| #6, % | PINEMINSUM and PINEPEATSUM | Effect of soil type in pine dominated younger forest development classes | (Heikkilä et al. 1996) |
| #7, % | PINEPLAPEATDR, PINEPLAPEATND, PINETHIPEATDR and PINETHIPEATND | Effect of drainage in pine dominated plantations and thinning forests on peatlands | (Heikkilä and Härkönen 1993) |
| #8, % | PINEDRSUM and PINENDSUM | Effect of drainage in pine dominated younger development classes on peatlands | (Heikkilä and Härkönen 1993) |
| #9, %, km | INHABITED, AGRI, MANMADE and ROADSUM | Effect of different types of man-modified areas | (Herfindal et al. 2009; Bjørneraas et al. 2011) |
| #10, km | MAINROAD, REGROAD, CONNROAD and FORROAD | Effect of road types | (Ball and Dahlgren 2002; Beyer et al. 2013) |
| Table 3. Coefficients, standard error of mean, Z-test value, and significance of the best combination of model variables explaining the amount of moose damage (count model) and the occurrence of a non-damage landscape (zero model) in Ostrobothnia for 1 km2, 25 km2 and 100 km2 landscape sizes. See Tables 1a,b for variable descriptions. | ||||||||||
| Landscape size | Count model | Coeff | Std. Error | Z | Pr(>|z|) | Zero model | Coeff | Std. Error | Z | Pr(>|z|) |
| 1 km2 | Intercept | –3.020 | 0.2074 | –14.557 | <0.0001 | Intercept | 2.9666 | 0.1940 | 15.29 | <0.0001 |
| PINEPLAMIN | 0.0251 | 0.0089 | 2.8 | 0.0051 | MATURE | –0.0177 | 0.0039 | –4.533 | <0.0001 | |
| OTHERPLANT | 0.0715 | 0.0073 | 9.748 | <0.0001 | NNDAMAGE | –11.5357 | 1.1283 | –10.224 | <0.0001 | |
| THINNSUM | 0.0283 | 0.0045 | 6.204 | <0.0001 | ||||||
| MATURE | 0.0156 | 0.0023 | 6.661 | <0.0001 | ||||||
| INHABITED | –0.1121 | 0.0310 | –3.61 | 0.0003 | ||||||
| NNDAMAGE | 0.6801 | 0.0567 | 11.991 | <0.0001 | ||||||
| Log(theta) | –0.5132 | 0.0786 | –6.525 | <0.0001 | ||||||
| 25 km2 | Intercept | –1.7445 | 0.4615 | –3.78 | 0.0001 | Intercept | 3.8015 | 0.7310 | 5.2 | <0.0001 |
| INHABITED | –0.0535 | 0.0265 | –2.018 | 0.0435 | THINNSUM | –0.0605 | 0.0241 | –2.505 | 0.0122 | |
| PLANTSUM | 0.0650 | 0.0113 | 5.75 | <0.0001 | MATURE | –0.0415 | 0.0105 | –3.948 | <0.0001 | |
| MATURE | 0.0331 | 0.0063 | 5.194 | <0.0001 | NNDAMAGE | –0.7188 | 0.1045 | –6.877 | <0.0001 | |
| NNDAMAGE | 0.1396 | 0.0146 | 9.518 | <0.0001 | ||||||
| Log(theta) | 0.2535 | 0.1154 | 2.196 | 0.0281 | ||||||
| 100 km2 | Intercept | –2.0130 | 0.6761 | –2.977 | 0.00291 | Intercept | 10.6547 | 3.3201 | 3.209 | 0.00133 |
| PLANTSUM | 0.0931 | 0.0177 | 5.24 | <0.0001 | OPENMIN | –7.0583 | 3.1600 | –2.234 | 0.02551 | |
| MATURE | 0.0458 | 0.0106 | 4.32 | <0.0001 | MATURE | –0.2559 | 0.0793 | –3.224 | 0.00126 | |
| NNDAMAGE | 0.0649 | 0.0094 | 6.853 | <0.0001 | NNDAMAGE | –0.21 | 0.1237 | –1.697 | 0.08967 | |
| Log(theta) | –0.0676 | 0.1221 | –0.554 | 0.57988 | ||||||
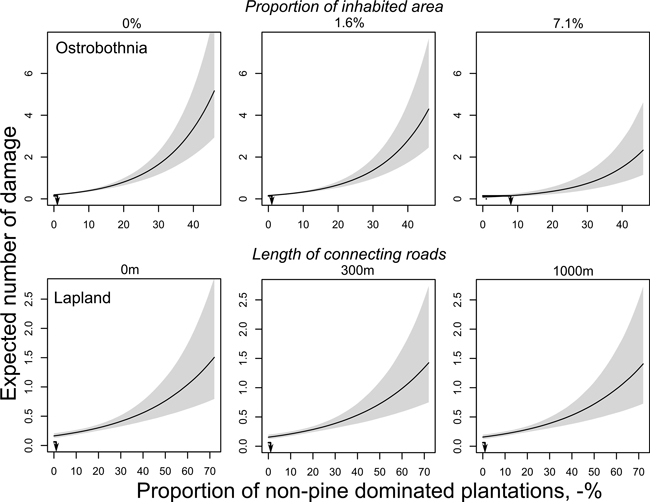
Fig. 2. Predicted number of moose damage per 1 km2 landscape size in relation to the proportion of non-pine-dominated plantations and different proportions of inhabited areas in Ostrobothnia (upper row) and the length of connecting roads in Lapland (lower row). Predictions were calculated for different proportions of non-pine-dominated plantations by using Q1 (left column), Q2 (middle column) and 90% quartile (right column) for the proportion of inhabited area and length of roads while keeping all other possible covariates at their means. Arrow lines show the average number of damaged plantations during years 2002–2008 (Y-axis) and change in moose damage risk per plantation area (X-axis) as a function of different levels of co-variates. Grey area shows 95% confidence limits.
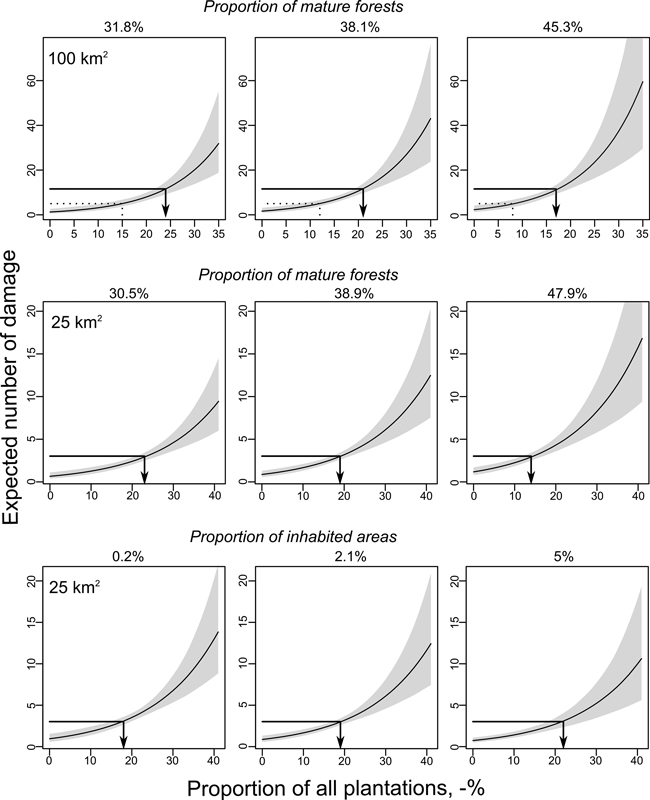
Fig. 3. Predicted number of moose damage per 100 km2 and 25 km2 landscape sizes in Ostrobothnia. Predictions were calculated for different proportions of plantations using quartiles of Q1 (left column), Q2 (middle column) and Q3 (right column) for the proportion of mature forests and inhabited areas while keeping all other possible covariates at their means. However, due to the highly skewed distribution 95% was used for inhabited areas as the highest value. Arrow lines show the average number of damaged plantations in Ostrobothnia during years 2002–2008 (Y-axis) and the change in moose damage risk per plantation area (X-axis) as a function of different levels of co-variates. Grey area shows 95% confidence limits.
| Table 4. Coefficients, standard error of mean, Z-test value, and significance of the best combination of model variables explaining the amount of moose damage (count model) and the occurrence of non-damage landscape (zero model) in Lapland for 1 km2, 25 km2 and 100 km2 landscape sizes. See Tables 1a,b for variable descriptions. | ||||||||||
| Landscape size | Count model | Coeff | Std. Error | Z | Pr(>|z|) | Zero model | Coeff | Std. Error | Z | Pr(>|z|) |
| 1 km2 | Intercept | –2.2366 | 0.2040 | –10.96 | <0.0001 | Intercept | 5.0515 | 0.3698 | 13.657 | <0.0001 |
| PINEPLAMIN | 0.0162 | 0.0047 | 3.4 | 0.0006 | OPENMIN | –0.0834 | 0.0237 | –3.508 | 0.0004 | |
| OTHERPLANT | 0.0305 | 0.0055 | 5.482 | <0.0001 | OTHERPLANT | –0.0572 | 0.0101 | –5.64 | <0.0001 | |
| THINNSUM | 0.0090 | 0.0048 | 1.861 | 0.0627 | MATURE | –0.0347 | 0.0058 | –5.924 | <0.0001 | |
| CONNROAD | –0.3729 | 0.1089 | –3.424 | 0.0006 | THINNSUM | –0.0233 | 0.0083 | –2.798 | 0.0051 | |
| NNDAMAGE | 0.9644 | 0.1189 | 8.106 | <0.0001 | NNDAMAGE | –20.0562 | 1.9089 | –10.507 | <0.0001 | |
| Log(theta) | –1.1670 | 0.0861 | –13.554 | <0.0001 | ||||||
| 25 km2 | Intercept | –1.4960 | 0.5314 | –2.815 | 0.0048 | Intercept | 2.7071 | 0.3673 | 7.37 | <0.0001 |
| PLANTSUM | 0.0435 | 0.0096 | 4.515 | <0.0001 | PINEPLAMIN | –0.0478 | 0.0209 | –2.289 | 0.0221 | |
| CONNROAD | –0.0323 | 0.0149 | –2.172 | 0.0298 | OTHERTHI | –0.0883 | 0.0211 | –4.173 | <0.0001 | |
| PINETHIMIN | –0.0255 | 0.0123 | –2.068 | 0.0386 | NNDAMAGE | –1.2680 | 0.2660 | –4.766 | <0.0001 | |
| MATURE | 0.0418 | 0.0103 | 4.038 | <0.0001 | ||||||
| NNDAMAGE | 0.2226 | 0.0314 | 7.081 | <0.0001 | ||||||
| Log(theta) | –0.157 | 0.1588 | –0.988 | 0.3230 | ||||||
| 100 km2 | Intercept | –2.1043 | 0.8740 | –2.408 | 0.0160 | Intercept | 5.29983 | 1.5867 | 3.34 | 0.0008 |
| PLANTSUM | 0.06123 | 0.0169 | 3.609 | 0.0003 | PLANTSUM | –0.09539 | 0.0352 | –2.704 | 0.0068 | |
| MATURE | 0.06606 | 0.0172 | 3.831 | 0.00018 | FORROAD | –0.04346 | 0.0224 | –1.934 | 0.0531 | |
| NNDAMAGE | 0.09991 | 0.0181 | 5.495 | <0.0001 | NNDAMAGE | –0.74811 | 0.1965 | –3.806 | 0.0001 | |
| Log(theta) | 0.00511 | 0.1732 | 0.03 | 0.9764 | ||||||
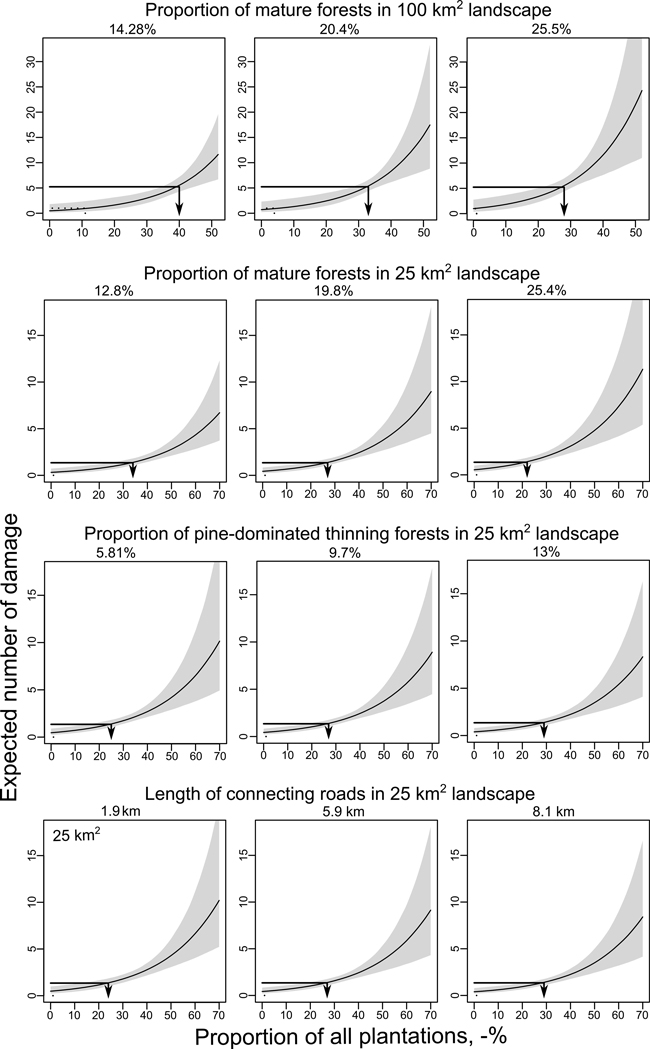
Fig. 4. Predicted number of moose damage per 100 km2 and 25 km2 landscape sizes in Lapland. Predictions were calculated for different proportions of plantations using quartiles of Q1 (left column), Q2 (middle column) and Q3 (right column) for the proportions of mature forests and thinning forests and for the length of connecting roads while keeping all other possible covariates at their means. Arrow lines show the average number of damaged plantations in Lapland during years 2002–2008 (Y-axis) and the change in moose damage risk per plantation area (X-axis) as a function of different levels of co-variates. Grey area shows 95% confidence limits.