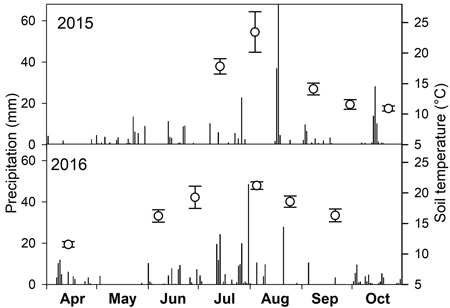
Fig. 1. Daily sum of precipitation (bars) over two growing seasons and mean soil temperature (open circles) with standard deviation on dates of soil CO2 efflux measurements.
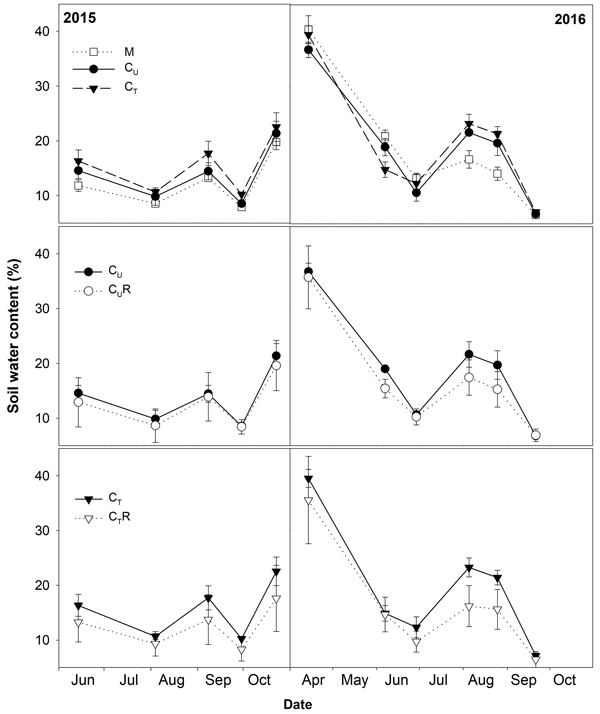
Fig. 2. Mean soil water content (±SD) in the studied plots: M-mature stand, CU-unthinned coppice stand, CT-thinned coppice stand, CUR-coppice stand with reduced throughfall, and CTR-thinned coppice stand with reduced throughfall.
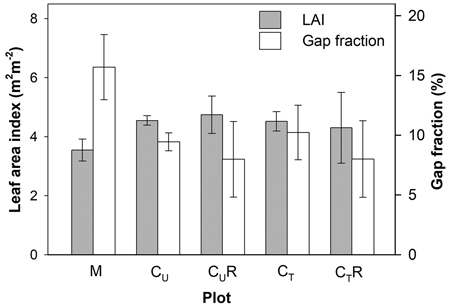
Fig. 3. Mean gap fraction and leaf area index above soil CO2 efflux measurement positions in the individual plots: M-mature stand, CU-coppice stand, CT-thinned coppice stand, CUR-coppice stand with reduced throughfall, and CTR-thinned coppice stand with reduced throughfall. For calculation of mean LAI in CUR and CTR positions shaded by the drainage channels were excluded, while for calculation of mean gap fraction all positions were included.
| Table 1. Q10 values and the parameters the coefficient of determination (R2) of the sigmoid fit of the relationships between soil CO2 efflux normalised for temperature of 10 °C (R10) and soil water content (SWC) from Fig. 5 [R10 = a/(1+exp(–(SWC–x0)/b))] for individual plots: M-mature stand, CU-coppice stand, CT-thinned coppice stand, CUR-coppice stand with reduced throughfall, and CTR-thinned coppice stand with reduced throughfall. | |||||
| M | CU | CT | CUR | CTR | |
| Q10 | 1.85 | 2.27 | 2.29 | 2.56 | 2.43 |
| a | 2.53 | 2.39 | 2.42 | 1.99 | 1.98 |
| b | 1.68 | 1.64 | 2.38 | 2.68 | 4.17 |
| x0 | 7.18 | 6.85 | 6.39 | 6.81 | 5.74 |
| R2 | 0.68 | 0.79 | 0.84 | 0.91 | 0.82 |
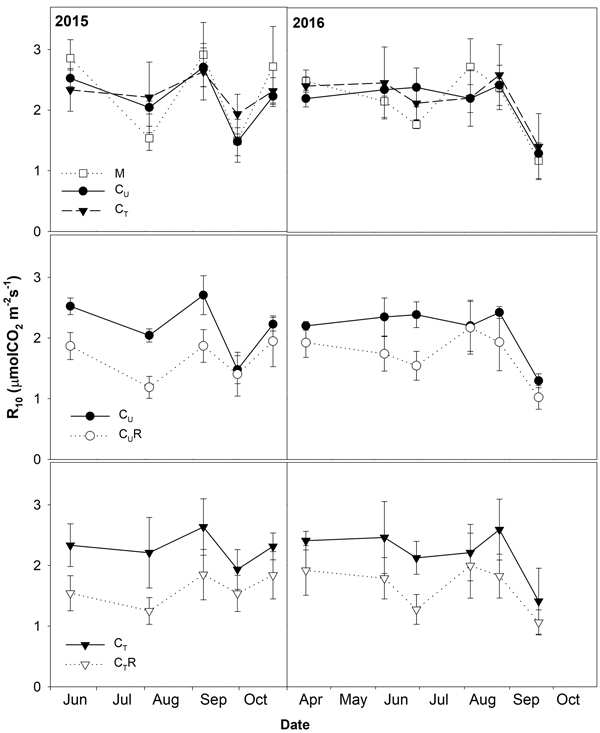
Fig. 4. Mean soil CO2 efflux normalised for temperature of 10 °C (R10; ±SD) in the studied plots: M-mature stand, CU-coppice stand, CT-thinned coppice stand, CUR-coppice stand with reduced throughfall, and CTR-thinned coppice stand with reduced throughfall.
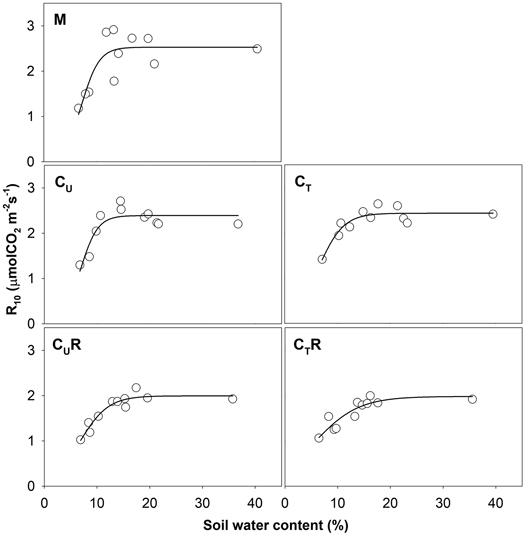
Fig. 5. Relationship between soil water content and R10 in individual plots: M-mature stand, CU-coppice stand, CT-thinned coppice stand, CUR-coppice stand with reduced throughfall, and CTR-thinned coppice stand with reduced throughfall.
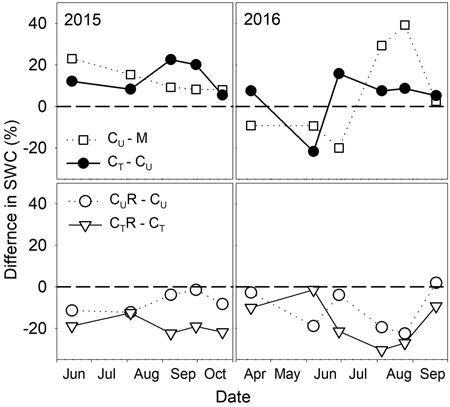
Fig. 6. Percentage differences in soil water content (SWC) between selected plots: M-mature stand, CU-coppice stand, CT-thinned coppice stand, CUR-coppice stand with reduced throughfall, and CTR-thinned coppice stand with reduced throughfall.
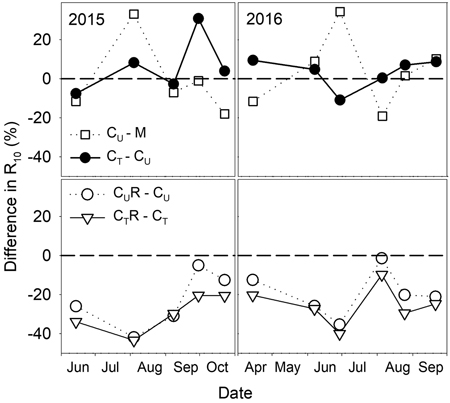
Fig. 7. Percentage differences in R10 (soil CO2 efflux normalised for temperature of 10 °C) between selected plots: M-mature stand, CU-coppice stand, CT-thinned coppice stand, CUR-coppice stand with reduced throughfall, and CTR-thinned coppice stand with reduced throughfall.
| Table 2. Results of statistical analyses (p-values of t-tests) comparing soil water content (SWC) and R10 between plots on individual dates: M-mature stand, CU-coppice stand, CT-thinned coppice stand, CUR-coppice stand with reduced throughfall, and CTR-thinned coppice stand with reduced throughfall. Asterisks indicate significant difference in the level α = 0.05. | ||||||||||||
| 2015 | 2016 | |||||||||||
| 14 Jul | 4 Aug | 8 Sep | 30 Sep | 23 Oct | 14 Apr | 7 Jun | 29 Jun | 5 Aug | 25 Aug | 21 Sep | ||
| SWC | M × CU | 0.056 | 0.247 | 0.276 | 0.216 | 0.353 | 0.095 | 0.050 | 0.004* | 0.039* | 0.028* | 0.586 |
| CU × CT | 0.282 | 0.444 | 0.104 | 0.005* | 0.583 | 0.102 | 0.009* | 0.203 | 0.388 | 0.369 | 0.363 | |
| CU × CUR | 0.243 | 0.273 | 0.610 | 0.883 | 0.578 | 0.778 | 0.024* | 0.650 | 0.139 | 0.138 | 0.861 | |
| CT × CTR | 0.096 | 0.048* | 0.096 | 0.184 | 0.265 | 0.447 | 0.920 | 0.167 | 0.041* | 0.061 | 0.497 | |
| R10 | M × CU | 0.161 | 0.017* | 0.595 | 0.953 | 0.273 | 0.065 | 0.462 | 0.009* | 0.223 | 0.879 | 0.547 |
| CU × CT | 0.429 | 0.650 | 0.833 | 0.120 | 0.575 | 0.102 | 0.787 | 0.258 | 0.982 | 0.598 | 0.743 | |
| CU × CUR | 0.012* | 0.002* | 0.026* | 0.776 | 0.325 | 0.134 | 0.068 | 0.010* | 0.933 | 0.152 | 0.106 | |
| CT × CTR | 0.040* | 0.046* | 0.095 | 0.197 | 0.139 | 0.125 | 0.164 | 0.016* | 0.626 | 0.099 | 0.357 | |
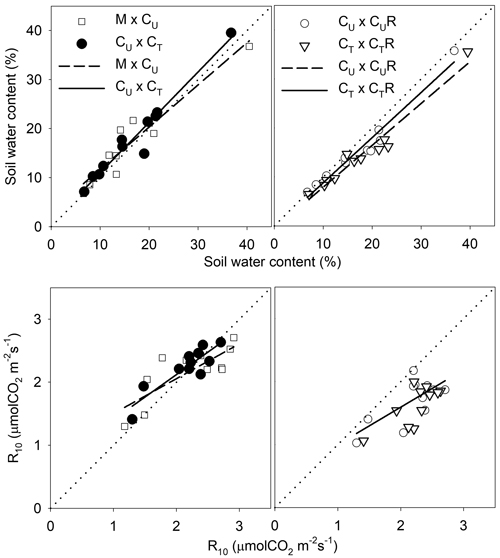
Fig. 8. Linear regressions describing the relationship of soil water content (SWC) and soil CO2 efflux normalised for temperature of 10 °C (R10) between selected pairs of the plots: M-mature stand, CU-coppice stand, CT-thinned coppice stand, CUR-coppice stand with reduced throughfall, and CTR-thinned coppice stand with reduced throughfall.
| Table 3. Statistics of the linear regressions from Fig. 8 describing the relationship of soil water content (SWC, %) and R10 (μmolCO2 m–2 s–1) between selected pairs of the plots: M-mature stand, CU-coppice stand, CT-thinned coppice stand, CUR-coppice stand with reduced throughfall, and CTR-thinned coppice stand with reduced throughfall. y0 and a are the parameters of the linear regression (y = y0 + a*x); F and p are the parameters of the F-test of the regressions, statistically significant regression corresponds to p < 0.05. | ||||||
| y0 | a | R2 | F | p | ||
| SWC | M × CU | 3.09 | 0.86 | 0.9 | 87.4 | <0.0001 |
| CU × CT | 0.68 | 1.02 | 0.95 | 188 | <0.0001 | |
| CU × CUR | –0.41 | 0.92 | 0.9648 | 246.4 | <0.0001 | |
| CT × CTR | –0.63 | 0.85 | 0.9519 | 178.1 | <0.0001 | |
| R10 | M × CU | 0.95 | 0.55 | 0.63 | 15.6 | 0.0034 |
| CU × CT | 0.69 | 0.71 | 0.79 | 34.1 | 0.0002 | |
| CU × CUR | 0.41 | 0.59 | 0.50 | 9.0 | 0.0150 | |
| CT × CTR | 0.41 | 0.59 | 0.50 | 9.0 | 0.0148 | |