| Table 1. The number of suitable planting spots (good and acceptable after additional compression) and the main characteristics on the 50 m2 sample plots in the modelling data (i.e., the sample plots with mineral soil, N = 656). |
| Variable | Mean | Std dev. | Range |
| Planting spots per 50 m2 | 7.0 | 2.8 | 0–17 |
| Thickness of humus, cm | 6.5 | 2.4 | 2–20 |
| | N | % |
| Logging residues | Removed | 400 | 61 |
| Fresh | 83 | 13 |
| Dry | 173 | 26 |
| Site fertility a | Rich | 64 | 10 |
| Medium | 568 | 87 |
| Sub-dry | 24 | 4 |
| Soil texture | Coarse | 8 | 1 |
| Medium | 474 | 72 |
| Fine | 174 | 27 |
| Stoniness | Stoneless | 193 | 29 |
| Stony | 389 | 59 |
| Very stony | 74 | 11 |
| Terrain | Sloping | 150 | 23 |
| Flat | 480 | 73 |
| Valley | 26 | 4 |
| Wetness b | Not affect | 604 | 92 |
| Affect | 51 | 8 |
| Table 2. Linear mixed model (Eq. 1) for the number of suitable planting spots (i.e., good and acceptable after additional compression) on the 50 m2 sample plot. F-values are calculated to test the significance of the categorical variables in the model. The fitting statistics using both fixed and random effects are given in parentheses. The modelling data consist of 656 sample plots with mineral soil. |
| Variable | Estimate | Std err. | t-value | p |
| Intercept | 5.741 | 0.941 | 6.10 | <0.001 |
| Slash conditions (ref. Dry) | | | F = 3.16 | 0.056 |
| Fresh | –0.956 | 0.543 | –1.76 | 0.085 |
| Removed | 0.339 | 0.438 | 0.78 | 0.451 |
| Thickness of humus, cm | –0.148 | 0.052 | –2.84 | 0.005 |
| Soil texture (ref. Fine) | | | F = 3.17 | 0.043 |
| Medium | –0.626 | 0.294 | –2.13 | 0.034 |
| Coarse | 0.979 | 0.983 | 1.00 | 0.320 |
| Stoniness (ref. Very stony) | | | F = 4.68 | 0.010 |
| Stony | 0.444 | 0.339 | 1.31 | 0.191 |
| Stoneless | 1.025 | 0.370 | 2.77 | 0.006 |
| Terrain (ref. Valley) | | | F = 11.74 | <0.001 |
| Sloping | 1.467 | 0.573 | 2.56 | 0.011 |
| Flat | 2.233 | 0.551 | 4.05 | <0.001 |
| Random effect | Variance | | | |
| Operator (N = 4) | 0.010 | | | |
| Forest estate (N = 29) | 1.179 | | | |
| Regeneration area (N = 66) | 0.317 | | | |
| Sample plot (N = 656) | 5.502 | | | |
| Fitting statistics | | | | |
| R2, % | 13.6 (34.4) | | | |
| Bias, spots per 50 m2 | 0.06 (0.00) | | | |
| Bias%, % | 0.8 (0.0) | | | |
| RMSE, spots per 50 m2 | 2.60 (2.27) | | | |
| RMSE%, % | 37.4 (32.3) | | | |
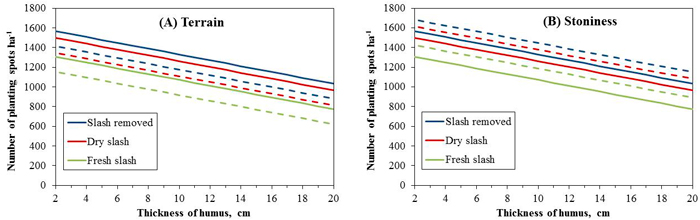
Fig. 1. Predicted number of suitable planting spots ha–1 (i.e., good and acceptable for planting after additional compression) as a function of thickness of humus layer, if logging residues are removed, dry or fresh. Other predictors: A – flat (solid lines) or sloping (broken lines) terrain, medium soil texture and stony soil; B – stony (solid lines) or stoneless (broken lines) soil, flat terrain and medium soil texture.
| Table 3. Logistic mixed model (Eq. 2) for the probability of successful mounding, i.e. the number of suitable planting spots on the 50 m2 sample plot is at least eight (1600 spots ha–1). F-values are calculated to test the significance of the categorical variables in the model. The modelling data consist of 656 sample plots with mineral soil. |
| Variable | Estimate | Std err. | t-value | p | Exp(Est.) |
| Intercept | 0.140 | 1.020 | 0.14 | 0.891 | 1.150 |
| Slash conditions (ref. Dry) | | | F = 5.22 | 0.006 | |
| Fresh | –1.255 | 0.548 | –2.29 | 0.022 | 0.285 |
| Removed | 0.326 | 0.433 | 0.75 | 0.453 | 1.385 |
| Thickness of humus, cm | –0.160 | 0.055 | –2.89 | 0.004 | 0.852 |
| Soil texture (ref. Fine) | | | F = 1.55 | 0.213 | |
| Medium | –0.185 | 0.289 | –0.64 | 0.523 | 0.831 |
| Coarse | 2.066 | 1.323 | 1.56 | 0.119 | 7.894 |
| Stoniness (ref. Very stony) | | | F = 1.55 | 0.214 | |
| Stony | 0.158 | 0.328 | 0.48 | 0.630 | 1.171 |
| Stoneless | 0.523 | 0.359 | 1.46 | 0.146 | 1.687 |
| Terrain (ref. Valley) | | | F = 6.71 | 0.001 | |
| Sloping | –0.007 | 0.640 | –0.01 | 0.991 | 0.993 |
| Flat | 0.824 | 0.618 | 1.33 | 0.183 | 2.280 |
| Random effect | Variance | | | | |
| Operator (N = 4) | 0.466 | | | | |
| Forest estate (N = 29) | 0.443 | | | | |
| Regeneration area (N = 66) | 0.235 | | | | |
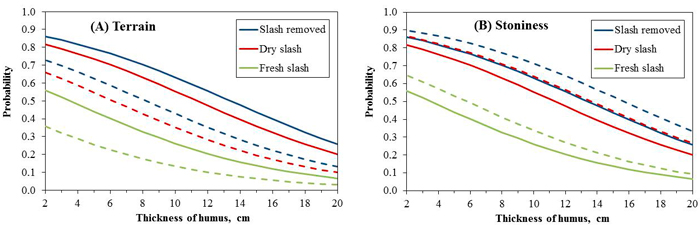
Fig. 2. Predicted probability of successful mounding (i.e., ≥1600 suitable planting spots ha–1) as a function of thickness of humus layer, if logging residues are removed, dry or fresh. Other predictors: A – flat (solid lines) or sloping (broken lines) terrain, medium soil texture and stony soil; B – stony (solid lines) or stoneless (broken lines) soil, flat terrain and medium soil texture.
| Table 4. Accuracy of the classification of the 50 m2 sample plots as successfully mounded, i.e. the number of suitable planting spots per plot is at least eight (1600 spots ha–1). The predicted categories have been calculated using the fixed part of the model (Eq. 2); the classification using both fixed and random effects are given in parentheses. |
| Observed | Predicted | Total | Accuracy |
| Success | Failure |
| Success | 218 (218) | 81 (81) | 299 | 73% (73%) |
| Failure | 173 (49) | 184 (308) | 357 | 52% (86%) |
| Total | 391 (286) | 265 (389) | 656 | 61% (80%) |
| Table 5. Logistic mixed model (Eq. 2) for the probability that the quality of mound was good or acceptable for planting after additional compression. F-values are calculated to test the significance of the categorical variables in the model. The modelling data consist of 6217 mounds on 656 sample plots with mineral soil. |
| Variable | Estimate | Std err. | t-value | p | Exp(Est.) |
| Intercept | 1.263 | 0.435 | 2.91 | 0.004 | 3.536 |
| Slash conditions (ref. Dry) | | | F = 2.57 | 0.076 | |
| Fresh | –0.385 | 0.213 | –1.81 | 0.070 | 0.680 |
| Removed | 0.035 | 0.208 | 0.17 | 0.866 | 1.036 |
| Thickness of humus, cm | –0.055 | 0.020 | –2.78 | 0.005 | 0.946 |
| Soil texture (ref. Fine) | | | F = 2.05 | 0.129 | |
| Medium | –0.227 | 0.120 | –1.88 | 0.060 | 0.797 |
| Coarse | 0.160 | 0.388 | 0.41 | 0.681 | 1.174 |
| Stoniness (ref. Very stony) | | | F = 1.96 | 0.141 | |
| Stony | 0.029 | 0.133 | 0.22 | 0.829 | 1.029 |
| Stoneless | 0.203 | 0.144 | 1.41 | 0.159 | 1.225 |
| Terrain (ref. Valley) | | | F = 4.68 | 0.009 | |
| Sloping | 0.394 | 0.215 | 1.83 | 0.067 | 1.483 |
| Flat | 0.560 | 0.207 | 2.71 | 0.007 | 1.751 |
| Random effect | Variance | | | | |
| Operator (N = 4) | 0.239 | | | | |
| Forest estate (N = 29) | 0.225 | | | | |
| Regeneration area (N = 66) | 0.034 | | | | |
| Sample plot (N = 656) | 0.191 | | | | |
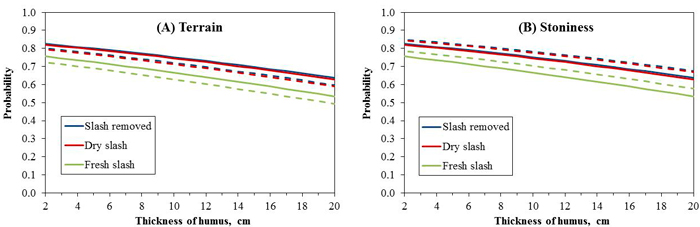
Fig. 3. Predicted probability of suitable mound as a function of thickness of humus layer, if logging residues are removed, dry or fresh. Other predictors: A – flat (solid lines) or sloping (broken lines) terrain, medium soil texture and stony soil; B – stony (solid lines) or stoneless (broken lines) soil, flat terrain and medium soil texture. Note that the lines for Slash removed and Dry slash are overlapping.
| Table 6. Accuracy of the classification of the mounds as unsuitable or suitable (i.e., good or acceptable after additional compression) for planting. The predicted categories have been calculated using the fixed part of the model; the classification using both fixed and random effects are given in parentheses. |
| Observed | Predicted quality of mound | Total | Accuracy |
| Unsuitable | Suitable |
| Unsuitable | 313 (1155) | 1302 (460) | 1615 | 19% (72%) |
| Suitable | 452 (1703) | 4150 (2899) | 4602 | 90% (63%) |
| Total | 765 (2858) | 5452 (3359) | 6217 | 72% (65%) |