| Table 1. The hybrid aspen clones included in the study, the location of the stand they were selected from and the origin of their parents, as accurately as could be recovered from the old documents. | |||||||
| Clone | Location of selection | Latitude | Longitude | Mother species | Origin of the mother | Father species | Origin of the father |
| 7 | Vihti | 60°20´ | 24°26´ | Populus tremula | Tuusula, Finland | Populus tremuloides | Aleza Lake, Cariboo, BC, Canada |
| 14 | Lapinjärvi | 60°37´ | 26°11´ | Populus tremula | Toivakka, Finland | Populus tremuloides | Maple, Ontario, Canada |
| 20 | Nurmijärvi | 60°30´ | 24°42´ | Populus tremuloides | Aleza Lake, Cariboo, BC, Canada | Populus tremula | Finland |
| 21 | Vihti | 60°20´ | 24°26´ | Populus tremula | Helsinki, Finland | Populus tremuloides | Galt, Ontario, Canada |
| 24 | Vaajakoski | 62°15´ | 25°54´ | Populus tremula | Tuusula, Finland | Populus tremuloides | Maple, Ontario, Canada |
| 26 | Vaajakoski | 62°15´ | 25°54´ | Populus tremuloides | Gothenburg botanical garden, Sweden | Populus tremula | Tuusula, Finland |
| 27 | Loppi | 60°37´ | 24°27´ | Populus tremula | Punkaharju, Finland | Populus tremuloides | Canada |
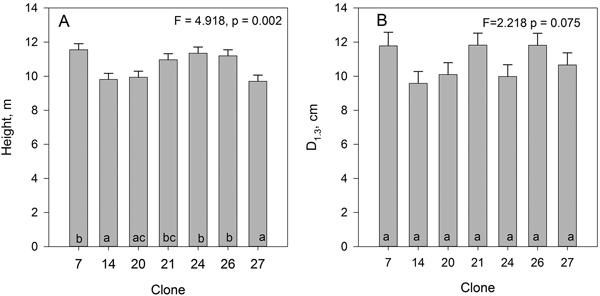
Fig. 1. Mean height (A) and DBH (B) of the studied hybrid aspen clones. Bars indicate standard error. Clones marked with the same letters do not differ from each other at the 0.05 significance level.
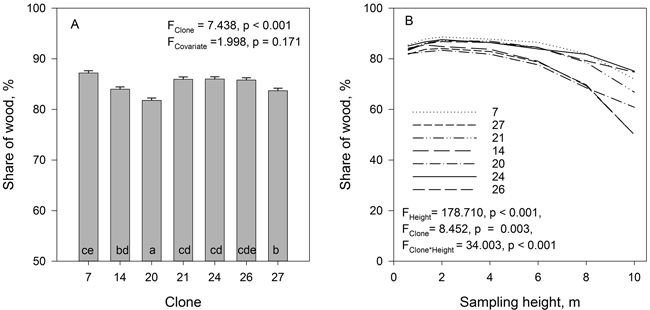
Fig. 2. The mean wood fraction of the total stem biomass (A) and the wood fractions of stem biomass at different sample heights (B) in the studied hybrid aspen clones. Tree height was used as covariate. Clones marked with the same letters do not differ from each other at the 0.05 significance level.
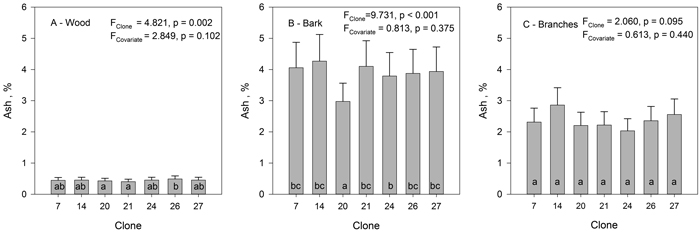
Fig. 3. The mean ash content of wood (A), bark (B) and branches (C) in hybrid aspen clones. Lines inside bars indicate standard error. Tree height was used as a covariate. Clones marked with the same letters do not differ from each other at the 0.05 significance level. View larger in new window/tab.
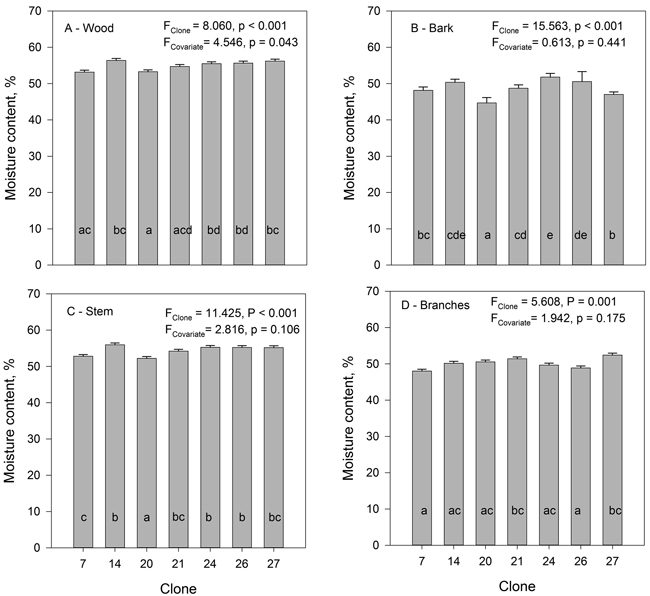
Fig.4. The mean moisture content of wood (A), bark (B), stem (wood and bark) (C) and branches (D) of the studied hybrid aspen clones. Tree height was used as covariate. Clones marked with the same letters do not differ from each other at the 0.05 significance level.
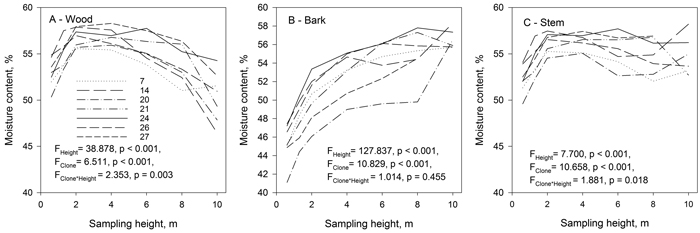
Fig. 5. The mean moisture content of wood (A), bark (B), and stem (wood and bark) (C) of the studied hybrid aspen clones at different sampling heights. View larger in new window/tab.
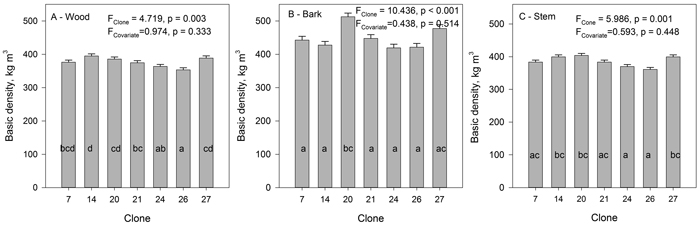
Fig. 6. The mean basic density of wood (A), bark (B) and stem (wood and bark) (C) of the studied hybrid aspen clones. Standard error of the mean. Tree height was used as covariate. Clones marked with the same letters do not differ from each other at the 0.05 significance level. View larger in new window/tab.
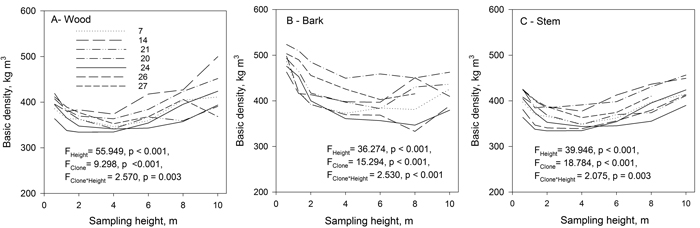
Fig. 7. Mean basic density of wood (A), bark (B), and stem (wood and bark) (C) of the studied hybrid aspen clones at different sampling heights. View larger in new window/tab.
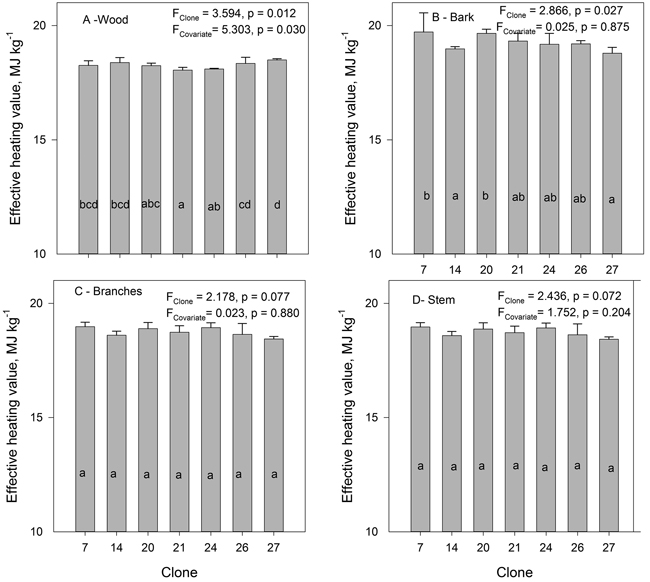
Fig. 8. The mean effective heating value of oven dry biomass of wood (A), bark (B), branches (C) and stem (wood and bark) (D) of hybrid aspen clones. Tree height was used as covariate.