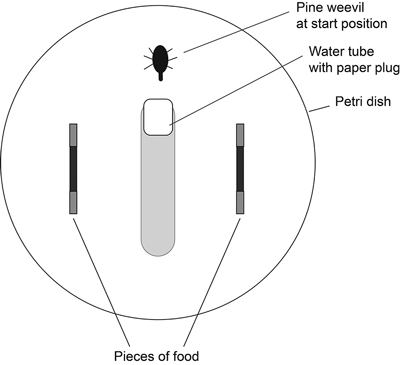
Fig. 1. Set-up of choice experiment. Two pieces of food of the same tree species (branch-seedling or root-seedling) were placed in each Petri dish. The ends of the food pieces were wrapped in aluminium foil. A water tube and one pine weevil were placed in the middle without being pointed at either piece.
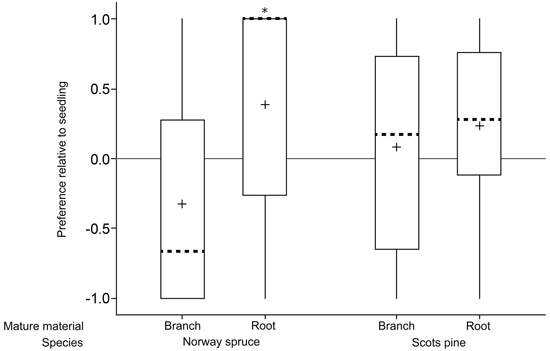
Fig. 2. Relative preferences for mature food sources (branch and root) compared to seedlings of the same species in a choice feeding test with individual pine weevils (+1 = preference for mature food source; 0 = no preference; –1 = preference for seedlings). Boxes include data from second and third percentiles with whiskers extending to the maximum/minimum data point within 1.5 box heights from the top/bottom of the box. Median line (dashed) and mean symbols (+) are shown. (* p < 0.05).
| Table 1. Amounts (mm3) of bark (phloem) consumed from mature food sources (branch and root) compared to seedlings of the same species presented to individual pine weevils in a 24 h choice feeding test. | |||||
| Species | Seedling compared with | N | Amount eaten mean ± SD (mm3) | Total amount eaten per tree species (mm3) | |
| Mature | Seedling | ||||
| Norway spruce | Branch | 28 | 5.79 ± 1.42 | 16.26 ± 3.08 | 1323 |
| Norway spruce | Root | 29 | 14.35 ± 2.17 | 9.99 ± 3.33 | |
| Scots pine | Branch | 25 | 14.09 ± 2.47 | 9.51 ± 1.63 | 1666 |
| Scots pine | Root | 29 | 24.73 ± 3.54 | 12.38 ± 2.28 | |
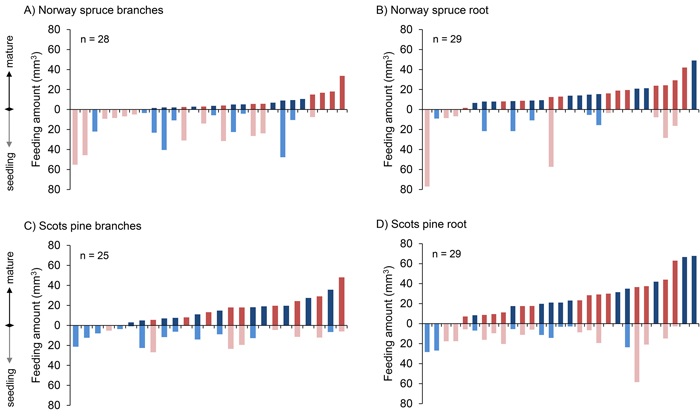
Fig. 3. Amount of bark (mm3) consumed by individual pine weevils in all four comparisons, ordered with respect to the increasing amounts of mature food (branch and root) consumed. Each bar represents an individual pine weevil (red: female, blue: male). View larger in new window/tab.