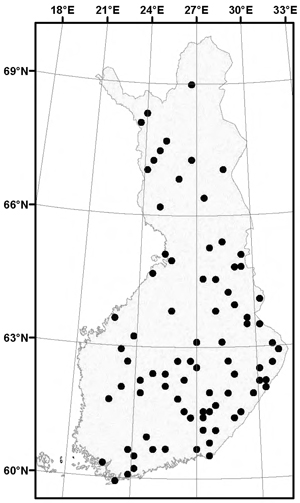
Fig. 1. Locations of the study plots with all available measured data (n = 82; map projection: Gauss_Kruger; Finland_Zone_3, central meridian: 27.0).
| Table 1. Descriptive statistics of the main used variables. Soil characteristics are averaged (mean of soil layers). | |||||
| Variable | Min | Max | Mean | Median | Standard deviation |
| Altitude (m a.s.l.) | 10 | 290 | 134.63 | 120 | 67.24 |
| Average temperature sum (d.d., at 2 m, threshold 5 oC) | 807 | 1746 | 1383.91 | 1425.5 | 235.91 |
| Slope (degree) | 0 | 26 | 4.89 | 4 | 5.67 |
| Thickness of humus layer (cm) | 0.35 | 10.4 | 4.5 | 4.2 | 2.22 |
| Proportion of clay (<0.002 mm, %) | 0.4 | 31.78 | 3.21 | 2.3 | 4.41 |
| Proportion of silt (0.002–0.063 mm, %) | 2.5 | 74.6 | 29.53 | 28.82 | 16.41 |
| Proportion of sand (0.063–2 mm, %) | 7.47 | 97.17 | 67.26 | 69.08 | 19.18 |
| Proportion of gravel (>2 mm, %) | 0.04 | 32.34 | 8.52 | 7.04 | 6.72 |
| Fine fraction (<0.063 mm, %) | 2.90 | 92.57 | 32.74 | 30.98 | 19.18 |
| Bulk density (g cm–3) | 0.97 | 1.77 | 1.32 | 1.32 | 0.15 |
| Organic matter (%) | 0.42 | 10.85 | 2.67 | 2.37 | 1.89 |
| Topsoil pH (0–6 cm)* | 3.60 | 5.30 | 4.12 | 4.00 | 0.31 |
| Total porosity (=WC0, vol.%) | 32.85 | 64.00 | 49.8 | 49.7 | 5.6 |
| Water retention at –1 kPa (WC1, vol.%) | 8.09 | 51.20 | 36.78 | 38.47 | 7.43 |
| WR at –10 kPa (WC10, vol.%) | 3.93 | 40.80 | 22.12 | 22.46 | 9.67 |
| WR at –100 kPa (WC100, vol.%) | 0.67 | 33.28 | 13.18 | 12.71 | 7.02 |
| WR at –1500 kPa (WC1500, vol.%) | 0.55 | 16.06 | 6.67 | 6.40 | 4.13 |
| Air-filled porosity at –1 kPa (AFP1, vol.%) | 1.68 | 35.81 | 13.26 | 12.76 | 6.2 |
| Air-filled porosity at –10 kPa (AFP10, vol.%) | 2.57 | 40.93 | 27.86 | 29.29 | 9.27 |
| Age of forest stand (years) | 0 | 248 | 73.16 | 72.00 | 47.19 |
| Height of dominant trees at age of 100 years (H100) | 8.68 | 38.08 | 22.17 | 23.16 | 6.42 |
| Basal area of tree trunks (m2) | 0 | 33.37 | 17.93 | 19.20 | 9.33 |
| Volume of growing stock (m3 ha–1) | 0 | 366.35 | 148.83 | 142.34 | 98.39 |
| Proportion of Scots pine (%) | 0 | 100 | 52.87 | 55.02 | 41.27 |
| Proportion of Norway spruce (%) | 0 | 99.84 | 30.37 | 8.43 | 36.37 |
| Proportion of deciduous trees (%) | 0 | 100 | 14.58 | 3.47 | 25.3 |
| Canopy cover of trees (%) | 0 | 96 | 47.74 | 50 | 24.04 |
| Canopy cover of bushes (%) | 0 | 88 | 8.48 | 3 | 15.99 |
| Cover of seedlings or saplings (%) | 0 | 13.78 | 1.27 | 0.33 | 2.28 |
| Cover of scrubs indicating sub-xeric sites (%)1 | 0 | 71.25 | 11.50 | 7.25 | 13.23 |
| Cover of bottom layer vegetation indicating xeric sites (%)2 | 0 | 42.95 | 5.85 | 1.30 | 9.95 |
| Cover of mosses and scrubs indicating mesic sites (%)3 | 0 | 70.75 | 18.99 | 11.05 | 19.76 |
| Cover of vascular species indicating herb rich sites (%)4 | 0 | 87.12 | 9.50 | 5.00 | 15.09 |
| Cover of hay species (%) | 0 | 52.3 | 5.62 | 1.26 | 10.25 |
| Cover of grass species (%) | 0 | 68.21 | 6.56 | 0.97 | 12.99 |
| Cover of mosses (%) | 0.22 | 154.25 | 59.26 | 63.81 | 34.22 |
| Cover of lichens (%) | 0 | 51.62 | 3.32 | 0.02 | 8.38 |
| Cover of Sphagnum species (%) | 0 | 49.37 | 2.11 | 0 | 6.99 |
| Cover of Salix species (%) | 0 | 1 | 0.03 | 0 | 0.14 |
| Cover of Rhododendron tomentosum (%) | 0 | 2 | 0.09 | 0 | 0.35 |
| Cover of Polytrichum commune (%) | 0 | 16.5 | 1.16 | 0 | 3.31 |
| * pH values are calculated from H+ concentrations. Site types (n): herb-rich (19), mesic (30), sub-xeric (27), xeric and barren heath forests (6). Field estimated soil particle size (n): Fine <0.06 mm (18), Medium 0.06–0.6 mm (56), Coarse >0.6 mm (8). Soil layers (n for water retention): 0–6 cm (82), 30–36 cm (82). Vegetation groups indicating site quality, formed by Item Cluster Analysis (Revelle 2017): 1 sub-xeric scrubs: Vaccinium vitis-idaea L., Vaccinium uliginosum L., Empetrum nigrum L., Calluna vulgaris (L.) Hull; 2 xeric lichens: Cladina sp., Dicranum fuscescens Sm.; 3 mesic mosses and scrubs: Dicranum majus Sm., Hylocomium splendens (Hedw.) Schimp., Vaccinium myrtillus L.; 4 herb-rich vascular plants: Rubus saxatilis L., Pteridium aquilinum C.N. Page & R.R. Mill, Oxalis acetocella L., Maianthemum bifolium (L.) F. W. Schmidt, nutrient-demanding bushes. | |||||
| Table 2. Summary statistics for the selected major response variables with the three most significant (Anova F-test) explanatory variables. Site type and soil layer are categorical variables. | ||||||
| Fixed models: | ||||||
| Variable | Multiple R2 | Adjusted R2 | Residual SE | Explainer1 | Explainer2 | Explainer3 |
| H100 (model a) | 0.829 | 0.813 | 2.75 | Site type | Temperature sum | Fine fraction |
| H100 (model b) | 0.718 | 0.702 | 3.50 | Temperature sum | pH (0–6cm) | WC10 |
| (H-layer)0.5 | 0.498 | 0.479 | 0.39 | pH (0–6cm) | Xeric species* | Mesic species* |
| (Fines)0.5 (model a)** | 0.482 | 0.424 | 1.21 | Site type | Temperature sum | Slope |
| Mixed models: | ||||||
| Variable | Conditional R2 | Marginal R2 | Residual SD | Explainer1 | Explainer2 | Explainer3 |
| (Fines)0.5 (model b) | 0.834 | 0.624 | 0.732 | WC10 | Soil layer | Site type |
| Db (model a) | 0.717 | 0.450 | 0.085 | Org. | Soil layer | Soil layer:Org. |
| Db (model b) | 0.665 | 0.473 | 0.094 | (Org.)0.5 | Slope | Soil texture class |
| TP (=WC0) | 0.694 | 0.403 | 3.26 | Soil layer | Org. | Slope |
| WC1 | 0.597 | 0.477 | 4.49 | Total porosity | Fine fraction | Slope |
| WC10 | 0.806 | 0.655 | 4.21 | Fine fraction | Db | Slope |
| (WC100)0.5 | 0.796 | 0.478 | 0.46 | Fine fraction | Soil layer | Org. |
| (WC1500)0.5 | 0.597 | 0.319 | 0.61 | Db | Herb-rich species* | - |
| (AFP1)0.5 | 0.688 | 0.537 | 0.54 | Soil layer:Db | Soil layer | Soil texture class:Db |
| AFP10 | 0.853 | 0.651 | 3.55 | Fine fraction | Db | Soil layer:Db |
| Db = bulk density, Org. = organic matter (%), Fines = soil fine fraction, * the cover percentages of plant species indicating site quality (see Table 1), ** the fine fraction as a mean of layers. | ||||||
| Table 3. Estimate statistics of fixed effects models for the H100 site index, thickness of humus layer (cm) and soil fine fraction content (%) (without hydraulic explanatory variables). Estimates for categorical variables refer to the zero reference level (i.e. site types vs. reference category of herb-rich site type). | |||||||
| Variable | Effect | Estimate | SE | t-value | Pr(>|t|) | ||
| H100 | Intercept | 0.848 | 3.190 | 0.266 | 0.791 | ||
| Mesic site type | –5.960 | 1.128 | –5.282 | <0.001 | |||
| Sub-xeric site type | –4.409 | 1.279 | –3.447 | 0.001 | |||
| Xeric site type | –6.962 | 2.073 | –3.358 | 0.001 | |||
| Temperature sum | 0.017 | 0.002 | 9.786 | <0.001 | |||
| Fine fraction | 0.071 | 0.026 | 2.738 | 0.008 | |||
| Residual SE | 2.751 | Multiple R2 | 0.829 | ||||
| Df | 52 | Adj. R2 | 0.813 | ||||
| (H-layer)0.5 | Intercept | 6.455 | 0.657 | 9.826 | <0.001 | ||
| Xeric species* | –0.0193 | 0.00461 | –4.189 | <0.001 | |||
| Mesic species* | 0.00685 | 0.00251 | 2.728 | 0.00787 | |||
| pH (0–6 cm depth) | –1.0727 | 0.154 | –6.952 | <0.001 | |||
| Residual SE | 0.394 | Multiple R2 | 0.498 | ||||
| Df | 78 | Adj. R2 | 0.479 | ||||
| (Fine fraction)0.5 | Intercept | 8.628 | 1.191 | 7.245 | <0.001 | ||
| Mesic site type | –1.106 | 0.514 | –2.153 | 0.036 | |||
| Sub-xeric site type | –1.626 | 0.525 | –3.095 | 0.003 | |||
| Xeric site type | –3.203 | 0.840 | –3.036 | <0.001 | |||
| Temperature sum | –0.0075 | 0.0009 | –3.036 | 0.004 | |||
| Slope | 0.0617 | 0.0299 | 2.065 | 0.044 | |||
| H100 | 0.0676 | 0.0340 | 1.985 | 0.052 | |||
| Residual SE | 1.205 | Multiple R2 | 0.482 | ||||
| Df | 53 | Adj. R2 | 0.424 | ||||
| * Cover percentages of plant species indicating site quality (see Table 1). | |||||||
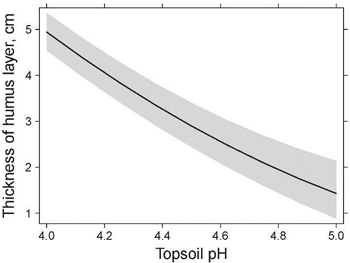
Fig. 2. Predicted relation of the thickness of the humus layer to topsoil pH (0–6 cm) (see the fixed model in Table 3). The shaded area denotes a 95% confidence interval.
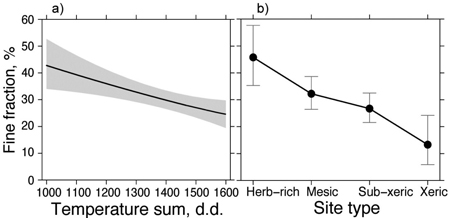
Fig. 3. Predicted relations of the soil’s fine fraction content to the temperature sum and site type (see the fixed model in Table 3). The shaded area and vertical bars denote a 95% confidence interval.
| Table 4. Estimate statistics of mixed effects models for the soil’s fine fraction content and bulk density as well as for water retention (WC10) and air-filled porosity (AFP10) at –10 kPa matric potential (SE for fixed and SD for random effects). Estimates for categorical variables refer to the zero reference level (i.e. site types vs. reference category of herb-rich site type and deeper soil layer vs. upper layer and field estimated soil particle size vs. reference category of fine sites). | ||||||
| Variable | Effect | Estimate | SE/SD | t-value | Pr(>|t|) | |
| (Fine fraction)0.5 | Intercept | 2.138 | 0.713 | 2.999 | 0.004 | |
| Mesic site type | –0.890 | 0.330 | –2.697 | 0.009 | ||
| Sub-xeric site type | –1.063 | 0.346 | –3.074 | 0.003 | ||
| Xeric site type | –1.675 | 0.538 | –3.112 | 0.003 | ||
| WC10 | 0.170 | 0.026 | 6.480 | <0.001 | ||
| Layer 30–36 cm | 1.748 | 0.607 | 2.878 | 0.006 | ||
| WC10: Layer 30–36 cm | –0.061 | 0.026 | –2–354 | 0.022 | ||
| Plot (random) | 0.826 | n = 81 | ||||
| Residual (random) | 0.712 | n = 103 | ||||
| Marginal R2 | 0.624 | |||||
| Conditional R2 | 0.834 | |||||
| Db | Intercept | 1.369 | 0.027 | 49.945 | <0.001 | |
| Layer 30–36 cm | 0.160 | 0.031 | 5.107 | <0.001 | ||
| Slope angle | –0.00899 | 0.002 | –3.897 | <0.001 | ||
| Org. matter | –0.0135 | 0.007 | –1.948 | 0.054 | ||
| Layer 30–36 cm: Org. | –0.0468 | 0.012 | –4.024 | <0.001 | ||
| Plot (random) | 0.083 | n = 81 | ||||
| Residual (random) | 0.085 | n = 105 | ||||
| Marginal R2 | 0.450 | |||||
| Conditional R2 | 0.717 | |||||
| WC10 | Intercept | 35.644 | 6.667 | 5.346 | <0.001 | |
| Layer 30–36 cm | –4.595 | 1.760 | –2.610 | 0.011 | ||
| Db | –16.253 | 4.819 | –3.373 | 0.001 | ||
| Fine fraction | 0.355 | 0.031 | 11.292 | <0.001 | ||
| Slope angle | –0.335 | 0.121 | –2.776 | 0.007 | ||
| Org. matter | –0.214 | 0.338 | –0.631 | 0.530 | ||
| Layer 30–36 cm: Org. | 1.432 | 0.613 | 2.333 | 0.022 | ||
| Plot (random) | 3.721 | n = 81 | ||||
| Residual (random) | 4.210 | n = 103 | ||||
| Marginal R2 | 0.655 | |||||
| Conditional R2 | 0.806 | |||||
| AFP10 | Intercept | 74.955 | 8.655 | 8.660 | <0.001 | |
| Layer 30–36 cm | –23.310 | 8.429 | –2.766 | 0.010 | ||
| Medium-coarse sites | 2.911 | 1.830 | 1.591 | 0.116 | ||
| Coarse sites | 5.598 | 2.735 | 2.047 | 0.044 | ||
| Db | –32.403 | 6.258 | –5.178 | <0.001 | ||
| Fine fraction | –0.261 | 0.041 | –6.337 | <0.001 | ||
| Slope angle | 0.285 | 0.121 | 2.368 | 0.020 | ||
| Layer 30–36 cm: Bulk density | 19.422 | 6.389 | 3.040 | 0.005 | ||
| Plot (random) | 4.160 | n = 78 | ||||
| Residual (random) | 3.548 | n = 98 | ||||
| Marginal R2 | 0.651 | |||||
| Conditional R2 | 0.853 | |||||
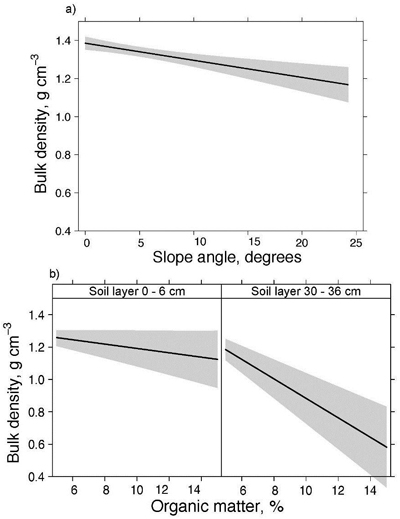
Fig. 4. Predicted relations of the soil bulk density to the terrain slope angle and soil organic matter by soil layer (see the mixed effects model in Table 3). The shaded area denotes a 95% confidence interval.
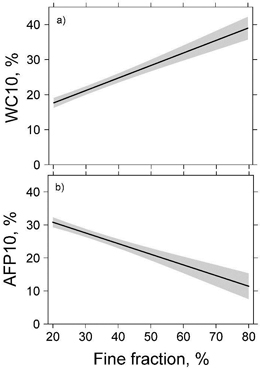
Fig. 5. Predicted relation of the water content (WC10) and air-filled porosity (AFP10) at –10 kPa matric potential to the soil’s fine fraction content (clay + silt) (see the mixed models in Table 4). The shaded area denotes a 95% confidence interval.