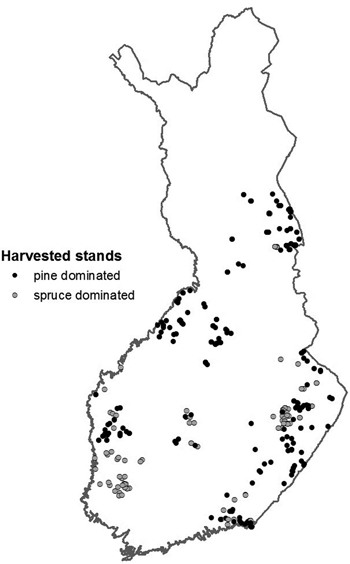
Fig. 1. Locations of Scots pine and Norway spruce dominated study stands used to construct the stem quality database.
| Table 1. List of external defects evaluated on sample trees, stored into stem quality database and used as quality indicators preventing cross cutting of saw log from the respective vertical stem section. | |
| External quality indicator | Definition |
| Surface defects | Scars or checks |
| Decay | Observed decay |
| Dry stem | Dying tree |
| Dead stem | Dead tree |
| Other form defects | Any other defect preventing the use as a saw log |
| Multiple crooks | Multiple curvature or twisting |
| Crooked stem | Sharp curvature due to individual crook |
| Sweep | Even curvature more than 1 cm of deviation per 1 m of length |
| Crown change | Broken main crown and a newly grown crown from one fork |
| Broken crown | Broken main crown |
| Forked stem | Tree with two or more forks |
| Spike knot | Large branch emerging from the trunk at an extremely sharp angle |
| Grouped branches | Distance between branches in a whorl is less than 15 cm |
| Dead knot > 40 mm | Diameter of dead knot exceeding 40 mm |
| Living knot > 50 mm | Diameter of living knot exceeding 50 mm |
| Table 2. Distributions and mean characteristics of harvesting removals of virtual stands in the stem quality database by forest site type (fertility class) based on the data from sample plot measurements. Site types: Oxalis-Myrtillus (OMT), Myrtillus (MT) and combined Vaccinium (VT) and Calluna (CT) types, or corresponding peatland types (Cajander 1926). Mean characteristics with ranges (from minimum to maximum) and standard deviations (in parenthesis) are presented for virtual stands by harvesting type. | |||
| OMT | MT | VT & CT | |
| Tree dominance, number of stands | |||
| Scots pine dominated | 12 | 22 | |
| Norway spruce dominated | 5 | 14 | 1 |
| Harvesting type, number of stands | |||
| Clear cut | 5 | 18 | 5 |
| Thinning | 8 | 17 | |
| Seed tree cutting | 1 | ||
| Number of sample trees | 903 | 6 589 | 5 076 |
| Scots pine | 273 | 3 001 | 4 822 |
| Mean per stand | 46 (3–193;74.0) | 116 (19–258;64.5) | 204 (15–361;86.8) |
| Norway spruce | 630 | 3 588 | 254 |
| Mean per stand | 105 (53–193; 69.0) | 150 (5–451;106.5) | 25 (6–78;21.5) |
| Stems including any external defect, % | 57.6 | 55.0 | 80.0 |
| Scots pine | 89.7 | 73.9 | 81.5 |
| Mean per stand | 75.9 (60.0–100.0; 15.2) | 66.9 (26.6–93.8; 19.4) | 75.6 (17.9–97.5; 22.9) |
| Norway spruce | 43.7 | 39.2 | 39.4 |
| Mean per stand | 35.5 (20.8–57.0; 13.5) | 32.5 (9.3–62.5; 14.8) | 44.6 (11.1–100; 32.5) |
| Mean stand age, a | 91 (71–125; 20.7) | 98 (29–212; 45.2) | 72 (26–139; 31.3) |
| Clear cut or seed tree cutting | 91 (71–125; 20.7) | 113 (74–212; 42.0) | 109 (89–139; 20.2) |
| Thinning | 60 (29–107; 26.3) | 59 (26–114; 23.3) | |
| Mean basal area, m2 ha–1 | 24.3 (20.2–33.6; 5.4) | 16.8 (11.3–24.4; 3.4) | 15.5 (9.8–23.1; 4.0) |
| Clear cut or seed tree cutting | 24.3 (20.2–33.6; 5.4) | 17.6 (11.9–24.4; 3.5) | 19.4 (16.6–23.1; 2.8) |
| Thinning | 15.5 (11.3–19.5; 2.7) | 14.2 (9.8–21.9; 3.5) | |
| Mean dgM, cm (basal area median tree) | 28.8 (28.0–29.8; 0.7) | 23.4 (13.1–29.8; 5.2) | 17.7 (11.8–27.7; 5.5) |
| Clear cut or seed tree cutting | 28.8 (28.0–29.8; 0.7) | 26.4 (23.6–27.7; 1.5) | 26.1 (23.5–27.7; 1.5) |
| Thinning | 16.5 (13.1–21.7; 3.3) | 14.7 (11.8–18.2; 2.4) | |
| Scots pine | 31.5 (28.6–34.8; 2.9) | 25.7 (13.1–33.9; 6.4) | 18.0 (11.8–29.3; 6.1) |
| Clear cut or seed tree cutting | 31.5 (28.6–34.8; 2.9) | 29.4 (24.3–33.9; 2.4) | 27.4 (25.8–29.3; 1.4) |
| Thinning | 17.2 (13.1–22.6; 3.7) | 14.7 (11.8–18.3; 2.3) | |
| Norway spruce | 29.7 (28.1–31.7; 1.4) | 22.8 (9.9–29.0; 5.7) | 19.3 (12.1–34.7; 7.9) |
| Clear cut or seed tree cutting | 29.7 (28.1–31.7; 1.4) | 26.0 (22.9–29.0; 1.6) | 21.8 (16.2–27.1; 4.1) |
| Thinning | 14.5 (9.9–18.1; 3.4) | 17.2 (12.1–34.7; 9.8) | |
| Table 3. Predictor and design variables used to predict external quality for reference trees in the ARVO software. If the stand belonged to the specified category, the dummy variable has the value 1, otherwise 0. | ||||||
| Variables | Pine | Spruce | ||||
| Min. | Mean | Max. | Min. | Mean | Max. | |
| Predictor variables | ||||||
| Thinning stand (dummy) | 0.000 | 0.661 | 1.000 | 0.000 | 0.026 | 1.000 |
| Seed tree cutting stand (dummy) | 0.000 | 0.018 | 1.000 | 0.000 | 0.000 | 1.000 |
| OMT fertility type (dummy) | 0.000 | 0.013 | 1.000 | 0.000 | 0.078 | 1.000 |
| MT fertility type (dummy) | 0.000 | 0.382 | 1.000 | 0.000 | 0.443 | 1.000 |
| Peatland (dummy) | 0.000 | 0.108 | 1.000 | 0.000 | 0.056 | 1.000 |
| Stand area, ha (if available) | 0.3 | 0.7 | 9.2 | 0.3 | 2.5 | 9.2 |
| Diameter at breast height dbh, cm | 5.9 | 178.3 | 52.5 | 4.2 | 21.5 | 52.5 |
| Square of dbh, cm | 3481.0 | 38 699.1 | 275 625.0 | 1764.0 | 52 566.5 | 275 625.0 |
| Tree height, m | 2.4 | 15.6 | 32.4 | 2.3 | 18.0 | 33.0 |
| Square of tree height, m | 576.0 | 25 553.0 | 104 976.0 | 529.0 | 36 267.9 | 108 900.0 |
| Latitude, degrees in KKJ coordinates | 60.48865 | 63.77689 | 66.64243 | 60.49 | 62.85 | 66.35 |
| Longitude, degrees in KKJ coordinates | 19.43323 | 27.27441 | 30.98978 | 21.34 | 26.98 | 30.58 |
| Tree age, years | 19.5 | 78.7 | 227.5 | 37 | 111 | 227.5 |
| Dominant height of stand, m | 8.3 | 16.4 | 29.3 | 13.5 | 23.8 | 30.5 |
| Species proportion in stand, % | 2.4 | 87.5 | 100 | 0.1 | 66.6 | 100 |
| Basal area of species, m2 ha–1 | 0.8 | 19.9 | 46.6 | 0.1 | 19.7 | 38.6 |
| Logarithm of basal area of species, m2 ha–1 | –0.3 | 2.7 | 3.8 | –2.3 | 2.8 | 3.6 |
| Logarithm of basal area median diameter (dgM), cm | 2.0 | 2.9 | 3.8 | 2.0 | 3.2 | 3.9 |
| Design variables | ||||||
| Lower limit of crown, m | 0.0 | 8.5 | 22.7 | 0.0 | 5.6 | 20.3 |
| Lower limit of dead branches, m | 0.0 | 2.8 | 20.8 | 0.0 | 1.5 | 20.0 |
| Length of downgraded stem section, m | 0.0 | 4.4 | 28.3 | 0.0 | 9.7 | 26.0 |
| Proportion of downgraded stem section from total tree height, % | 0.0 | 33.8 | 100.0 | 0.0 | 7.5 | 100.0 |
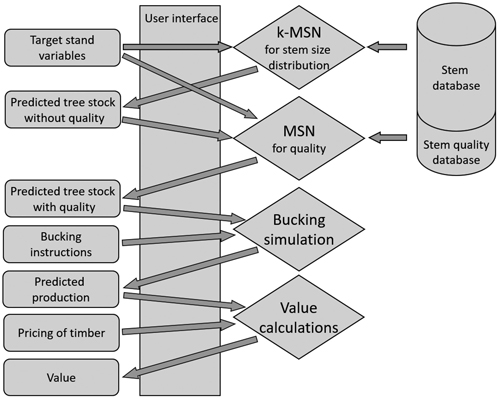
Fig. 2. Schematic illustration of the functions of the ARVO software.
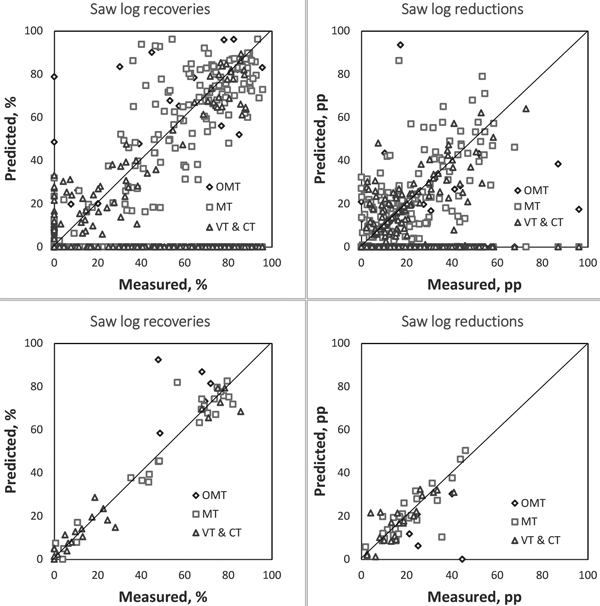
Fig. 3. Saw log recoveries (left) and saw log reductions (right) based on the measured vs. predicted stem quality in Scots pine plots (upper sub-graphs) and stands (lower sub-graphs) by site fertility types. Saw log recoveries are presented as percentages of the total timber volume (%) and saw log reductions are presented as percentage points from the defect free recovery of saw logs (pp).
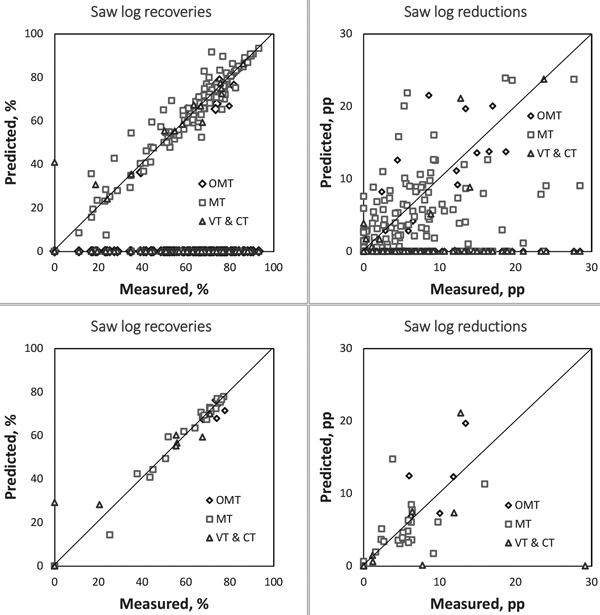
Fig. 4. Saw log recoveries (left) and saw log reductions (right) based on the measured vs. predicted stem quality in Norway spruce plots (upper sub-graphs) and stands (lower sub-graphs) by site fertility types. Saw log recoveries are presented as percentages of the total timber volume (%) and saw log reductions are presented as percentage points from the defect free recovery of saw logs (pp).
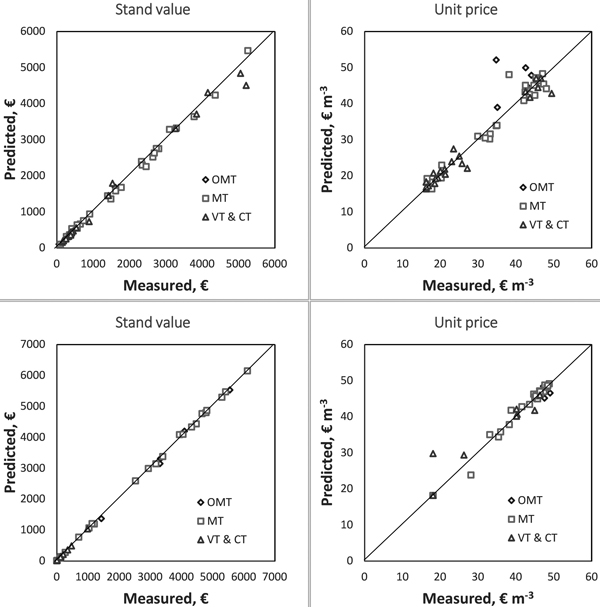
Fig. 5. Stand values (€) (left) and average unit prices (€ m–3) (right) based on the measured vs. predicted stem quality in Scots pine stands (upper sub-graphs) and Norway spruce stands (lower sub-graphs) by site fertility type.
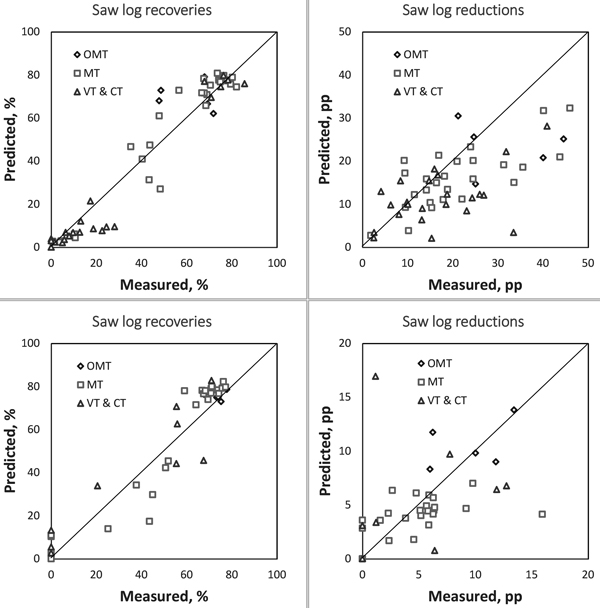
Fig. 6. Saw log recoveries (percentage of the total timber volume, %) (left) and saw log reductions (percentage points, pp) (right) based on the measured vs. predicted information of the growing stock in Scots pine stands (upper sub-graphs) and in Norway spruce stands (lower sub-graphs) by site fertility type.
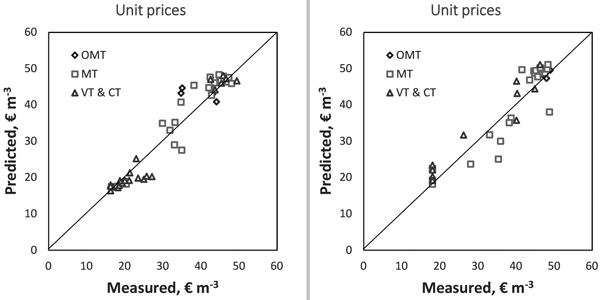
Fig. 7. Average unit prices (€ m–3) based on the measured vs. predicted information of the growing stock in Scots pine stands (left) and in Norway spruce stands (right) by soil fertility type.