| Table 1. Characteristics of four studied populations of Prunus serotina located in Pinus sylvestris stands. | |||||||||
| Population | ID | Location | Number of individuals sampled | Habitat type | Invasion stage | No of adults | Density (indv./m2) | Age | P. sylvestris stand age |
| Raszków | R | 51°42’37.89” N 17°44’32.12” E | 109 | agricultural | colonization (isolated stand) | 8 | 0.18 | 17 | 34 |
| Zielonka Forest | Z_1 | 52°30’26.17” N 17°07’08.52” E | 180 | forest | colonization | 3 | 0.68 | 20 | 34 |
| Zielonka Forest | Z_2 | 52°31’00.81” N 17°06’44.46” E | 446 | forest | established | 16 | 1.82 | 35 | 80 |
| Zielonka Forest | Z_3 | 52°31’01.44” N 17°06’57.01” E | 205 | forest | established | 16 | 0.84 | 35 | 146 |
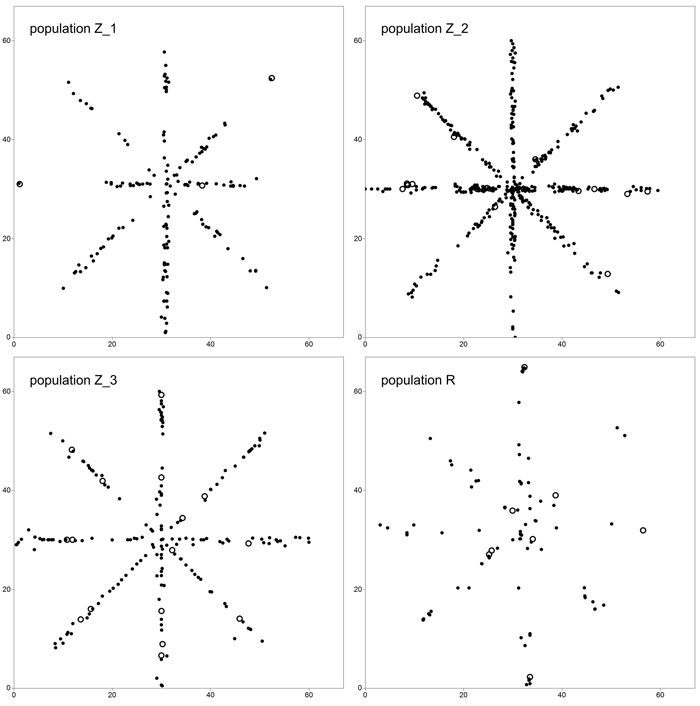
Fig. 1. Sampling scheme in study plots located in four analyzed populations of Prunus serotina. Open circles define location of mature (fruiting) trees. View larger in new window/tab
| Table 2. Characteristics of eight microsatellite loci used. | |||||
| Locus | A | HO | HE | FIS | Null |
| UCD_CH14 | 17 | 0.761 | 0.782 | 0.027 | 0.023 |
| UDP96_005 | 6 | 0.482 | 0.584 | 0.175 | 0.070 |
| UDP98_025 | 9 | 0.723 | 0.757 | 0.045 | 0.027 |
| PCGA43 | 18 | 0.738 | 0.758 | 0.026 | 0.020 |
| PCHGMS3_1 | 20 | 0.639 | 0.813 | 0.214 | 0.090 |
| PCHGMS3_2 | 21 | 0.708 | 0.820 | 0.137 | 0.056 |
| PCHGSM2 | 18 | 0.642 | 0.674 | 0.047 | 0.022 |
| UDP98-405 | 12 | 0.474 | 0.564 | 0.161 | 0.062 |
| Average | 15.1 | 0.646 | 0.719 | 0.104 | 0.046 |
| A – number of alleles, HO – observed heterozygosity, HE – expected heterozygosity, FIS – inbreeding coefficient, Null – frequency of null alleles | |||||
| Table 3. Results of genetic structure, clonal diversity and pedigree analysis conducted in four populations of Prunus serotina. View in new window/tab. |
| Table 4. Fine-scale genetic structure parameters for each population. | ||||
| Studied populations | Fij | bF | Sp | |
| R | Genets Ramets | 0.0346 (0.0075) 0.1568 (0.0239) | –0.01402*** (0.0033) –0.05107*** (0.0089) | 0.0145 0.0601 |
| Z_1 | Genets Ramets | 0.0143 (0.0030) 0.0195 (0.0040) | –0.00672*** (0.0011) –0.01010*** (0.0017) | 0.0068 0.0103 |
| Z_2 | Genets Ramets | 0.0119 (0.0011) 0.0120 (0.0011) | –0.00542*** (0.0006) –0.00558*** (0.0006) | 0.0054 0.0056 |
| Z_3 | Genets Ramets | 0.0232 (0.0059) 0.0258 (0.0057) | –0.00648*** (0.0017) –0.00515*** (0.0012) | 0.0066 0.0053 |
| Fij – the mean kinship coefficient between individuals in the first distance class (5 m), bF – slope of the regression of kinship coefficients on the logarithm of spatial distance, Sp – intensity of FSGS, *** – significant at 0.001, SE – in brackets. | ||||
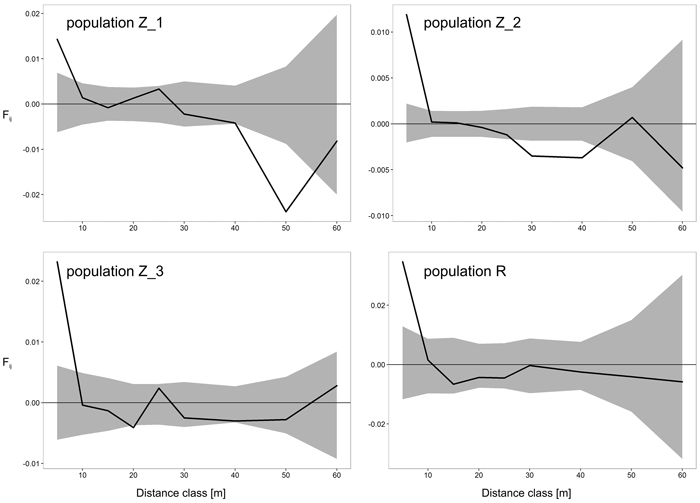
Fig. 2. Spatial correlograms for four analyzed Prunus serotina populations with mean pairwise kinship coefficients (Fij) of six distance classes for eight microsatellite loci. Upper and lower 95% confidence intervals for null hypothesis of random distribution of individuals are shaded. View larger in new window/tab