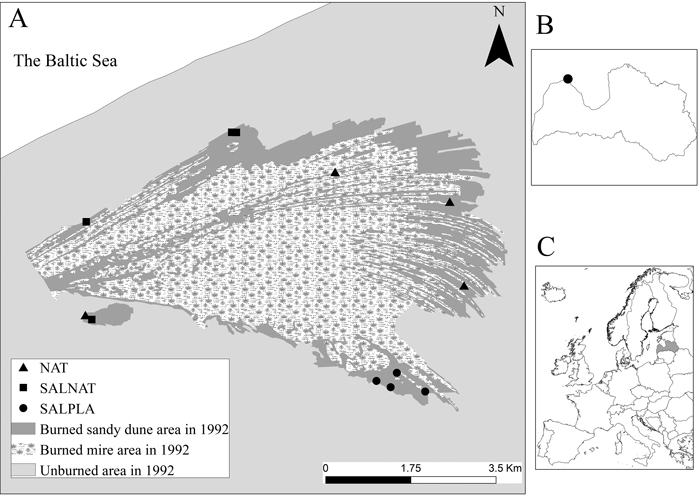
Fig. 1. A. Location of the studied forest stands in Sliteres National park. B. The study site location within Latvia. C. Location of Latvia in Europe. NAT – natural regeneration, SALNAT – salvage logged and left for natural regeneration, SALPLA – salvage logging with planting.
| Table 1. Size of the studied forest stands by type and management. | |||
| Forest type | Size of the forest stands, ha | ||
| NAT | SALNAT | SALPLA | |
| Cladinoso-callunosa | 0.4 | 2.1 | 1.6 |
| Vacciniosa | 3.1 | 4.8 | 1.3 |
| Myrtilloso-sphagnosa | 1.5 | 2.0 | 1.5 |
| Sphagnosa | 2.0 | 1.0 | 0.8 |
| NAT – natural regeneration, SALNAT – salvage logged and left for natural regeneration, SALPLA – salvage logging with planting. | |||
| Table 2. Effect of regenerating saplings (>0.5 m height) on vegetation composition constrained by management type in permutational multivariate analysis of variance. Mean height, DBH (diameter at breast height), basal area, and density of saplings are given. The significant effects are shown in bold. The letters designate significant differences according to the pairwise Tukey’s post-hoc test. The tests were conducted separately for each of the four forest types. View in new window/tab. |
| Table 3. Measured mean canopy openness and its effect on species composition constrained by management type as determined by paired permutation multivariate analysis of variance. Significant effects are shown in bold and letters indicate significant differences according to the pairwise Tukey’s post-hoc test. The tests were conducted separately for each of the four forest types. | |||||||||
| Mean canopy openness | NAT vs SALNAT | SALNAT vs SALPLA | SALPLA vs NAT | ||||||
| NAT | SALNAT | SALPLA | p-value | F-value | p-value | F-value | p-value | F-value | |
| Cladinoso-callunosa | 45.3 | 20.3 | 47.9 | 0.8 | 0.5 | 0.02 | 2.3 | 0.07 | 1.7 |
| Vacciniosa | 32.7A | 25.2B | 24.8C | <0.001 | 4.2 | 0.008 | 2.9 | <0.001 | 4.2 |
| Myrtilloso-sphagnosa | 24.7B | 53.6A | 23.9C | 0.002 | 3.8 | <0.001 | 6.3 | 0.04 | 1.9 |
| Sphagnosa | 61.7A | 27.4B | 47.9B | 0.04 | 2.1 | <0.001 | 5.8 | 0.2 | 1.2 |
| NAT – natural regeneration, SALNAT – salvage logged and left for natural regeneration, SALPLA – salvage logging with planting. | |||||||||
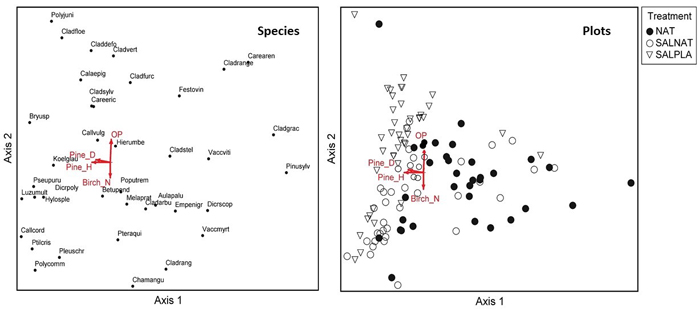
Fig. 2. Species and sample plot ordination (Detrended correspondence analysis) for Cladinoso callunosa stands. Vectors show correlations between the vegetation gradients and canopy openness (OP), mean diameter at breast height of regenerating Scots pine ( Pine_D ), mean height of regenerating Scots pine (Pine_H) and density of regenerating Silver birch (Birch_N). NAT – natural regeneration, SALNAT – salvage logged and left for natural regeneration, SALPLA – salvage logging with planting. Species abbreviations are shown in full in Supplementary file S1. View larger in new window/tab.
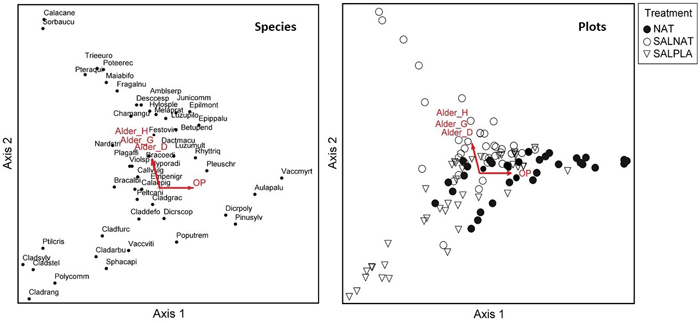
Fig. 3. Species and sample plot ordination (Detrended correspondence analysis) for Vacciniosa stands. Vectors show correlations between the vegetation gradients and canopy openness (OP), mean diameter at breast height of regenerating black alder (Alder_D), mean height of regenerating black alder (Alder_H) and basal area of regenerating black alder (Alder_G). NAT – natural regeneration, SALNAT – salvage logged and left for natural regeneration, SALPLA – salvage logging with planting. Species abbreviations are shown in full in Suppl. file S1. View larger in new window/tab.
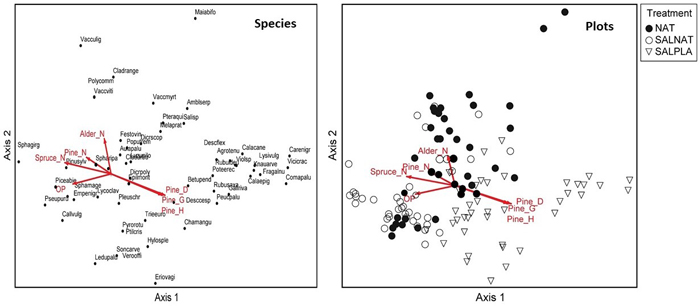
Fig. 4. Species and sample plot ordination (Detrended correspondence analysis) for Myrtilloso-sphagnosa stands. Vectors show significant correlations of vegetation gradients and canopy openness (OP), mean diameter at breast height of regenerating Scots pine (Pine_D), mean height of regenerating Scots pine (Pine_H), basal area of regenerating Scots pine (Pine_G), density of regenerating Norway spruce (Spruce_N), Scots pine (Pine_N) and black alder (Alder_N). NAT – natural regeneration, SALNAT – salvage logged and left for natural regeneration, SALPLA – salvage logging with planting. Species abbreviations are shown in full in Suppl. file S1. View larger in new window/tab.
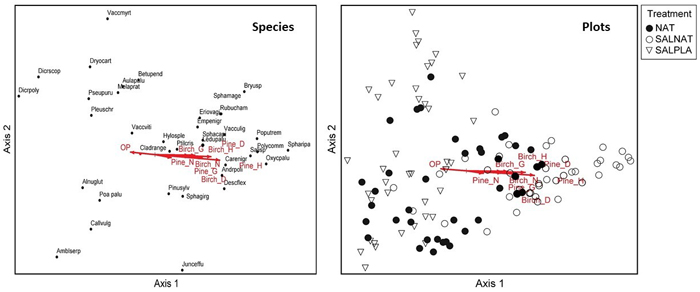
Fig. 5. Species and sample plot ordination (Detrended correspondence analysis) for Sphagnosa stands. Vectors show significant correlations of vegetation gradients and canopy openness (OP), basal area of regenerating Silver birch (Birch_G) and Scots pine (Pine_G), mean height of regenerating Silver birch (Birch_H) and Scots pine (Pine_H), mean diameter at breast height of regenerating Scots pine (Pine_D) and Silver birch (Birch_D), and density of regenerating Scots pine (Pine_N) and Silver birch (Birch_N). NAT – natural regeneration, SALNAT – salvage logged and left for natural regeneration, SALPLA – salvage logging with planting Species abbreviations are shown in full in Suppl. file S1. View larger in new window/tab.
| Table 4. Indicator species of management by forest types. P-values and indicator values (IV) are given. The analysis was conducted separately for each of the four forest types. | |||||||||
| NAT | SALNAT | SALPLA | |||||||
| Species | p-value | IV | Species | p-value | IV | Species | p-value | IV | |
| Cladinoso-callunosa | Dicranum scoparium Hedw. | <0.001 | 81.3 | Melampyrum pratense L. | <0.001 | 85.0 | Cladonia deformis (L.) Hoffm. | 0.002 | 77.0 |
| Cladonia rangiferina (L.) Weber ex F.H. Wigg. | <0.001 | 51.0 | Pleurozium schreberi (Willd. ex Brid) Mitt. | 0.007 | 37.7 | Polytrichum juniperinum Hedw. | 0.002 | 38.8 | |
| Cladonia arbuscula (Wallr.) Flot. | <0.001 | 38.1 | Calluna vulgaris (L.) Hull | 0.044 | 38.5 | ||||
| Pine seedlings Pinus sylvestris L. | <0.001 | 45.0 | Cladonia furcata (Huds.) Schrad., 1794 | <0.001 | 67.9 | ||||
| Vaccinium vitis-idaea L. | 0.001 | 45.2 | |||||||
| Vacciniosa | Vaccinium myrtillus L. | <0.001 | 54.8 | Calluna vulgaris (L.) Hull | 0.01 | 41.9 | Polytrichum commune Hedw. | <0.01 | 59.6 |
| Aulacomnium palustre (Hedw.) Schwägr. | <0.001 | 33.3 | Festuca ovina L. | <0.001 | 55.6 | ||||
| Luzula pilosa (L). Willd. | <0.001 | 30.8 | |||||||
| Melampyrum pratense L. | <0.001 | 57.7 | |||||||
| Pteridium aquilinum (L.) Kuhn | <0.001 | 39.0 | |||||||
| Hylocomium splendens (Hedw.) Schimp. | <0.001 | 55.0 | |||||||
| Myrtilloso-sphagnosa | Vaccinium vitis-idaea L. | 0.002 | 46.2 | Calluna vulgaris (L.) Hull | <0.001 | 59.2 | Birch seedlings Betula pendula Roth | <0.001 | 74.6 |
| Polytrichum commune Hedw. | <0.001 | 53.2 | Sphagnum girgensohnii Russow | <0.001 | 82.5 | Eriophorum vaginatum L. | <0.001 | 39.8 | |
| Sphagnosa | Sphagnum girgensohnii Russow | 0.005 | 39.5 | Oxycoccus palustris Pers. | <0.001 | 50.2 | Birch seedlings Betula pendula Roth | <0.001 | 59.2 |
| Salix spp. | <0.001 | 42.5 | Calluna vulgaris (L.) Hull | 0.006 | 38.6 | ||||
| Polytrichum commune Hedw. | <0.001 | 88.6 | Vaccinium myrtillus L. | <0.001 | 48.2 | ||||
| Sphagnum riparium Ångstr. | <0.001 | 30.0 | Dicranum polysetum Sw. | <0.001 | 64.5 | ||||
| Ledum palustris L. | 0.023 | 34.2 | Aulacomnium palustre (Hedw.) Schwägr. | <0.001 | 54.4 | ||||
| NAT – natural regeneration, SALNAT – salvage logged and left for natural regeneration, SALPLA – salvage logging with planting. | |||||||||
| Table 5. Species richness according to forest type and management. Significant effects are shown in bold (according to ANOVA). The different letters indicate significant differences between management types according to the pairwise Tukey’s post-hoc test. The analysis was conducted separately for each of the four forest types. | |||
| Number of species (with mosses) | |||
| NAT | SALNAT | SALPLA | |
| Cladinoso-callunosa | 19 | 26 | 22 |
| Vacciniosa | 16A | 40B | 26A |
| Myrtilloso-sphagnosa | 29A | 23A | 49B |
| Sphagnosa | 22 | 31 | 22 |
| NAT – natural regeneration, SALNAT – salvage logged and left for natural regeneration, SALPLA – salvage logging with planting. | |||