| Table 1. Number of trees in different categories (Usnea longissima present, newly established, disappeared, or if the tree had fallen to the ground), in 2012 compared to 2005/06, within study sites and whether the trees were influenced by the experimental selective loggings. The five last columns show forest stand level information. Sites with no logging are shaded. View in new window/tab. |
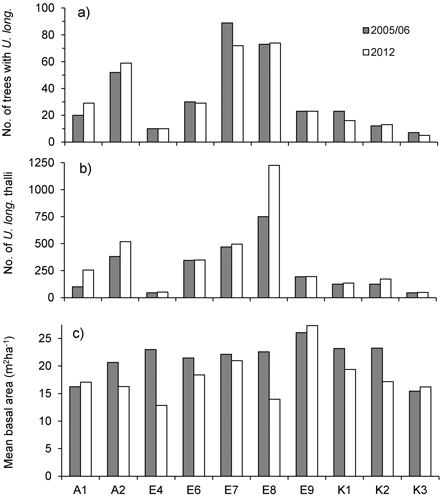
Fig. 1. a) Total number of trees with Usnea longissima, b) total number of U. longissima thalli, and c) mean basal area (m2ha–1) around the trees with U. longissima, within study sites in 2005/06 (gray bars) and in 2012 (white bars).
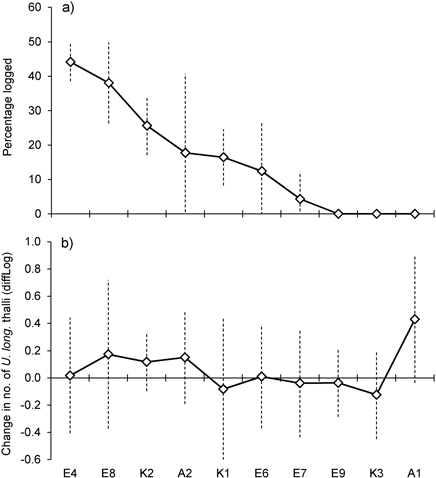
Fig. 2. a) Percent of basal area logged within study sites, sorted from the highest to the lowest amount of logging. b) Mean change in number of Usnea longissima thalli within study sites. Note that the y-axes show diffLog values (0 = no change, 0.25 ≈ 2x, 0.5 ≈ 4x, –0.25 ≈ ½x, –0.5 ≈ ¼x, etc., see Methods for further details). Vertical bars show ± 1 SD.
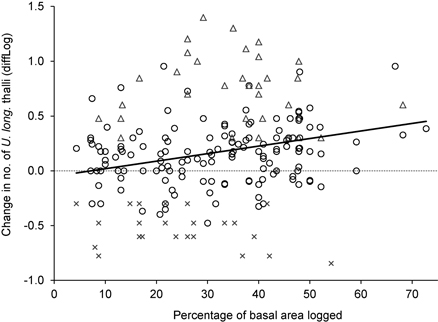
Fig. 3. The relationship between logging influence around trees (measured as the percentage of basal area removed), and the change in number of Usnea longissima thalli (diffLog). Circles show trees where the lichen was present both in 2005/06 and 2012, triangles show trees with new establishment, and crosses show trees where the lichen had disappeared.
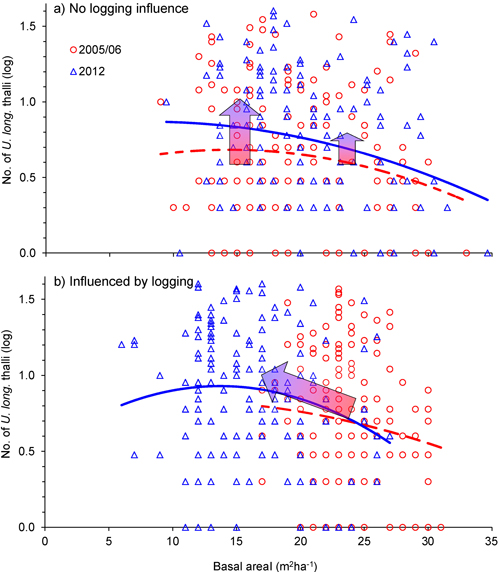
Fig. 4. Relationship between tree density (basal area, m2ha–1) and number of Usnea longissima thalli in 2005/06 (red) and in 2012 (blue), for single trees that were a) not influenced by logging, and b) influenced by the selective logging events. The blue 2nd-order polynomial regression lines were statistically significant (p = 0.01 in upper and p = 0.05 in lower panel), whereas the dotted, red lines were not. The wide red/blue arrows illustrate how mean values changed from 2005/06 to 2012. Note that the y-axes are logarithmically scaled.
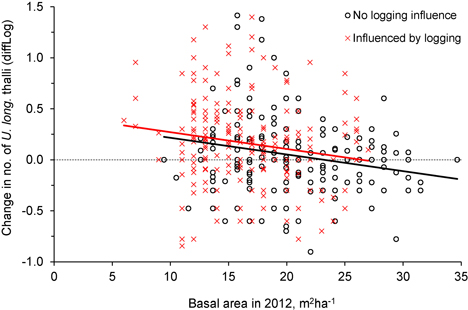
Fig. 5. The relationship between tree density (basal area, m2ha–1) after logging (in 2012) and the change in number of Usnea longissima thalli (diffLog) from 2005/06 to 2012. Black circles (and black fitted line) show trees not influenced by logging, whereas red crosses (and red line) show trees that were influenced by the experimental logging events.
| Table 2. Parameter estimates of the linear model (ANCOVA) between change in number of Usnea longissima thalli on individual trees (diffLog, dependent variable), and logging influence (categorical) and tree density (basal area) in 2012 (independents) (model R2 = 0.06, F = 11.5, p < 0.0001, n = 381). The interaction term between the two independent variables was not significant (t = 0.078, p = 0.94). | ||||
| Variable | Coefficient | SE | t-value | p-value |
| Intercept | 0.407 | 0.083 | 4.88 | <0.0001 |
| Logging influence (categorical) | 0.034 | 0.022 | 1.57 | 0.118 |
| Basal area in 2012 (m2ha–1) | −0.017 | 0.005 | −3.73 | 0.0002 |
| Table 3. Spearman rank correlations between change (diffLog) in number of Usnea longissima thalli (from 2005/06 to 2012) and size, age, and different growth variables of individual trees (n = 75). Note that the growth variables were measured in 2005/06. | ||
| Variable | Spearman rank | |
| rs | p-value | |
| DBH, cm | −0.13 | 0.29 |
| Total age, yrs | 0.001 | 0.99 |
| Mean tree-ring width last 5 yrs, mm | −0.06 | 0.63 |
| Mean tree-ring width last 10 yrs, mm | −0.04 | 0.75 |
| Mean tree-ring width last 20 yrs, mm | −0.01 | 0.96 |
| GI 5 yr / 5 yr * | −0.14 | 0.24 |
| GI 10 yr / 10 yr | −0.11 | 0.34 |
| GI 10 yr / 20 yr | −0.01 | 0.90 |
| GI 10 yr / 10 yr, max-value after 1950 | 0.06 | 0.59 |
| GI 10 yr / 10 yr, min-value after 1950 | −0.15 | 0.20 |
| GI 10 yr / 10 yr, max-value after 1975 | 0.04 | 0.75 |
| GI 10 yr / 10 yr, min-value after 1975 | −0.08 | 0.48 |
| * GI 5 yr / 5 yr = (mean tree ring width 2001–2005) / (mean tree ring width 1996–2000). (See Storaunet et al. 2008 for further details.) | ||
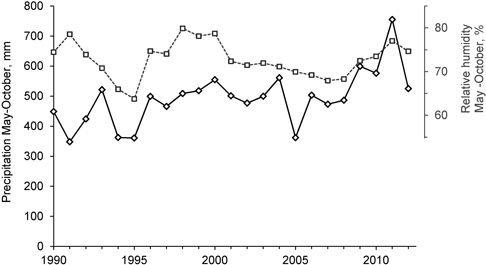
Fig. 6. Precipitation (solid line, left axis) and relative humidity (dotted line, right axis) in the region, from 1st of May to 31st of October, from 1990 to 2012. Data from The Norwegian Meteorological Institute (www.eklima.no), Biri (precipitation) and Lillehammer (relative humidity) meteorological stations.