Matti Sirén  ,
Jari Ala-Ilomäki,
Harri Lindeman,
Jori Uusitalo,
Kalle E.K. Kiilo,
Aura Salmivaara,
Ari Ryynänen
,
Jari Ala-Ilomäki,
Harri Lindeman,
Jori Uusitalo,
Kalle E.K. Kiilo,
Aura Salmivaara,
Ari Ryynänen
Soil disturbance by cut-to-length machinery on mid-grained soils
Sirén M., Ala-Ilomäki J., Lindeman H., Uusitalo J., Kiilo K. E.K., Salmivaara A., Ryynänen A. (2019). Soil disturbance by cut-to-length machinery on mid-grained soils. Silva Fennica vol. 53 no. 2 article id 10134. https://doi.org/10.14214/sf.10134
Highlights
- The number of machine passes, volumetric water content in the mineral soil and the depth of the organic layer were the controlling factors for rut formation
- The harvester rut depth was a good predictor of the forwarder rut formation
- Changes in the penetration resistance were highest at depths of 20–40 cm.
Abstract
Factors affecting soil disturbance caused by harvester and forwarder were studied on mid-grained soils in Finland. Sample plots were harvested using a one-grip harvester. The harvester operator processed the trees outside the strip roads, and the remaining residues were removed to exclude the covering effect of residues. Thereafter, a loaded forwarder made up to 5 passes over the sample plots. The average rut depth after four machine passes was positively correlated to the volumetric water content at a depth of 0–10 cm in mineral soil, as well as the thickness of the organic layer and the harvester rut depth, and negatively correlated with penetration resistance at depths of both 0–20 cm and 5–40 cm. We present 5 models to predict forwarder rut depth. Four include the cumulative mass driven over a measurement point and combinations of penetration resistance, water content and the depth of organic layer. The fifth model includes harvester rut depth and the cumulative overpassed mass and provided the best fit. Changes in the penetration resistance (PR) were highest at depths of 20–40 cm. Increase in BD and VWC decreased PR, which increased with total overdriven mass. After four to five machine passes PR values started to stabilize.
Keywords
rut formation;
soil compaction;
sandy soil;
silty soil;
harvesting damage
-
Sirén,
Natural Resources Institute Finland (Luke) c/o Aalto University, P.O. Box 15600, FI-00076 Aalto, Finland
E-mail
matti.siren@luke.fi
-
Ala-Ilomäki,
Natural Resources Institute Finland (Luke) c/o Aalto University, P.O. Box 15600, FI-00076 Aalto, Finland
 http://orcid.org/0000-0002-6671-7624
E-mail
jari.ala-ilomaki@luke.fi
http://orcid.org/0000-0002-6671-7624
E-mail
jari.ala-ilomaki@luke.fi
- Lindeman, Natural Resources Institute Finland (Luke), Korkeakoulunkatu 7, FI-33720 Tampere, Finland E-mail harri.lindeman@luke.fi
-
Uusitalo,
Natural Resources Institute Finland (Luke), Korkeakoulunkatu 7, FI-33720 Tampere, Finland
http://orcid.org/0000-0003-3793-1215
E-mail
jori.uusitalo@luke.fi
- Kiilo, Versowood, Teollisuuskatu 1, FI-11130 Riihimäki, Finland E-mail kalle.kiilo@versowood.fi
- Salmivaara, Natural Resources Institute Finland (Luke), P.O. Box 2, FI-00791 Helsinki, Finland E-mail aura.salmivaara@luke.fi
- Ryynänen, Natural Resources Institute Finland (Luke), Kaironiementie 15, FI-39700 Parkano, Finland E-mail ari.ryynanen@luke.fi
Received 8 January 2019 Accepted 2 April 2019 Published 26 April 2019
Views 183397
Available at https://doi.org/10.14214/sf.10134 | Download PDF

1 Introduction
To increase the year-round utilization of effective but capital-intensive harvesting machinery with acceptable negative impacts on soil and forests in changing climate conditions is a challenging task. In this respect, two main questions arise. First, the time and weather conditions facilitating operations on the site, and second, the optimal means of operation. To solve the first question, there are tools to classify site trafficability. Open geospatial data has a strong potential in harvesting planning and implementation (Venäläinen et al. 2015). Additionally, LIDAR extracted digital terrain models can be used to model soil moisture conditions. Forest trafficability can be estimated by using topographic soil wetness measures such as the cartographic depth-to-water index (DTW) (Murphy et al. 2007, 2009, 2011), the topographic wetness index TWI (Beven and Kirkby 1979) and local elevation patterns such as the local binary pattern LBP (Ojala et al. 2002; Niemi et al. 2017). These methods have shown promising results (Salmi et al. 2013; Ågren et al. 2014; Jones and Arp 2017; Niemi et al. 2017) and, for example, in Sweden it was found, that more than 60% of soil damage was on areas characterized as “wet” based on the DTW maps (Bergkvist et al. 2014).
The harvesting planning tool BESTWAY (Friberg 2014; Friberg and Bergkvist 2016; Willén et al. 2017) is already widely used in practical operations in Sweden and has established a good reputation. In Finland, harvesting planning and operator tutoring tools such as the logging map developed by Väätäinen et al. (2013) and the strip road planner “Ajourakone” (Räsänen et al. 2017) have been tested. One of the main objectives of these tools is to find optimal places for heavily trafficked primary strip roads.
In Finland, a novel classification system for the potential harvest seasons of stands uses a soil moisture index together with volume of trees, soil type, drainage ditch depth, and the percentage of Norway spruce defined from air-borne LIDAR data to determine the optimal harvesting time on a 16 × 16 m grid (Peuhkurinen 2017). Experience of the classification system has been promising (Luoma 2017). Static trafficability maps have been made available as open data and now cover 21 areas of 4 million hectares. In the future, classifications are likely to become more reactive to weather changes (Vega-Nieva et al. 2009; Jones and Arp 2017; Salmivaara et al. 2017).
Mohtashami et al. (2017) made a survey on the influence of the soil type, DTW, slash reinforcement and traffic intensity on rut formation. The saturated areas captured by the DTW index were classified into two groups; DTW < 1 m and DTW > 1 m. The soil type and traffic intensity were significant factors in rut formation, while DTW and slash reinforcement were not. DTW maps need information on the soil type to contribute to supporting decisions. The importance of structural soil properties such as stoniness was also found by Niemi et al. (2017) when they tested airborne LIDAR-derived elevation data in trafficability mapping.
To get the full advantage of wetness maps and other planning tools, we should know the soil properties and how they are influenced by the water content. Soil susceptibility to rutting depends on variations in soil texture, density and weather-affected changes in moisture content. It is therefore difficult to know when and where off-road traffic will lead to rutting-induced soil disturbances (Jones and Arp 2017). When dry, soil has a high degree of particle-to-particle bonding, interlocking and frictional resistance to deformation (Hillel 1998). As the soil water content increases, the frictional forces between the soil particles are reduced leading to lower soil bearing capacity and higher susceptibility to compaction (McNabb et al. 2001; Han et al. 2006). Above critical moisture content, machine-induced stress leads to rut formation (Hillel 1998).
The impact of soil moisture is strongest in cohesive, fine-textured soils (i.e. clays and loams) and weakest in sandy soils (Vega-Nieva et al. 2009; Campbell et al. 2013; Jones and Arp 2017). Fine-textured soils are generally more susceptible to compaction than coarse-textured ones (Wästerlund 1985; Hillel 1998), as the trafficability of coarse-grained mineral soils is fairly independent of the soil moisture (Elbanna and Witney 1987).
Uusitalo et al. (2019) modelled soil moisture and strength relationships for fine-grained upland forest soils. The penetration resistance was correlated with water content, soil bulk density and the clay content. In fully saturated, silty and clayey soils, the penetration resistance of the first 15 cm can be as low as 600–800 kPa, and the strength of the soil is almost as weak as the organic layer on top of mineral soil. The influence of soil moisture has also been noticed in wheeling experiments on fine-grained soils. In studies by Toivio et al. (2017) and Sirén et al. (2019) there were positive correlations between moisture and rut formation. Earlier, Sirén et al. (2013a) found that rut formation in dry, sandy clay was low.
The optimal way to operate on a stand requires operator tutoring. In this, accurate knowledge about the locations and volumes of different timber sortiments (Lindroos et al. 2015; Hauglin et al. 2017) and soil bearing capacity play an important role. Utilization of this data can help the forwarder operator determine the optimal driving tactics and minimize the number of passes on points with poor bearing capacity. Väätäinen et al. (2012) found, that with operator tutoring productivity can be raised, soil damage can be reduced, and fuel can be saved. There are promising results on harvester-measured rut depths with LIDAR (Salmivaara et al. 2018) and CAN-bus information (Ala-Ilomäki et al. 2012) for trafficability prediction. These results can be used in producing trafficability maps for forwarding and creating large-scale validation data for trafficability predictions. Earlier results have shown that rut formation after a harvester pass is a good predictor for forwarder rut formation on peatland (Sirén et al. 2013b) as well as on mineral soils (Sirén et al. 2013a, 2019).
Soil compaction during timber harvesting, although widely researched in many countries, has only recently been studied in Finland. Soil compaction results in reduced porosity, which implies limitations in the oxygen and water supply to soil microorganisms and plants, with negative consequences for soil ecology and forest productivity (Cambi et al. 2015). Soil compaction increases the bulk density, reduces soil porosity, reduces infiltration rates and lowers soil permeability (Froehlich et al. 1981). Generally, the lower the bulk density of the soil, the more prone it is to compaction (Hillel 1998; Williamson and Neilsen 2000). Most of the impact on soil usually occurs on the first few machine passes, while later the soil density increases only a little (Han et al. 2006; Wang 1997). The progressive effect of machine passes differs significantly according to the physical properties and depth of the soil and depends strictly on the soil texture (Cambi et al. 2015).
We had two main goals in this study. The first was to determine the predictive factors for rut formation on mid-grained, sandy soils and to present models for rut formation for different purposes. We also wanted to know if the earlier findings on the relation between harvester and forwarder rut formation (Sirén et al. 2013a, 2013b, 2019) hold true for mid-grained soil. The second goal was to examine soil compaction and factors affecting it and to gain experience of soil compaction in mid-grained soils.
2 Material and methods
2.1 Study sites, soil and rut measurements
Wheeling experiments were carried out in late May 2017 at Kuru in Finland on a clear-cutting site (61°57´N, 23°50´E, WGS84) which was forest property owned by the Finnish forest and land management company Finsilva. The average temperature in the Kuru area in May was 7.3 °C, which was 1.6 °C lower than the long-term (20 year) average. The monthly rainfall was 13.9 mm, which was 30.9% of long time average (Ilmatieteen laitoksen sääasemien arkisto). The experimental design is presented in Fig. 1.
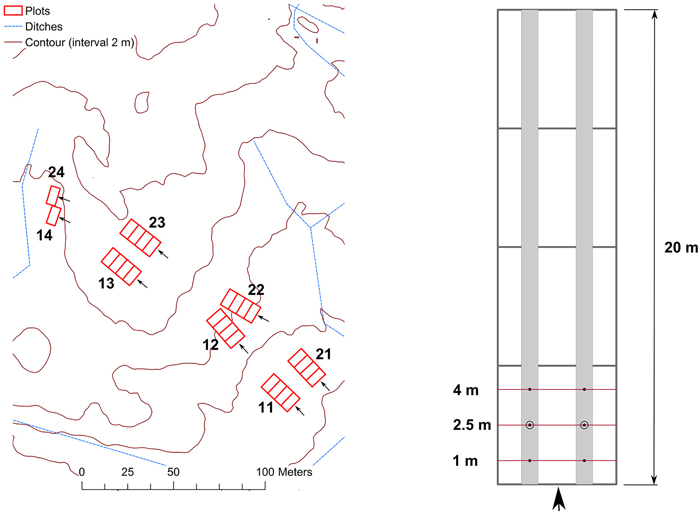
Fig. 1. The experimental design at Kuru. On the right 20 m sample plot divided to four subplots with penetration resistance and rut depth measurement points (●) and soil sample plots (○).
Two parallel test tracks of 200 meters were marked on the site. On both strip roads three sample plots of 20 meters and one of 10–15 meters were marked and premeasured. The sample plots were divided into 5-meter subplots, and on each subplot three transverse measuring lines were marked; at 1 m, 2.5 m and 4 m from the subplot start. Rut measuring points were indicated on both wheel tracks of these lines. Before harvesting, the tree species distribution and timber volume of the sample plots were determined. The diameter at a height of 1.3 m for each tree and a sample of the tree heights for each tree species were measured. The stand characteristics for each plot were calculated using the KPL software developed at the Finnish Forest Research Institute (Heinonen 1994). Stem volumes of the sample trees were calculated using volume functions based on the measured stem diameter (d1.3) and tree height (Laasasenaho 1982).
Before harvesting the following measurements were taken:
At each measurement point (6 per subplot):
- The relative elevation of the measurement point (construction laser level)
- Penetration resistance (PR)
On each subplot:
- Two soil samples
- Stoniness as described by the penetration depth of a steel rod (Tamminen 1992) at three points
Measurements during and after harvesting:
- Rut depth at every measurement point after each machine pass (construction laser level)
- Penetration resistance:
- At every measurement point of one subplot per sample plot after harvester pass and each forwarder pass
- At all other measurement points after last forwarder pass.
The penetration resistance was measured with an Eijkelkamp 0615SA Penetrologger penetrometer with a 30-degree 1 cm2 base area cone. The measurements were done without removing the organic layer and readings were captured for each 1 cm of penetration depth determined by an ultrasonic sensor.
Soil samples were taken with a core sampler which was 500 mm in height and 46 mm in diameter. The samples were analyzed for the depth of organic layer thickness (cm), volumetric water content (VWC, %), dry bulk density (BD, g cm–3) in Luke laboratory at Jokioinen. The particle size distributions were analyzed by Eurofins Viljavuuspalvelu Ltd. The soil analysis was done for mineral soil depths of 0–10 cm and 10–20 cm.
In sample plots 14 and 24 the soil changed from mineral soil to peat soil after the first subplot, and only one subplot from these plots is included in our study material.
2.2 Test drives
Test tracks were harvested with an 8-wheeled Ponsse Scorpion King harvester driven by an experienced machine operator. On test track 1 (sample plots 11–14), the harvester had Nokian Forest King F2 710/45-26.5 tires with chains in front and Olofsfors Evo Soft tracks on the rear. The machine mass with steel tracks was estimated at 24 500 kg. On strip road 2 (sample plots 21–24) the machine had chains on the front wheels and no tracks or chains on the rear, and the machine mass was estimated at 22 500 kg. The harvester was equipped with a Ponsse H6 harvester head. The harvester operator was asked to process the harvested trees outside the strip roads to minimize the amount of logging residue on the test tracks, as we wanted to avoid the influence of residues on rut formation. Occasional pieces of residue were manually removed from the tracks before forwarding. On both test tracks, the harvester and the forwarder drove constantly in the same direction slightly uphill (max. under 5°).
The forwarder test drives were carried out with an 8-wheeled John Deere 1210 E forwarder driven by an experienced operator. The machine had Nokia Forest King F2 710/45-26.5 tires, universal Olofsfors Evo Soft tracks on the rear bogie and chains on the front bogie wheels. All the forwarder passes were driven loaded with 14.9 m3 of Norway spruce timber weighing 11 920 kg. The total mass of machine and load was 32 020 kg.
2.3 Data processing and modelling
On the subplots the measurement lines were set at determined distances. After harvesting it was checked whether there were any stumps or superficial stones just at the measurement point. As we wanted to study the influence of soil properties, measurement points with stump or stone were excluded from the analysis. The total number of observations came to 894, of which 189 observations from 32 measurement points were excluded. A logarithmic transformation of the measurement point rut depth was used as a dependent variable in the modelling and the value 0.5 cm was given to 130 observations with an original value of 0cm to include them in the model. Part of these observations with an original value of 0cm had a stump or stone at the measurement point. After removing these, changing the 0value to 0.5 was accomplished for 89 observations used in the modelling.
The statistical analysis included a correlation analysis to find the relations between the variables and the mixed modelling technique in modelling the factors explaining rut formation. In the soil compaction calculations, mainly the data covering a full set of machine passes (one subplot per sample plot) was used. When studying the compaction after the machine passes, the penetration resistance values were adjusted according to the rut depth to compare the same soil layers. The rut depth values of the measurement points were used in the adjustment.
In modelling the rut depth, the influences of the volumetric water content (VWC, %), penetration resistance (PR, MPa), soil bulk density (BD, g cm–3), depth of the organic layer (cm), soil stoniness expressed by the average rod penetration depth (ARP, cm), and the cumulative total mass (CM, kg) driven over the measurement point were tested. Part of the variables was measured at the measurement point level while part had subplot average values. The influence of the penetration resistance was tested as an average of two depths at 0–20 cm and 5–40 cm. The influence of BD and VWC was tested on average values at depths of 0–10 cm and 10–20 cm in mineral soil. Additionally, the influence of the amount of standing timber before cutting, in terms of its basal area (BA, m2), was tested in the modelling. Highly cross correlated independent variables were avoided in modelling.
We also tested whether the rut depth after the harvester pass (Hr, cm) could be used as an indicator of the rut depth for the following forwarder passes. In this case, only observations after the first pass (harvester) were used and each observation was given the measured Hr.
In the modelling of soil compaction, in our study described as change in soil PR values adjusted to rut depth, the influences VWC (%) and BD (g cm–3) were studied. Values of VWC and BD at depths of 0–10 cm and 10–20 cm and also the averages of 0–20 cm in mineral soil were tested in modelling. Also the influence of soil stoniness expressed by average rod penetration depth (ARP, cm), cumulative total mass (CM, kg) driven over the measurement point and rut depth (cm) were tested.
The statistical significance of the variables was tested by using the Linear Mixed Models procedure of the IBM SPSS v.25 software. The REML estimation method was used. Models were compared by using fit statistics (Akaike Information Criterion, AIC) and residuals for the models. Let i denote the measurement (repeated after each pass) and m the measurement point within the plot p, the basic form of the mixed model predicting the logarithm of the rut depth or penetration resistance y was:
![]()
where:
y = the rut depth or penetration resistance at measurement point,
b0 = a constant,
b = (row) the vector of the (fixed) regression coefficients,
X = (column) the vector of the explanatory variables,
up = the random term (variance) for the plot p,
vpm = random term (variance) for measurement point m in plot p,
epmi = auto-regressive error term for repeated measurements pmi.
In order to account for the correlation between repeated measurements of the same plot, a first order auto-regressive AR(1) covariance structure was assumed for the residuals epmi meaning that successive passes are more correlated, with correlation coefficient ρmeas, and the correlation decreases toward zero with an increasing difference in the number of passes. In rut depth modelling the within-plot correlation between measurement points was modelled using the AR(1) structure, meaning the adjacent measurement points were more correlated with coefficient ρplot, than pairs of plots further apart within the same plot. Parameters σ2plot and σ2meas are the variances of random effects up and epmi, respectively. In soil compaction modelling random effects were modelled with default (Variance components) structure.
3 Results
3.1 Site conditions
The average soil and stand conditions are presented in Table 1.
| Table 1. Soil characteristics at the study plots. VWC = Volumetric water content (%) at 0–10 cm, 10–20 cm depth in mineral soil, PR = Penetration resistance (Mpa) at 20 cm, 10–40 cm depth, BD = Soil bulk density (g cm–3) at 0–10 cm, 10–20 cm depth in mineral soil, ARP = Average steel rod penetration (cm), Org. layer = Depth of organic layer (cm), Soil type (EN ISO 2002, 2004): Sandy Silt (1); Silty sand (2). | |||||||||
| Plot | VWC 0–10 Mean (std.dev.) % | VWC 10–20 Mean (std.dev.) % | PR 20 Mean (std.dev.) MPa | PR 10–40 Mean (std.dev.) MPa | BD 0–10 Mean (std.dev.) g cm–3 | BD 10–20 Mean (std.dev.) g cm–3 | ARP Mean (std.dev) cm | Org. layer Mean (std.dev.) cm | Soil type |
| 11 | 39.62 (3.84) | 26.58 (7.18) | 1.63 (1.43) | 1.80 (0.83) | 1.35 (0.10) | 1,32 (0.20) | 64.47 (24.01) | 10.45 (1.84) | 2 |
| 12 | 31.31 (2.34) | 33.93 (3.50) | 1.46 (0.97) | 1.55 (0.54) | 1.12 (0.14) | 1.24 (0.06) | 55.80 (14.83) | 9.60 (1.27) | 2 |
| 13 | 32.77 (2.32) | 37.93 (3.65) | 1.37 (0.88) | 1.38 (0.49) | 1.17 (0.08) | 1.26 (0.04) | 66.32 (6.57) | 10.82 (0.95) | 2/1 |
| 14 | 64.35 (-) | 46.12 (-) | 1.02 (1.04) | 1.35 (0.43) | 0.73 (-) | 1.27 (-) | 54.00 (-) | 12.00 (-) | 2 |
| All | 35.41 (7.14) | 33.93 (6.96) | 1.45 (1.11) | 1.56 (0.64) | 1.19 (0.17) | 1.27 (0.12) | 61.82 (17.05) | 10.33 (1.50) | |
| 21 | 39.18 (4.26) | 34.38 (3.54) | 1.38 (1.19) | 1.56 (0.84) | 1.29 (0.18) | 1.43 (0.14) | 49.59 (4.88) | 13.06 (1.51) | 2 |
| 22 | 25.26 (3.55) | 28.62 (2.40) | 1.85 (1.13) | 1.75 (0.76) | 1.17 (0.11) | 1.36 (0.06) | 55.30 (2.46) | 9.90 (0.74) | 2/1 |
| 23 | 29.28 (1.66) | 32.38 (3.51) | 1.41 (0.66) | 1.38 (0.44) | 1.00 (0.12) | 1.22 (0.10) | 51.61 (1.54) | 7.42 (0.79) | 2 |
| 24 | 41.88 (-) | 36,48 (-) | 0.88 (1.00) | 1.51 (0.85) | 0.95 (-) | 1.58 (-) | 24.00 (-) | 10.00 (-) | 2 |
| All | 31.34 (6.92) | 31.59 (4.07) | 1.50 (1.04) | 1.56 (0.72) | 1.14 (0.18) | 1.34 (0.14) | 51.10 (6.98) | 10.06 (2.43) | |
| All | 33.47 (7.28) | 32.65 (5.93) | 1.48 (1.07) | 1.56 (0.68) | 1.17 (0.18) | 1.31 (0.14) | 56.57 (14.17) | 10.20 (2.01) | |
The average basal area of tree stand before cutting was 23.45 m2 ha–1 (the averages of sample plots 15.4–31.7 m2 ha–1) and the average stand volume 236.5 m3 ha–1 (the averages of sample plots 147.9–334.4). The average basal area on strip road 1 was 24.42 m2 ha–1 and stand volume 246.7 m3 ha–1. On strip road 2 the average basal area was 22.45 m2 ha–1 and stand volume 226.4 m3 ha–1. The lowest stand volumes were on sample plots 14 and 24. The average number of trees/ha before harvesting was 608 (variation between plots 400–900). Near 70% of stand volume was pine, 27% spruce and less than 5% birch.
The particle size distributions of the study plot soil samples are presented in Fig. 2 and the plot-average PR profiles before harvesting are presented in Fig. 3.
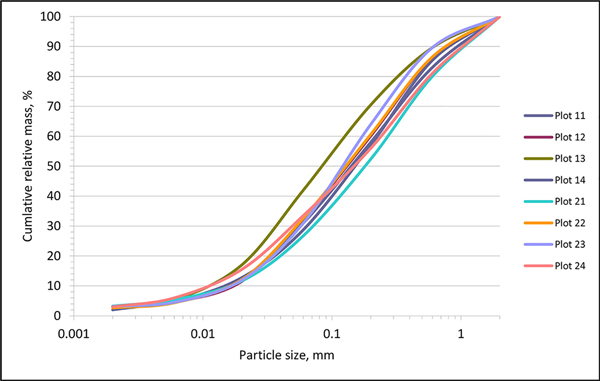
Fig. 2. Particle size distributions of study plots.
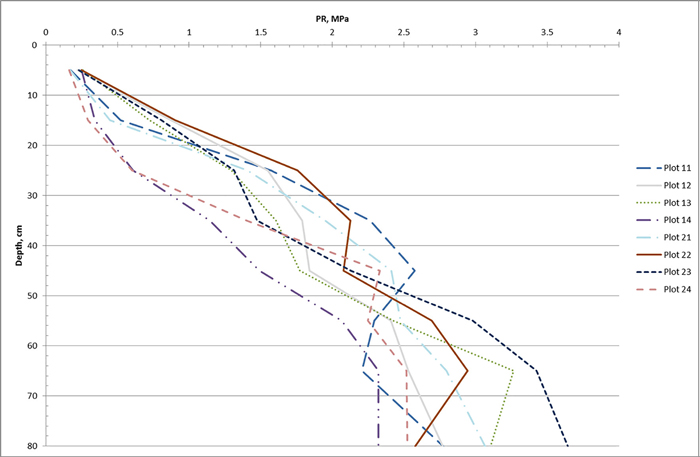
Fig. 3. Penetration resistance profiles of study plots before harvesting.
The relationships between the volumetric water content (at 0–10 cm mineral soil), penetration resistance before harvesting (average at the depth of 20 cm) and bulk density (at 0–10 cm in mineral soil) for the plots with 6 machine passes are presented in Fig. 4.
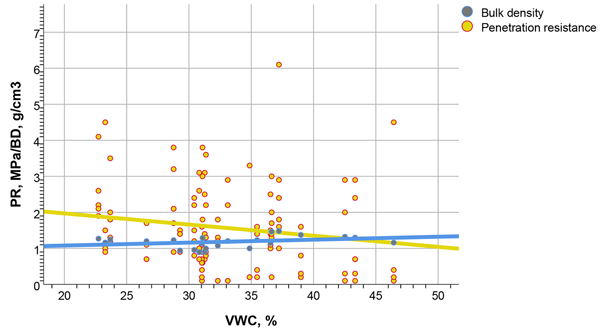
Fig. 4. Relationships between volumetric water content (VWC, %) at 0–10 cm depth in mineral soil, penetration resistance before harvesting (PR, MPa), average at the depth of 20 cm and bulk density (BD, g cm-3) at 0–10 cm depth in mineral soil.
3.2 Rut formation
The average rut depths after the machine passes and total overdriven mass of 185 tons are presented in Fig. 5.
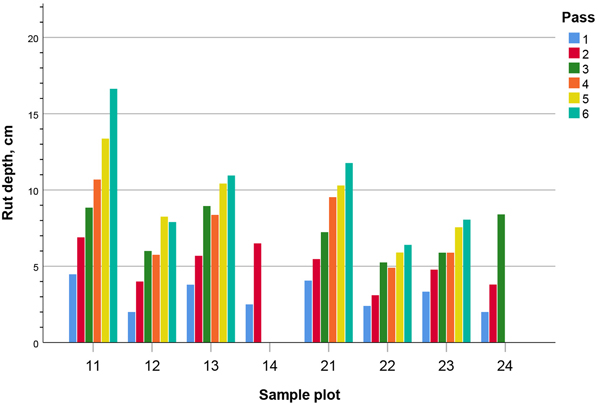
Fig. 5. The average rut depths of the study plots.
The Pearson correlations between rut depth and average site conditions after a harvester pass and three forwarder passes are presented in Table 2. The average rut depths were positively correlated with the VWC at a depth of 0–10 cm in mineral soil, as well as the thickness of organic layer, and the rut depth after the harvester (significant at the level of 0.01) and with the BD at a depth of 10–20 cm (significant at a level of 0.05). Average rut depths were negatively correlated (significant at the level of 0.01) with PR at both 0–20 cm and 5–40 cm depths.
| Table 2. Pearson correlation coefficients between rut depths (after one harvester pass and three forwarder passes) and soil properties calculated as averages for the test tracks. VWC = volumetric water content (%) 0–10/10–20 cm depth, BD = soil bulk density (g cm-3) 0–10/10–20 cm depth, PR = penetration resistance (MPa) 0–20/5–40 cm depth, Org. layer = depth of organic layer (cm), Stonin. = average rod penetration (cm), Volume = Stand volume before harvesting (m3 ha-1), Harv. rut = rut depth after harvester pass (cm), Rut = rut depth after three forwarder passes (cm). | ||||||||||||
| VWC 0–10 | VWC 10–20 | BD 0–10 | BD 10–20 | PR 0–20 | PR 5–40 | Org. layer | Stonin. | Volume | Harv. rut | Rut | ||
| VWC 0–10 | Pearson Correlation | 1 | .003 | .297** | .219* | –.294** | –.081 | .416** | .082 | .287** | .269** | .445** |
| Sig. (2-tailed) | .974 | .001 | .020 | .002 | .395 | .000 | .389 | .002 | .004 | .000 | ||
| VWC 10–20 | Pearson Correlation | 1 | –.115 | –.091 | –.132 | –.198* | .216* | –.018 | .094 | –.070 | –.049 | |
| Sig. (2-tailed) | .227 | .335 | .165 | .036 | .022 | .848 | .320 | .463 | .610 | |||
| BD 0–10 | Pearson Correlation | 1 | .246** | .009 | .202* | .542** | .130 | .259** | –.009 | .058 | ||
| Sig. (2-tailed) | .009 | .923 | .032 | .000 | .171 | .006 | .921 | .542 | ||||
| BD 10–20 | Pearson Correlation | 1 | –.049 | .070 | .641** | –.493** | .206* | .096 | .195* | |||
| Sig. (2-tailed) | .609 | .462 | .000 | .000 | .029 | .310 | .038 | |||||
| PR 0–20 | Pearson Correlation | 1 | .785** | –.110 | –.087 | –.075 | –.240* | –.296** | ||||
| Sig. (2-tailed) | .000 | .248 | .359 | .427 | .010 | .001 | ||||||
| PR 5–40 | Pearson Correlation | 1 | .050 | –.048 | .026 | –.310** | –.307** | |||||
| Sig. (2-tailed) | .598 | .614 | .785 | .001 | .001 | |||||||
| Org. layer | Pearson Correlation | 1 | .007 | .493** | .165 | .276** | ||||||
| Sig. (2-tailed) | .941 | .000 | .081 | .003 | ||||||||
| Stonin. | Pearson Correlation | 1 | .019 | .186* | .146 | |||||||
| Sig. (2-tailed) | .843 | .049 | .122 | |||||||||
| Volume | Pearson Correlation | 1 | .100 | .207* | ||||||||
| Sig. (2-tailed) | .293 | .027 | ||||||||||
| Harv. rut | Pearson Correlation | 1 | .787** | |||||||||
| Sig. (2-tailed) | .000 | |||||||||||
| Rut | Pearson Correlation | 1 | ||||||||||
| Sig. (2-tailed) | ||||||||||||
| ** = Correlation is significant at the 0.01 level (2-tailed). | ||||||||||||
| * = Correlation is significant at the 0.05 level (2-tailed). | ||||||||||||
There was no significant correlation between rut formation and VWC at 10–20 cm depth in mineral soil. The VWC at a depth of 0–10 cm was positively correlated with organic layer depth, BD at a depth of 0–10 cm (significant at the level of 0.01) and with BD at 10–20 cm (significant at the level of 0.05). VWC at 0–10 cm depth was negatively correlated with PR at a depth of 0–10 cm (significant at the level of 0.01), but not with PR at a depth of 5–40 cm.
VWC had a positive correlation with the depth of the organic layer (VWC at a depth of 0–10 cm at the level of 0.001, VWC at a depth of 10–20 cm at the level of 0.05). VWC at 0–10 cm had a positive correlation with the bulk density and a negative correlation (level 0.01) with PR at 0–20 cm. Stoniness (average steel rod penetration) had a negative correlation with BD at 10–20 cm depth (significant at the 0.01 level).
3.3 Rut depth models
We present five mixed-linear models predicting the logarithm of the average rut depth (cm) at a measurement point (Table 3). Due to cross-correlations most models include only one soil property. Every model includes the cumulative mass (CM) driven over the measurement point. In three models, soil properties (volumetric water content, penetration resistance or organic layer depth) are included. The last model includes the cumulative mass and rut depth after a harvester pass.
| Table 3. Mixed-linear models predicting the logarithm of the average rut depth (cm) in a measurement point. CM = Cumulative mass driven over measurement point (kg), VWC = Volumetric water content (%) at 0–10 cm depth in mineral soil, PR = Penetration resistance (MPa) at 5–40 cm depth, OL = organic layer depth (cm), Hr = harvester rut depth (cm), σ2plot = variance for the plot, σ2meas = variance for successive measurements, ρplot and ρmeas correlation coefficients for measurement points within plot and for successive measurements. AIC = Akaike´s Information Criterion. | ||||||||||
| Model Parameter | 1 Estimate (SE) | Sig. | 2 Estimate (SE) | Sig. | 3 Estimate (SE) | Sig. | 4 Estimate (SE) | Sig. | 5 Estimate (SE) | Sig. |
| Fixed | ||||||||||
| Intercept | 1.1785 (0.200) | 0.000 | 0.028 (0.337) | 0.935 | –0.168 (0.148) | 0.704 | 0.312 (0.483) | 0.522 | 0.313 (0.097) | 0.002 |
| CM | 0.0000084 (0.0000004) | 0.000 | 0.0000084 (0.000) | 0.000 | 0.0000084 (0.0000004) | 0.000 | 0.0000084 (0.0000004) | 0.000 | 0.0000065 (0.000) | 0.000 |
| PR | –0.375 (0.121) | 0.002 | –0.375 (0.120) | 0.002 | ||||||
| VWC | 0.018 (0.009) | 0.067 | ||||||||
| OL, cm | 0.079 (0.042) | 0.066 | 0.084 (0.043) | 0.059 | ||||||
| Hr | 0.190 (0.017) | 0.000 | ||||||||
| Random | ||||||||||
| σ2plot | 0.631 (0.105) | 0.000 | 0.647 (0.106) | 0.000 | 0.652 (0.105) | 0.000 | 0.610 (0.103) | 0.000 | 0.349 (0.054) | 0.000 |
| ρplot | 0.173 (0.126) | 0.170 | 0.035 (0.122) | 0.776 | 0.060 (0.121) | 0.619 | 0.157 (0.127) | 0.216 | 0.138 (0.114) | 0.223 |
| σ2meas | 0.319 (0.043) | 0.000 | 0.320 (0.043) | 0.000 | 0.317 (0.042) | 0.000 | 0.319 (0.043) | 0.000 | 0.177 (0.017) | 0.000 |
| ρmeas | 0.531 (0.067) | 0.000 | 0.531 (0.067) | 0.000 | 0.526 (0.121) | 0.000 | 0.529 (0.067) | 0.000 | 0.213 (0.083) | 0.010 |
| AIC | 1255.8 | 1266.1 | 1263.0 | 1256.5 | 911.8 | |||||
Fig. 6 presents the influence of the water content on rut formation estimated with model 2 of Table 3. In Fig. 7 the total allowed overpassed mass keeping the final rut depth below 10 cm as a function of the harvester rut depth is predicted with model 5 of Table 3.
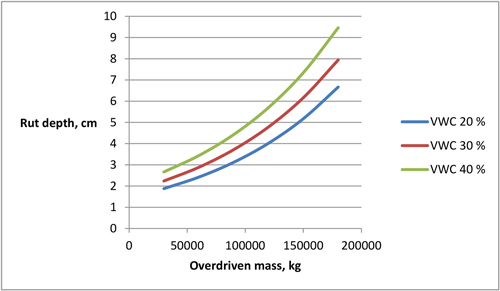
Fig. 6. The influence of volumetric water content (%) at 0–10 cm depth in mineral soil on rut formation estimated with model 2 in Table 3.
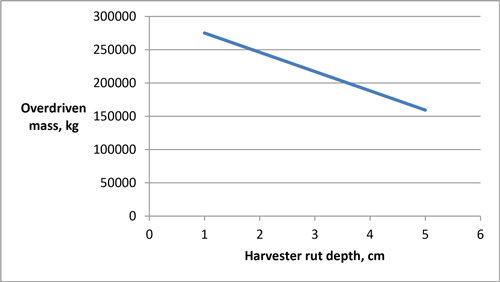
Fig. 7. The allowed total overpassed mass keeping final rut depth under 10 cm as a function of harvester rut depth (model 5 of Table 3).
We also studied, how the PR (0–10 cm, 5–20 cm and 5–40 cm) acted in the model. The differences in the model were small as AIC as criteria, including the cumulative mass and penetration resistances at different depths. PR 5–40 cm was the best alternative, 5–20 cm the second and 0–20 cm was the weakest.
Silty sand was the main soil type on experimental plots, but on some subplots the soil type was sandy silt. The volumetric water content (0–10 cm in mineral soil) varied between soil types (29.0% with sandy silt and 34.0% with silty sand). A one-way ANCOVA was conducted to determine a statistically significant difference between soil types and the rut depth after four machine passes controlling for the volumetric water content. There was a significant effect of the soil type on the rut depth after controlling for the volumetric water content (F1, 110) = 4.16, p = 0.044. The estimate for adjusted rut depth mean for sandy silt was 9.84 cm and for silty sand it was 7.15 cm for a VWC of 33%.
We also studied whether the harvester equipment had an influence on the harvester rut formation. On strip road 1 (with tracks on the rear) the average rut depth was 3.3 cm (sample plot averages of 2.0–4.5 cm) and on strip road 2 (with no tracks) it was 3.1 cm (sample plot averages of 2.0–4.1 cm). The average volumetric water content on strip road 1 was 35.5% and it was 31.3% on strip road 2. A one-way ANCOVA was conducted to determine a statistically significant difference between harvester equipment (no tracks/tracks on the rear) on the harvester rut depth controlling for the volumetric water content at a depth of 0–10 cm in mineral soil. There was no significant effect of the harvester equipment on the harvester rut depth after controlling for the volumetric water content (F1, 121) = 0.004, p = 0.949.
3.4 Soil compaction
The penetration resistance (PR 10–40 cm) with increasing number of machine passes is presented in Fig. 8 and the PR averages at the depths of 20, 30 and 40 cm are shown in Fig. 9. The results are from 6 subplots (1 subplot per sample plot) for which we measured the penetration resistance after each pass. Subplots from sample plots 14 and 24, where we had only 2 or 3 machine passes, are not included. The PR measurements are adjusted for rut depths at each measurement point to compare the same soil layers.
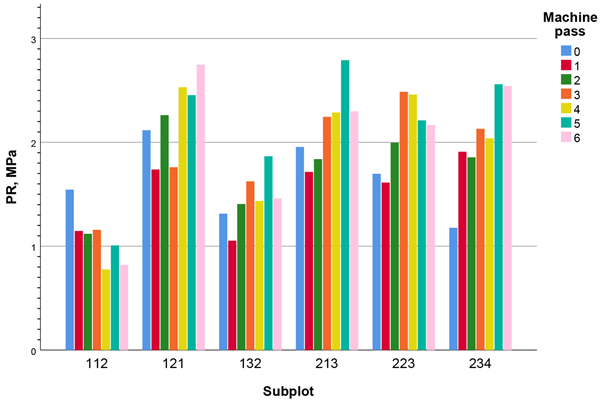
Fig. 8. Penetration resistance (PR, MPa) at the depth of 10–40 cm, after consecutive machine passes. Measurements are adjusted for rut depths.
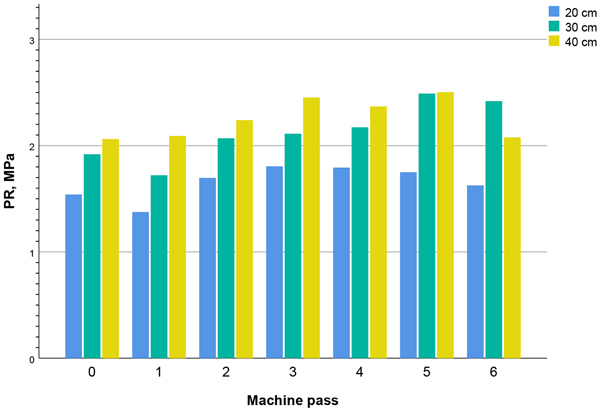
Fig. 9. Average penetration resistance (PR, MPa) of 6 subplots after consecutive machine passes at soil depths of 20, 30 and 40 cm. Measurements are adjusted for rut depths.
The average PR profiles before and after harvesting are presented in Fig. 10. Sample plots 14 and 24 with only 2 or 3 machine passes are not included in the results. Relationships between VWC 0–10 cm, the rut depth after 6 machine passes and the penetration resistance (averages at a depth of 30 cm, adjusted for rut depth) are presented in Fig. 11.
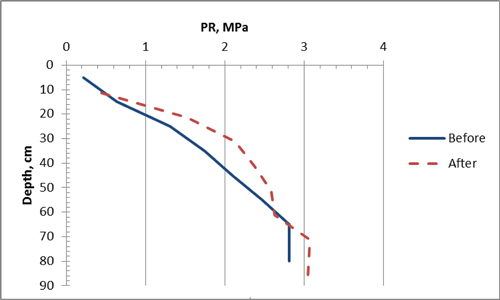
Fig. 10. Penetration resistance profiles before and after harvesting. Measurements after harvesting are adjusted for average rut depth.
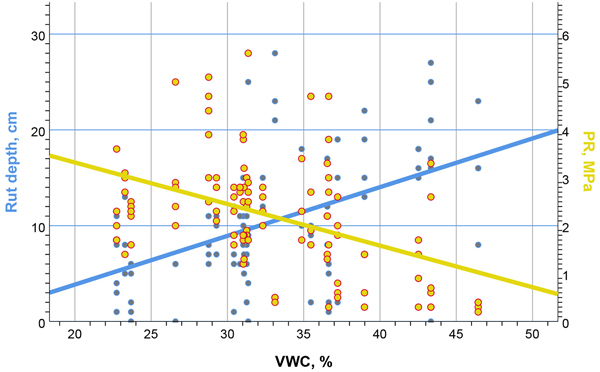
Fig. 11. Relationships between volumetric water content VWC (%) at 0–10 cm depth in mineral soil before harvesting, rut depth and penetration resistance PR (MPa) at the depth of 30 cm (adjusted for rut depth) after 6 machine passes.
3.5 Soil compaction models
We present two versions of two models predicting the logarithm of the average penetration resistance (PR, MPa) at the depth of 10–40 cm at a measurement point, namely with and without random effect of plot (Table 4). The plot mainly determines the soil properties and plot effect as the random tends to decrease the significance of permanent soil properties as predictors. The first pair of models (models 1 and 2, with and without random effect of plot) includes the cumulative mass (CM) driven over the measurement point and the average BD and VWC at the depth of 10–20 cm in mineral soil. The second model pair (models 3 and 4) includes the same variables as the first pair, but also the rut depth is included.
| Table 4. Mixed-linear models predicting the logarithm of the average PR (MPa) at the depth of 10–40 cm in a measurement point. CM = Cumulative mass driven over measurement point (kg), VWC = Volumetric water content (%) at 10–20 cm depth in mineral soil, BD = soil bulk density (g cm–3) at 10–20 cm depth in mineral soil, Rdepth = rut depth (cm), σ2p = variance for the plot, σ2pm = variance for the measurement point, σ2meas and ρmeas variance and correlation coefficients for successive measurements. AIC = Akaike´s Information Criterion. | ||||||||
| Model Parameter | 1 Estimate (SE) | Sig. | 2 Estimate (SE) | Sig. | 3 Estimate (SE) | Sig. | 4 Estimate (SE) | Sig. |
| Fixed | ||||||||
| Intercept | 3.601 (0.879) | 0.022 | 3.539 (0.482) | 0.000 | 3.094 (0.629) | 0.012 | 2.997 (0.392) | 0.000 |
| CM | 0.00000131 (0.0000004) | 0.002 | 0.00000130 (0.0000004) | 0.002 | 0.00000291 (0.0000006) | 0.000 | 0.00000312 (0.0000006) | 0.0000 |
| VWC | –0.042 (0.016) | 0.075 | –0.042 (0.009) | 0.000 | –0.036 (0.012) | 0.047 | –0.035 (0.007) | 0.000 |
| BD | –1.324 (0.436) | 0.050 | –1.288 (0.242) | 0.000 | –1,064 (0.313) | 0.034 | –1.012 (0.197) | 0.000 |
| Rdepth | –0.033 (0.008) | 0.000 | –0.038 (0.008) | 0.000 | ||||
| Random | ||||||||
| σ2p | 0.025 (0.024) | 0.302 | 0.011 (0.012) | 0.369 | ||||
| σ2pm | 0.006 (0.008) | 0.490 | 0.021 (0.012) | 0.087 | 0.000 (0.007) | 0.958 | 0.006 (0.008) | 0.482 |
| σ2meas | 0.118 (0.014) | 0.000 | 0.119 (0.014) | 0.000 | 0.115 (0.013) | 0.000 | 0.116 (0.013) | 0.000 |
| ρmeas | 0.096 (0.0099) | 0.333 | 0.109 (0.101) | 0.278 | 0.080 (0.096) | 0.406 | 0.086 (0.097) | 0.371 |
| AIC | 205.6 | 210.8 | 199.2 | 200.6 | ||||
4 Discussion
4.1 Experimental conditions
The study was an extension of a study series, where we tried to determine factors affecting rut formation on weather sensitive soils (Toivio et al. 2017; Sirén et al. 2019). Because earlier studies covered fine-grained soils, we wanted to examine mid-grained soils and their response to various conditions, especially water content. The experimental layout, with sample plots of 20 meters divided into 5-meter subplots with six measurement points, was very similar to the layout used by Toivio et al. (2017). In our case, the soil compaction after each machine pass was measured on one subplot per sample plot, whereas Toivio et al. (2017) measured it on all sample plots. As in earlies studies, the effect of logging residue was excluded by keeping the test tracks clear of residues. Measurement points with superficial stones or stumps just at the measurement point (20% of observations) were excluded from the rut analysis to examine the effect of actual bearing capacity of soil. This means, that the rut formation deviates from actual results of practical harvesting operations. Rut measurements were carried out with construction laser device, and the deepest point in rut cross section was measured. To ensure consecutive measurements were conducted at same locations, the measurement points were marked on ground with a spray paint. Rut depths can also be measured with photogrammetric estimation (Pierzchala et al. 2016; Marra et al. 2018). With these new methods you precisely quantify the geometry of soil disturbance (Pierczhala et al. 2016).
The conditions of the experimental site suited our needs well. The soil type on the sample plots consisted of mainly silty sand and some plots were on sandy silt (EN ISO 2002, 2004). Due to the late spring and terrain profile with a slight slope we had adequate variation in the soil water content. The average penetration resistance at a depth of 20 cm was 1.48 MPa. The smallest average PR values were from sample plots 14 and 24, but these were not included in the compaction results due to the limited number of machine passes.
Modern, eight-wheeled forest machinery was used in the experiment. The machine track and chain equipment are commonly used in practical operations. On strip road 2, a harvester drove without tracks, which is often done in good bearing conditions, as opposed to strip road 1, where tracks were used in the rear. The forwarder had chains on the front and tracks at the rear, which is a typical set up for an 8-wheeled forwarder on mineral soils. In difficult bearing conditions, forwarders often have tracks both front and rear.
4.2 Rut formation
Rut formation in the sample plots with 6 machine passes was the highest in sample plots 11 and 21, which were located on a terrain depression adjacent to a hill with a volumetric water content approaching 40%. Sample plot 21 also had the highest average organic layer depth, which was 13 cm. In previous studies, the intensity of the machine traffic (number of passes) was a main controlling factor of the rut depth (e.g. Jakobsen and Greacen 1985; McNabb et al. 2001; Nugent et al. 2003; Bygden et al. 2004; Eliasson 2005; Eliasson and Wästerlund 2007). The same was found in our study.
On fine-grained soils, the rut formation is highly affected by the water content (Gerasimov and Katarov 2010; Toivio et al. 2017; Sirén et al. 2019), and in wet conditions rut formation under similar vehicular loading is much higher than in this study. In our study average rut depths after four machine passes were positively correlated with the volumetric water content at a depth of 0–10 cm in mineral soil and the thickness of the organic layer (Table 2).
The accepted levels of rutting and soil damage are set by the forest legislation (Forest Act 1996; Government decree 2013) and forestry recommendations (Hyvän metsänhoidon suositukset 2006). In mineral soils, the share of ruts deeper than 10 cm should cover less 5% of strip roads. In our study the rut depths mostly remained under 10 cm after four machine passes, which is quite typical traffic intensity on secondary strip roads. When considering practical harvesting operations, this is a good result, as logging residues were removed after cutting from test plots and the notable covering effect of logging residue mat (Wronski et al. 1990; McDonald and Seixas 1997; Han et al. 2006; Kärhä et al. 2010; Sirén et al. 2013a; Labelle et al. 2015) was lost. For example, for Norway spruce thinnings, a residue mat of 15–20 kg m–2 to cover the soil and roots is achievable (Sirén et al. 2013a). Poltorak et al. (2018) found that mixed-wood brush mats of 15 and 20 kg m–2 provide significant soil protection in respect to soil displacement and rutting during mechanized harvesting operations.
Toivio et al. (2017) found that the first three passes caused the greatest compaction and rutting, the first pass having the strongest impact. After the first pass 34–55% of the rut depth was formed and after the third pass over 70% of the total mean rut depth was formed. Sirén et al. (2019) found that 75% of the final rut formation after 3 or 4 forwarder passes was reached after the first forwarder pass. Both these studies were on fine-grained soils and the logging residue was removed from the test tracks. The results of our study in relation to machine pass impacts were close to those of Toivio et al. (2017). As in earlier studies (Sirén et al. 2013a, 2013b, 2019), there was a strong correlation between the harvester rut depth and the forwarder rut depth.
4.3 Rut-depth models
One of our goals in the study was to present models for different purposes. Some of the models need penetrometer measurements, which are not widely used as an input in practical harvesting planning. The soil water content is a key factor in modern harvesting planning tools (Bergkvist et al. 2014; Friberg 2014), and it is involved in one of our five models. Two models included the depth of the organic layer, which also reflects the water content, and is easy to measure. All models included the total overpassed mass, which was already earlier found as the main controlling factor for rut depth in many studies (Nugent et al. 2003; Eliasson and Wästerlund 2007). The model with the best fit includes the harvester rut depth and total overpassed mass, which have been found to be good predictors of rut depth in earlier studies (Sirén et al. 2013a, 2013b, 2019).
The model including the harvester rut depth can be used to estimate the maximum cumulative mass that still keeps the rut depth below the commonly accepted 10 cm limit. In our material on mid-grained soil, the limit for the total overpassed mass with a 2 cm harvester rut is close 250 000 kg, whereas on fine-grained soil it was 180 000 kg (Sirén et al. 2019).
4.4 Soil compaction
It is assumed that the effects of vehicular traffic on soil compaction are most pronounced on clayey or loamy textures (Fisher et al. 2000). Therefore, relatively few studies have focused on the compaction of sandy soils (Panayiotopolus 1989; Ampoorter et al. 2007). Jakobsen and Greacen (1985) studied compaction of sandy forest soils by forwarding in wet conditions. PR values after heavy traffic increased 2–3 fold in the previously undisturbed soil, but decreased in old tracks with high initial PR values. Panayiotopolus (1989) states in a review study, that at least for narrowly graded sands, compaction under any given stress is almost independent of moisture content except near air-dryness and near saturation where it is greater. Labelle and Jaeger (2011) studied soil compaction by CTL-harvesting on silty sand with gravel and sandy silt. The impact on soil was quantified using both absolute and relative bulk density (RDB) methods. In the relative method, field measured bulk density is compared with maximum bulk density. RBD of 80% is considered to be the threshold limiting tree growth (Zhao et al. 2010). Due to a high percentage of fine particles, the sandy silt was more susceptible to soil disturbance than the silty sand with gravel (Labelle and Jaeger 2011).
In our study PR was used to describe soil compaction. The PR of a soil, when measured and interpreted correctly, is an easily obtained and useful measure of the degree of soil compaction (Bennie and Burger 1988). The relationships between the soil compaction levels and PR have been described in many studies (e.g. Grunwald et al. 2001; Ferrero et al. 2005).
Penetration resistances were calculated for different soil depths. Averages of 0–20 cm and 5–40 cm were used in the rut depth modelling, as we also did in our earlier rut prediction models (Sirén et al. 2019). In the soil compaction estimation, mainly average values at depths of 30 cm and 10–40 cm were used. One reason for the use of different depths for rut and PR modelling was to keep a sufficient number of observations after adjusting the PR measurements for the rut depth.
Adjusting PR values for the rut depth can be difficult, especially in the case of deep ruts and wet soil. Loose soil in the ruts often causes inaccuracy in measurements. Part of the soil in the ruts is often pushed aside to form a bulge and is therefore not involved in compaction assessment. In the literature, results where PR values are not adjusted for rut depth can also be found (Han et al. 2006). This may also be a proper solution, if the same track is used in the future and soil compaction at different absolute depths is of interest.
Powers et al. (2005) note, that soils with an initial bulk density > 1.4 g cm–3 are rather resistant to compaction. In our test site the average bulk density was 1.17 g cm–3 at a depth of 0–10 cm in mineral soil, so we were in the risk zone for compaction. An increase in the soil water content implies a reduction in the frictional forces between the soil particles, and hence a reduction in the bearing capacity of the soil (McNabb et al. 2001; McDonald and Seixas 1997; Han et al. 2006) and a higher susceptibility to compaction.
In our study PR mainly increased with machine passes. The highest changes in the average PR values were at depths of 20–40 from the soil surface (Fig. 10). When we compared the average resistances after machine passes at different soil depths, we notice that after five machine passes the PR levels started to stabilize. Jansson and Johansson (1998) found, that the maximum compaction (42% relative to the control) occurred at a depth of 10 cm after eight passes with a tracked machine, whereas with a wheeled machine, the highest compaction (37% relative to the control) occurred at a depth of 15 cm after six passes. Ampoorter et al. (2007) found, that on sandy soil already one machine pass is sufficient to induce a strong increase in the bulk density and penetration resistance. However, it is only after several passes that soil characteristics, especially the penetration resistance, are altered to the extent that they exceed the limits for optimal root growth, potentially resulting in reduced growth and productivity.
On fine- to medium-textured soils, Brais and Camire (1998) determined that half of the effect of skidding cycles on the soil bulk density at 0–10 and 10–20 cm depths and soil strength at a depth of 10 cm occurred in the first two cycles. On coarse soils the compaction develops more gradually and half of the effect on bulk density can be found after three machine passes, as it takes several passes to have a similar impact on the soil strength.
Toivio et al. (2017) studied the impact of harvesting on the physical properties of soil on fine-grained soils. Penetration resistance and soil compaction were clearly lower in moist soils than in dry conditions, where the changes in the physical soil conditions appeared to be greater. The first three passes caused the greatest compaction on the top soil of about 30 cm, whereas further passes caused compaction at greater depths.
4.5 Soil compaction models
Material for modelling PR in our study was quite limited. PR measurements before harvesting and after each machine pass were carried out in six subplots each having six measurement points. Adjusting the PR measurements to the rut depths as well as the variation in PR measurement points cause challenges. Rut formation also affects PR measurement and results. When the soil is wet, in the surface of the rut there is often a cover of loose soil. This effect can be seen in especially in PR results of subplot 112 (Fig. 8).
The first model pair in Table 4 includes the total mass driven over the measurement point, BD and VWC at the depth of 10–20 cm in mineral soil. Model 1 includes the random effect of the plot and model 2 is without the plot effect. In the second model pair the rut depth is included. The model with the best fit (model 3, Table 4) includes the total mass driven over the measurement point, BD and VWC at the depth of 10–20 cm in mineral soil and rut depth. The random effect of the subplot is included in the model.
Increase both in BD and VWC decrease PR, which increases with total overdriven mass. According to the model 2 in Table 4, if BD is 1.4 g cm–3, calculated PR values with 25, 30 and 35% VWC values after total overdriven mass of 90 000 kg are 2.3, 1.8 and 1.5 MPa and after 180 000 kg 2.5, 2.1 and 1.7 Mpa. With BD of 1.2 g cm–3 the values after 90 000 kg are 2.9, 2.4 and 1.9 and after 180 000 kg 3.3, 2.7 and 2.2 MPa, respectively.
5 Conclusions
The number of machine passes and volumetric water content in the surface layer of mineral soil as well as the depth of the organic layer were the controlling factors for rut formation on mid-grained soil. Rut formation and the influence of the water content were smaller than in earlier trials on fine-grained soils (Toivio et al. 2017; Sirén et al. 2019). On mid-grained soils the rut formation mainly remains below the 10 cm limit, even in the case of no residue cover, with typical secondary strip road trafficking intensity.
The soil types of our test tracks were silty sand and sandy silt. There was a significant effect of the soil type on the rut depth after controlling for the volumetric water content. Estimates for the adjusted rut depth means for sandy silt were 10 cm and for silty sand 7 cm for a VWC of 33%. In test drives, the harvester was driven with and without tracks on the rear bogie. There was no significant effect of the harvester set up on the harvester rut depth after controlling for the volumetric water content.
As in previous studies (Sirén et al. 2013a, 2019), the harvester rut depth was a good predictor of the forwarder rut formation. The best model for rut formation included the harvester rut depth and total overpassed mass. If autonomous measurements of harvester rut depth can become operational, this data stream could be directly used in forwarder operator tutoring (Väätäinen et al. 2012), validation of trafficability classifications and in automated harvesting quality control. Changes in the penetration resistance were highest at depths of 20–40 cm. Increase in BD and VWC decreased PR, which increased with total overdriven mass. After four-five machine passes the PR levels started to stabilize.
Acknowledgements
The authors wish to thank Finsilva Oyj for giving the test site for the study and Metsä Forest for helping in practical study arrangements. We also wish to thank Ponsse Oyj and Visuveden Motopalvelu Oy for providing the machinery and the machine operators for the test drives.
The study was a part of EFFORTE (Efficient and gentle forest operations) project. EFFORTE has received funding from the Bio Based Industries Joint Undertaking under the European Union´s Horizon 2020 research and innovation programme under grant agreement No 720712.
References
Ågren A.M., Lidberg W., Strömgren M., Ogilvie J., Arp P.A. (2014). Evaluating digital terrain indeces for soil wetness mapping – a Swedish case study. Hydrology and Earth System Sciences 18: 3623–3634. https://doi.org/10.5194/hess-18-3623-2014.
Ala-Ilomäki J., Lamminen S., Sirén M., Väätäinen K., Asikainen A. (2012). Using harvester CAN-bus data for mobility mapping. In: Special issue. Abstracts for international conferences organized by LSFRI Silava in cooperation with SNS and IUFRO. Mezzinatne 25(58): 85–87.
Ampoorter E., Goris R., Cornelis W., Verheyen K. (2007). Impact of mechanized logging on compaction status on sandy forest soils. Forest Ecology and Management 241(1–3): 162–174. https://doi.org/10.1016/j.foreco.2007.01.019.
Bennie A.T.P., Burger R. du T. (1988). Penetration resistance of fine sandy apedal soils as affected by relative bulk density, water content and texture. South African Journal of Plant and Soil 5(1): 5–10. https://doi.org/10.1080/02571862.1988.10634239.
Bergkvist I., Friberg G., Mohtashami S., Sonesson J. (2014). STIG-projektet 2010–2014. [The STIG Project 2010–2014]. Skogforsk, Arbetsrapport nr. 818. 18 p. [In Swedish with English summary]. https://www.skogforsk.se/kunskap/kunskapsbanken/2014/stig-projektet-20102014/.
Beven K., Kirkby M.J. (1979). A physically based, variable contributing area model of basin hydrology. Hydrological Sciences Journal 24(1): 43–69. https://doi.org/10.1080/02626667909491834.
Brais S., Camire C. (1998). Soil compaction induced by careful logging in the claybelt region of northwestern Quebeck (Canada). Canadian Journal of Soil Science 78(1): 197–206. https://doi.org/10.4141/S97-032.
Bygden G., Eliasson L., Wasterlund I. (2004). Rut depth, soil compaction and rolling resistance when using bogie tracks. J. Terramech. 40(3): 179–190. https://doi.org/10.1016/j.jterra.2003.12.001.
Cambi M., Certini G., Neri F., Marchi E. (2015). The impact of heavy traffic on forest soils: a review. Forest Ecology and Management 338: 124–138. https://doi.org/10.1016/j.foreco.2014.11.022.
Campbell D., White B., Arp P. (2013). Modeling and mapping soil resistance to penetration and rutting using LiDAR-derived digital elevation data. Journal of Soil and Water Conservation 68(6): 460–473. https://doi.org/10.2489/jswc.68.6.460.
Elbanna E., Witney B. (1987). Cone penetration resistance equation as a function of the clay ratio, soil moisture content and specific weight. Journal of Terramechanics 24(1): 41–56. https://doi.org/10.1016/0022-4898(87)90058-9.
Eliasson L. (2005). Effects of forwarder tyre pressure on rut formation and soil compaction. Silva Fennica 39(4): 549–557. https://doi.org/10.14214/sf.366.
Eliasson L., Wästerlund I. (2007). Effects of slash inforcement of strip roads on rutting and soil compaction on a moist fine-grained soil. Forest Ecology and Management 252 (1–3): 118–123. https://doi.org/10.1016/j.foreco.2007.06.037.
EN ISO 14688-1:2002. Geotechnical investigation and testing. Identification and classification of soil. Part 1: identification and description (ISO 14688-1:2002). 14 p. https://www.iso.org/standard/25260.html.
EN ISO 14688-2:2004. Geotechnical investigation and testing. Identification and classification of soil. Part 2: principles for a classification (ISO 14688-2:2004). 15 p. https://www.iso.org/standard/34082.html.
Ferrero A., Usowicz B., Lipiec J. (2005). Effects of tractor traffic on spatial variability of soil strength and water content in grass covered and cultivated sloping vineyard. Soil and Tillage Research 84(2): 127–138. https://doi.org/10.1016/j.still.2004.10.003.
Fisher R.F., Binkley D. (2000). Ecology and management of forest soils. Wiley & Sons, New York. 489 p.
Forest Act 1093/1996. 16 p. https://www.finlex.fi/en/laki/kaannokset/1996/en19961093_20140567.pdf.
Friberg G. (2014). En analysmetod för att optimera skotning mot minimerad körsträcka och minimerad påverkan på mark och vatten. [A method to optimize forwarding towards minimized driving distance and minimized effect on soil and water]. Examensarbete Nr 138, SLU, Institutionen för skogens produkter, Uppsala. 52 p. [In Swedish with English abstract]. https://stud.epsilon.slu.se/6956/1/Friberg_G_20140630.pdf.
Friberg G., Bergkvist I. (2016). Så påverkar arbetsrutiner och markfuktighetskartor körskador i skogsbruket. [How operational procedures and depth-to-water maps can reduce damage on soil and water and rutting in the Swedish forestry]. Skogforsk, Arbetsrapport nr. 904. 30 p. [In Swedish with English summary]. https://www.skogforsk.se/contentassets/f70c51e0a98047779c7db9659486d309/sa-paverkar-arbetsrutiner-och-markfuktighetskartor-korskador-i-skogsbruket-arbetsrapport-904-2016.pdf.
Froehlich H., Aulerich D., Curtis R. (1981). Designing skid trail system to reduce soil impacts from tractive logging machines. Forest Research Laboratory, Oregon State University, Research Paper 44. 15 p.
Gerasimov Y., Katarov V. (2010). Effect of bogie track and slash reinforcement on sinkage and soil compaction in soft terrains. Croatian Journal of Forest Engineering 31(1): 35–45. https://hrcak.srce.hr/56926.
Grunwald, S., Lowery, B., Rooney, D.J., McSweeney K. (2001).Profile cone penetrometer data used to distinguish between soil materials. Soil and Tillage Research 62(1–2): 27–40. https://doi.org/10.1016/S0167-1987(01)00201-X.
Han H.S., Page-Dumroese D.S., Han S.K., Tirocke J. (2006). Effect of slash, machine passes, and soil moisture on penetration resistance in a cut-to-length harvesting. International Journal of Forest Engineering 17(2): 11–24. https://doi.org/10.1080/14942119.2006.10702532.
Hauglin M., Hansen E.H., Næsset E., Busterud B.E., Gjevestad J.G.O., Gobakken T. (2017). Accurate single-tree positions from a harvester: a test of two global satellite-based positioning systems, Scandinavian Journal of Forest Research 32(8): 774–781. https://doi.org/10.1080/02827581.2017.1296967.
Heinonen J. (1994). Koealojen puu- ja puustotunnusten laskentaohjelma KPL. Käyttöohje. [Calculation programme for sample plot tree and stand data. Manual]. Finnish Forest Research Institute (Metla), Research Papers 504. 80 p. [In Finnish]. http://urn.fi/URN:ISBN:951-40-1369-7.
Hillel D. (1998). Environmental soil physics: fundamentals, applications, and environmental considerations. Academic Press, Waltham. 771 p.
Hyvän metsänhoidon suositukset (2006). [Forestry recommendations]. Metsätalouden kehittämiskeskus Tapio. 100 p. [In Finnish].
Ilmatieteen laitoksen sääasemien arkisto. [Archive of Finnish Meteorological Institute]. [In Finnish]. https://suja.kapsi.fi/fmi-tilastot.php.
Jakobsen B.F., Greacen E.L. (1985). Compaction of sandy forest soils by forwarder operations. Soil and Tillage Research 5(1): 55–70. https://doi.org/10.1016/S0167-1987(85)80016-7.
Jansson K.J., Johansson J. (1998). Soil changes after traffic with a tracked and a wheeled forest machine: a case study on a silt loam in Sweden. Forestry 71(1): 57–66. https://doi.org/10.1093/forestry/71.1.57.
Jones M.F., Arp P.A. (2017). Relating cone penetration and rutting resistance to variations in forest soil properties and daily moisture fluctuations. Open Journal of Soil Science 7(7): 149–171. https://doi.org/10.4236/ojss.2017.77012.
Kärhä K., Poikela A., Keskinen S. (2010). Korpikuusikon korjuu sulan maan aikana. [Harvesting of peatland Norway spruce stand in unfrozen soil]. Metsätehon tuloskalvosarja 5/2010. 46 p. [In Finnish]. http://metsate1.asiakkaat.sigmatic.fi/wp-content/uploads/2015/02/Tuloskalvosarja_2010_05_Korpikuusikon_harvennus_kk.pdf.
Laasasenaho J. (1982). Taper curve and volume functions for pine, spruce and birch. Communicationes Instituti Forestalis Fenniae 108. 74 p. http://urn.fi/URN:ISBN:951-40-0589-9.
Labelle E.R., Jaeger D. (2011). Soil compaction caused by cut-to-length forest operations and possible short-term natural rehabilitation of soil density. Science Society of America Journal 75(6): 2314–2329. https://doi.org/10.2136/sssaj2011.0109.
Labelle E.R., Jaeger D., Poltorak B.J. (2015). Assessing the ability of hardwood and softwood brush mats to distribute applied loads. Croatian Journal of Forest Engineering 36(2): 227–242. https://hrcak.srce.hr/151784.
Lindroos O., Ringdahl O., Hera P.L., Hohnloser P., Hellström T. (2015). Estimating the position of the harvester head – a key step towards the precision forestry of the future? Croatian Journal of Forest Engineering 36(2): 147–164. https://hrcak.srce.hr/151776.
Luoma V. (2017). Staattisen maastomallin käyttökelpoisuus maastomittausten valossa. [Feasibility of static terrain model]. MEOLO/ Asiantuntijaryhmän kokous. 17.2.2017. University of Helsinki. [In Finnish].
Marra E., Cambi M., Fernandez-Lacruz R., Giannetti F., Marchi E., Nordfjell T. (2018). Photogrammetric estimation of wheel rut dimensions and soil compaction after increasing numbers of forwarder passes. Scandinavian Journal of Forest Research 33(6): 613–620. https://doi.org/10.1080/02827581.2018.1427789.
McDonald T.P., Seixas F. (1997). Effect of slash on forwarder soil compaction. International Journal of Forest Engineering 8(2): 15–26. https://www.tandfonline.com/doi/abs/10.1080/08435243.1997.10702700.
McNabb D., Startsev A., Nguyen H. (2001). Soil wetness and traffic level effects on bulk density and air-filled porosity of compacted boreal forest soils. Science Society of America Journal 65(4): 1238–1247. https://doi.org/10.2136/sssaj2001.6541238x.
Mohtashami S., Eliasson L., Jansson G., Sonesson J. (2017). Influence of soil type, cartographic depth-to-water, road reinforcement and traffic intensity on rut formation in logging operations: a survey study in Sweden. Silva Fennica 51(5) article 2018. https://doi.org/10.14214/sf.2018.
Murphy P.N.C., Ogilvie J., Connor K., Arp P.A. (2007). Mapping wetlands: a comparison of two different approaches for New Brunswick, Canada. Wetlands 27(4): 846–854. https://doi.org/10.1672/0277-5212(2007)27[846:MWACOT]2.0.CO;2.
Murphy P.N.C., Ogilvie J., Arp P. (2009). Topographic modelling of soil moisture conditions: a comparison and verification of two models. European Journal of Soil Science 60(1): 94–109. https://doi.org/10.1111/j.1365-2389.2008.01094.x.
Murphy P.N.C., Ogilvie J., Meng F., White B., Bhatti J.S., Arp P.A. (2011). Modelling and mapping topographic variations in forest soils at high resolution: a case study. Ecological Modelling 222(14): 2314–2332. https://doi.org/10.1016/j.ecolmodel.2011.01.003.
Niemi M.T., Vastaranta M., Vauhkonen J., Melkas T., Holopainen M. (2017). Airborne LiDAR-derived elevation data in terrain trafficability mapping. Scandinavian Journal of Forest Research 32(8): 762–773. https://doi.org/10.1080/02827581.2017.1296181.
Nugent C., Kanali C., Owende P.M.O., Nieuwenhuis M., Ward S. (2003). Characteristic site disturbance due to harvesting and extraction machinery traffic on sensitive forest sites with peat soils. Forest Ecology and Management 180(1–3): 85–98. https://doi.org/10.1016/S0378-1127(02)00628-X.
Ojala T., Pietikäinen M., Mäenpää T. (2002). Multiresolution gray-scale and rotation invariant texture classification with local binary patterns. IEEE Transactions on Pattern Analysis and Machine Intelligence 24(7): 971–987. https://doi.org/10.1109/TPAMI.2002.1017623.
Panayiotopoulos K.P. (1989). Packing of sands – a review. Soil and Tillage Research 13(2): 101–121. https://doi.org/10.1016/0167-1987(89)90085-8.
Peuhkurinen J. (2017). Staattinen maastomalli – päivitetyn version ominaisuudet ja implementointi käytäntöön. [Static terrain model – characteristics and implementation]. MEOLO/ Asiantuntijaryhmän kokous 17.2.2017. Arbonaut. [In Finnish].
Pierzchała M., Talbot B., Astrup R. (2016). Measuring wheel ruts with close-range photogrammetry. Forestry 89(4): 383–391. https://doi.org/10.1093/forestry/cpw009.
Poltorak B.J., Labelle E.R., Jaeger D. (2018). Soil displacement during ground-based mechanized forest operations using mixed-wood brush mats. Soil and Tillage Research 179: 96–104. https://doi.org/10.1016/j.still.2018.02.005.
Powers R.F., Scott D.A., Sanchez F.G., Voldseth R.A., Page-Dumroese D., Elioff J.D., Stone D.M. (2005). The North American long-term soil productivity experiment: findings from the first decade of research. Forest Ecology and Management 220(1–3): 31–50. https://doi.org/10.1016/j.foreco.2005.08.003.
Räsänen T., Hämäläinen J., Rajala M., Ritala R. (2017). Metsävaratiedon hyödyntäminen puuhuollossa. [Utization of forest resource data in wood procurement]. Forest Big Data -hankkeen osaraportti. Metsätehon raportti 245. 40 p. [In Finnish with English summary]. http://www.metsateho.fi/wp-content/uploads/Raportti_245_Metsavaratiedon_hyodyntaminen_puuhuollossa.pdf.
Salmi M., Räsänen T., Hämäläinen J. (2013). Kosteusindeksi puunkorjuun olosuhteiden ennakoinnisssa. [The use of topographic wetness index in prediction of harvesting conditions]. Metsätehon raportti 229. 32 p. [In Finnish]. http://www.metsateho.fi/kosteusindeksi-puunkorjuun-olosuhteiden-ennakoinnissa/.
Salmivaara A., Launiainen S., Ala-Ilomäki J., Kulju S., Laurén A., Sirén M., Tuominen S., Finér L., Uusitalo J., Nevalainen P., Pahikkala T., Heikkonen J. (2017). Dynamic forest trafficability prediction by fusion of open data, hydrologic forecasts and harvester-measured data. Poster. 1 p.
Salmivaara A., Miettinen M., Finér L., Launiainen S., Korpunen H., Tuominen S., Heikkonen J., Nevalainen P., Sirén M., Ala-Ilomäki J., Uusitalo J. (2018). Wheel rut measurements by forest machine mounted LiDAR sensor – accuracy and potential for operational applications. International Journal of Forest Engineering 29(1): 41–52. https://doi.org/10.1080/14942119.2018.1419677.
Sirén M., Ala-Ilomäki J., Mäkinen H., Lamminen S., Mikkola T. (2013a). Harvesting damage caused by thinning of Norway spruce in unfrozen soil. International Journal of Forest Engineering 24(1): 60–75. https://doi.org/10.1080/19132220.2013.792155.
Sirén M., Hytönen J., Ala-Ilomäki J., Neuvonen T., Takalo T., Salo E., Aaltio H., Lehtonen M. (2013b). Integroitu aines- ja energiapuun korjuu turvemaalla sulan maan aikana – korjuujälki ja ravinnetalous. [Integrated harvesting of industrial and energy wood on peatlands under unfrozen period]. Working Papers of the Finnish Forest Research Institute 256. 24 p. [In Finnish]. http://urn.fi/URN:ISBN:978-951-40-2410-8.
Sirén M., Salmivaara A., Ala-Ilomäki J., Launiainen S., Lindeman H., Uusitalo J., Sutinen R., Hänninen P. (2019). Predicting forwarder rut formation on fine-grained mineral soils. Scandinavian Journal of Forest Research 34(2): 145–154). https://doi.org/10.1080/02827581.2018.1562567.
Tamminen P. (1991). Kangasmaan ravinnetunnusten ilmaiseminen ja viljavuuden alueellinen vaihtelu. [Expression of soil nutrient status and regional variation in soil fertility of forested sites in Southern Finland]. Folia Forestalia 777. 40 p. [In Finnish with English summary]. http://urn.fi/URN:ISBN:951-40-1170-8.
Toivio J., Helmisaari H.S., Palviainen M., Lindeman H., Ala-Ilomäki J., Sirén M., Uusitalo J. (2017). Impacts of timber forwarding on physical properties of forest soils in southern Finland. Forest Ecology and Management 405: 22–30. https://doi.org/10.1016/j.foreco.2017.09.022.
Uusitalo J., Ala-Ilomäki J., Lindeman H., Toivio J., Siren M. (2019). Modelling soil moisture – soil strength relationship of fine-grained upland forest soils. Silva Fennica vol. 53(1) article 10050. https://doi.org/10.14214/sf.10050.
Väätäinen K., Lamminen S., Ala-Ilomäki J., Sirén M., Asikainen A. (2012). More efficiency with intelligent operator tutoring systems in wood harvesting. In: Special issue. Abstracts for international conferences organized by LSFRI Silava in cooperation with SNS and IUFRO. Mezzinatne 25(58): 125–126.
Väätäinen K., Lamminen S., Ala-Ilomäki J., Sirén M., Asikainen A. (2013). Kuljettajaa opastavat järjestelmät koneellisessa puunkorjuussa – kooste hankkeen avaintuloksista. [Operator assistance systems in merchanized harvesting]. Working Papers of the Finnish Forest Research Institute 279. 24 p. [In Finnish]. http://urn.fi/URN:ISBN:978-951-40-2453-5.
Valtioneuvoston asetus metsien kestävästä hoidosta ja käytöstä (2013). [Government decree on sustainable management and use of forests 1038/2013]. http://finlex.fi/fi/laki/ajantasa/2013/20131308. [In Finnish]
Vega-Nieva D.J., Murphy P.N.C., Castonguay M., Ogilvie J., Arp P.A. (2009). A modular terrain model for daily variations in machine-specific forest soil trafficability. Canadian Journal of Soil Science 89(1): 93–109. https://doi.org/10.4141/CJSS06033.
Venäläinen P., Räsänen T., Hämäläinen J. (2015). Potential business models for forest big data. DIGILE´s data to intelligence (D21) program. Metsäteho report 235. 36 p. http://www.metsateho.fi/wp-content/uploads/2015/03/Raportti_235_Potential_Business_Models_for_Forest_Big_Data_pv_ym.pdf.
Wang L. (1997). Assessment of animal skidding and ground machine skidding under mountain conditions. International Journal of Forest Engineering 8: 57–64.
Wästerlund I. (1985). Compaction of till soils and growth tests with Norway spruce and Scots pine. Forest Ecology and Management 11(3): 171–189. https://doi.org/10.1016/0378-1127(85)90025-8.
Willén E., Friberg G., Flisberg P., Andersson G. (2017). Bestway – beslutstöd för förslag till huvudbasvägar för skotare. Demonstrationsrapport BillerudKorsnäs-Mellanskog . [Bestway – Decision support tool for proposing main base roads for forwarders. Demonstration report for BillerudKorsnäs and Mellanskog]. Skogforsk, Arbetsrapport 955. 27 p. [In Swedish with English summary]. https://www.skogforsk.se/contentassets/60d1a46520644987bfce2624db7fabc2/arbetsrapport-955-2017.pdf.
Williamson J.R., Neilsen W.A. (2000). The influence of forest site on rate and extent of soil compaction and profile disturbance of skid trails during ground-based harvesting. Canadian Journal of Forest Research 30(8): 1196–1205. https://doi.org/10.1139/x00-041.
Wronski E.B., Stodart T.M., Humpreys N. (1990). Trafficability assessment as an aid to planning logging operations. Appita 43(1): 18–22.
Zhao Y., Krzic M., Bulmer C.E., Schmidt M.G., Simard S.W. (2010). Relative bulk density as a measure of compaction and its influence on tree height. Canadian Journal of Forest Research 40(9): 1724–1735. https://doi.org/10.1139/X10-115.
Total of 74 references.
