Petter Nilsen  ,
Line Tau Strand
,
Line Tau Strand
Carbon stores and fluxes in even- and uneven-aged Norway spruce stands
Nilsen P., Strand L. T. (2013). Carbon stores and fluxes in even- and uneven-aged Norway spruce stands. Silva Fennica vol. 47 no. 4 article id 1024. https://doi.org/10.14214/sf.1024
Highlights
- Long term (81 years) C sequestration is slightly higher in an even-aged compared to an uneven-aged spruce stand
- The even-aged stand has at 81 years age a slightly lower soil C content than the uneven-aged stand
- Present C fluxes indicate that the difference in long term C sequestration will increase in favour the even-aged stand if final felling is postponed.
Abstract
This investigation compares present C stores, fluxes and historic tree C sequestration in an uneven-aged and an even-aged Norway spruce stand under similar high productive soil conditions in south-eastern Norway. A selection cutting system has been performed in the uneven-aged forest stand for 81 years and the even-aged stand was established after clear-cutting 81 years ago. Timber productivity has been measured in the uneven stand for 81 years and in the even-aged stand for 52 years. C storage was determined based on tree measurements, tree biomass functions, soil samples and C analyses from trees and soil. Litter fall was sampled during one year and CO2 efflux from the soil was measured during one growing season. The present tree C storage (including roots) was 210 Mg C ha-1 in the even-aged stand and 76 Mg C ha-1 in the uneven-aged stand, while the corresponding figures for C in the soil was 178 and 199 Mg C ha-1. The long term timber production in the uneven-aged stand was measured to be 95% of the even-aged stand and the difference in net C sequestration was 37 Mg ha-1 in an 81 year period in favour the even-aged stand. The highest present CO2 efflux from soil was measured in the even-aged stand. The total net C sequestered in trees during 81 years minus the present soil C-stock accounts to 16 Mg ha-1 in favour the even-aged system
Keywords
ground vegetation;
C storage;
C sequestration;
CO2 efflux;
litter fall
-
Nilsen,
The Research Council of Norway, P.O. Box 2700, St. Hanshaugen, N-0131 Oslo, Norway
E-mail
pn@rcn.no
- Strand, Department of Plant and Environmental Sciences, Norwegian University of Life Sciences, P.O. Box 5003, N-1432 Ås, Norway E-mail line.strand@umb.no
Received 18 April 2013 Accepted 8 October 2013 Published 23 October 2013
Views 176779
Available at https://doi.org/10.14214/sf.1024 | Download PDF

1 Introduction
The boreal forest is a major terrestrial carbon (C) sink (Dixon et al. 1994) and the potential for further increase of this sink through forest management options has been widely discussed (Lunnan et al. 1991; Hoen and Solberg 1994; Binkley et al. 1997; Sampson et al. 2000; Jandl et al. 2007) and many countries have chosen to account for forest management activities as part of their C accounting under article 3.4 of the Kyoto protocol. For the boreal region several management options have been evaluated for C sink increase, e.g. fertilisation (Chen et al. 2000; Adams et al. 2005; Bergh et al. 2005), increased rotation length (Liski et al. 2001), peatland cultivation for forestry (Minkkinen et al. 2001), less thinning (Jarvis et al. 2005; Thornley and Cannel 2000), mimic natural forest development (Thornley and Cannel 2000), introduction of high productive exotic tree species and genetic improvement of trees (e.g. IPCC 2000).
In Scandinavia the prevailing harvest method in forestry is by clear-cutting thereby creating more or less mono-specie, even-aged and even-sized forest stands (Yrjölä 2002). The argument for choosing this harvesting method has been for practical and economic reasons. However, this way of managing forests have been heavily criticized claiming that this practise has negative consequences for biodiversity, visuality of the landscapes, recreational activities and carbon sequestration (Pukkala et al. 2011). With respect to carbon sequestration there are few studies comparing different management systems to confirm adverse effect of one or the other management practice. An alternative to clear-cutting is managing the forest by use of uneven-aged stand or selection cutting system. This is one way of mimicking natural forest development. In the uneven-aged stand system only a fraction of the trees are harvested at a time, leaving the stand with a continuous tree cover. Typically, the largest and most valuable trees are harvested. However, the strategy is also to harvest medium sized and small trees in order to prepare for valuable development of remaining trees for future harvests. The interval between cuttings typically varies from five to ten years. The system is based on natural regeneration of shade tolerant tree species and the preferred diameter distribution is characterised as inversed J-shaped with a large number of small trees (e.g. Schütz 1989).
As carbon sequestration is becoming an important goal in forestry it is important to establish management regimes that promote increased C-stocks. A measurable C sink implies that the C stock is increasing. In the boreal forest the soil C content is estimated to be five times higher than the C stored in the vegetation (IPCC 2000). Soil C is probably the major sink in boreal forests, while in tropical forests the living biomass is the main sink for C (Grace 2005). For this reason any management options will have to take into account, not only the living biomass, but also the increase or decrease in soil C.
It has been argued that in a long term (e.g. a rotation period of 100 years) C sequestration will be positively affected in an uneven-aged stand system compared to the clear-felling system (Thornley and Cannel 2000; Harmon et al. 2009). The reason for this could be ascribed to a continuous input of C from litter into the soil in the uneven-aged stand system, while a clear cutting system periodically involves direct ground floor exposure to sunshine, high temperatures and partly mechanical disturbance of the humus layer, causing high and rapid decomposition and CO2 efflux (Covington 1981). The magnitude of this effect has been widely discussed, ranging from large losses of some 50% of soil C or more in a 20 year period after clear-felling (Covington 1981; Federer 1984; Johnson 1992) to minor losses (Yanai et al. 2003; Lal 2005). This of course will vary with technical equipment, seasonal variation in soil disturbance and so forth. On the other hand, at least under Scandinavian conditions the production potential of stem volume often varies from 100 to 80% in uneven-aged stand systems compared to even-aged forests (Lunquist 1989; Andreassen and Øyen 2002). Even lower figures have been reported, based on both measurements and modelling (Kuuluvainen et al. 2012). The magnitude of C lost after clear felling is difficult to measure and varies considerably due to natural conditions and logging method. What is gained through a higher C storage in soil and ground vegetation in the uneven-aged system could be lost due to a lower above ground production potential compared to the even-aged system. The literature can provide only scarce insight to the magnitude of these matters. From one investigation in Italy a higher C stock in soil was found in uneven-aged stand compared to 60 years old even aged Norway spruce stand following afforestation of former meadow (Thuille et al. 2000). However, comparisons on C sequestration of the uneven-aged stand system and the even-aged stand system should preferentially be done on former forest land if the goal is to compare the effect of changing from one system to another in order to sequester more C. Even though the uneven-aged stand system has been quite common in parts of Europe, the lack of comparisons on C sequestration are almost complete. The reasons for this are many, but comprise e.g. lack of comparable sites, need for very long time perspective to establish effects and lack of statistical sound experiments for comparison.
For these reasons we wanted to make a field comparison of C in standing biomass, long term volume production, soil C, soil CO2 efflux and litter fall in a long term running experiment with an uneven-aged forest stand and a mature even-aged Norway spruce stand. The comparison was made in order to highlight long term differences in C sequestration of the two forest management systems.
2 Materials and methods
2.1 Field experiment
Two long term field experiments in Norway spruce (Picea abies (L.) Karst.) stands established by the Norwegian Forest and Landscape Institute were used for the investigation. The experiments are situated with a distance of 2–300 meters on very similar soil conditions in Eidsberg municipality (59°50´N, 11°25´E, 80 m a.s.l.). They are situated within an area dominated by leptittic gneisses from late proterozoic time (NGU 2005), covered by marine sediments. The soil in both experiments are silt loams and classified as Aquic Dystrudepts according to Soil Taxonomy (USDA 1999). Both stands are situated on flat land and the vegetation can be classified into the Eu-Piceetum athyrietosum subassosiation (Kielland-Lund 1981). The field vegetation has an abundance of Vaccinium myrtillus L., Calamagrostis purpurea (Trin.) Trin., Athyrium filix-femina (L.) Roth. and Gymnocarpium drypopteris (L.) Newman. Geranium sylvaticum L., Fragaria vesca L., Filipendula ulmaria (L.) Maxim. and Melica nutans L. are present but less abundant. The most dominating mosses are Hylocomium splendens (Hedw.) Br. et Sch. and Rhytidiadelphus triquetrus (Hedw.) Warnst.
Some key information about stand condition in the experiments is given in Table 1. The uneven-aged forest experiment (no. 90) was established in 1923 in an already uneven-aged, natural regenerated Norway spruce stand earlier treated with selection cutting. After establishment the stand has been treated with selection cuttings 11 times up to 1998 and details about earlier diameter distribution and volume development is described in Andreassen (1994). The uneven-aged forest experiment was compared with two plots chosen from an even-aged stand with different thinning treatments (experiment no. 540). This thinning experiment was established in 1951 in a 29 year old even-aged stand on an earlier clear-felled area. This implies that the forest in this experiment was established in 1922 making it highly comparable to the uneven aged experimental plot. The stand density in 1951 was on an average 5900 trees per ha. Two out of four treatments in the experiment have been chosen for use in this investigation, representing what has been called light and medium thinning, performed in five thinning from 1954 to 1975. The slight difference in thinning regime and natural mortality has resulted in two stands with relatively small differences in standing volume at the investigation in 2003 (Table 1). Most cutting operations have been performed during winter time and precaution has been made to restrict soil disturbances. Only tree trunks have been extracted from the stands.
| Table 1. Stand parameters for uneven-aged and even-aged stand (light and medium thinning) in spring 2003. | |||||||||
| Stand type | Start of experiment | Area, ha | Stand age, years | Number of trees ha–1 > 2.5 cm DBH | Site index, H40 | Standing volume, m3 ha–1 | Basal area, m2 ha–1 | Diameter (Dg), cm | Dominant height, m |
| Uneven-aged | 1923 | 1.0 | - | 1266 | 20.2 a) | 222 | 23.0 | 15.3 | 27.9 |
| Even-aged light thinning | 1951 | 0.101 | 81 | 1043 | 21.0 b) | 710 | 55.9 | 26.1 | 28.1 |
| Even-aged medium thinning | 1951 | 0.065 | 81 | 1120 | 20.1 b) | 649 | 51.0 | 23.6 | 27.4 |
| a) Site index estimated by vegetation type (Nilsen and Larsson 1992). b) Site index by dominant height at age 40 years in breast height (Tveite 1977). | |||||||||
2.2 Tree biomass
The latest tree measurements were done in 2005 in the uneven-aged stand and 2006 in even-aged stand. All stands were defined as pure spruce stands with some scattered birch tree in the uneven-aged stand. From 1923 tree measurements have been performed in the uneven-aged stand at 13 occasions. In the even-aged stand, 12 registrations of tree conditions have been made. All trees > 2.5 cm at breast height have been measured by diameter. In the even-aged stand, 30–40% of the trees have been picked by a diameter quotient as sample trees for additional height and crown length measurements. The quotient was chosen in a manner that each sampling tree represented equal volumes in their diameter class. In the uneven-aged stand most of the upper storey dominating trees were sample trees and only some (selected by a quotient) in the small diameter classes. Tree height on non-sample trees have been estimated as mean sample tree height, in the actual diameter class (1 cm class width). Standing volume (including bark) was calculated with common used volume functions (Vestjordet 1967). For biomass (stem wood, bark, dead and living branches, stump, coarse (> 5 cm diameter) and fine roots (< 5 cm diameter)) dry weight functions developed for Sweden (Marklund 1988), with tree diameter and height as explanatory variables, were used.
For C content estimations a concentration of 0.49 was used for all tree compartments (bole wood, bark, twigs, needles, dead branches, stump root system) based on earlier investigation (Nilsen and Strand 2008). Tree C storage at experiment level was found by summing C in all compartments for all trees. The difference in tree volume and biomass fractions, plus the sum of natural mortality, between the last and the previous measurements (1999 and 2006 in the even-aged stand and 1991 and 2005 in the uneven-aged stand) was used to calculate biometric values for 2003, assuming a linear trend between the two last measurements. This was done in order to harmonize all stand values to year 2003 when soil parameters, ground vegetation, litter fall and soil CO2 efflux was measured in the experiments. Total tree production during the 81 year period was calculated based on stand level data summing up total stem volume of harvested trees and natural mortality in the period. Based on the ratio of trunk volume to C in trees in the last measurement, the net C capture in the trees in the whole period was calculated from the volume increment figures.
2.3 Field- and ground layer vegetation
Within the uneven-aged stand a systematic grid of 4 x 5 meters existed. For registration of vegetation appearance (dominating species), miniplots (50 cm x 50 cm) were systematically addressed to 90 of the grid crosses. At each miniplot the vegetation appearance was roughly described into five to six categories (grasses, tall herbs, ferns, sphagnum, other mosses, no vegetation). At ten systematically placed miniplots, the field- and ground layer vegetation down to the top of the humus layer was harvested. The roots of the living ground vegetation were not sampled. The harvested vegetation was dried at 105 °C for three days, weighted and analysed for C content. The C content was up-scaled by the area distribution of the vegetation appearance in the 90 miniplots to give the total C storage of field- and ground vegetation in the experiment. The same procedure was used in the even-aged stand, but here the miniplots (5 altogether) were placed randomly in the two experimental plots and the up scaling was done according to a sketch of the vegetation cover made for each plot.
2.4 Litterfall collection
In late May 2002 litter traps were placed within the uneven-aged stand in 20 of the existing grid crosses and ten traps within the even-aged stand (5 in each plot) in a systematic pattern. The litter traps that served for tree litter collection were made in nylon mesh and were circular with a diameter of 45.2 cm and 1 meter deep and placed on wooden poles 1.5 meter above ground. Growing season litterfall was collected with these traps. During winter, ten traps in the uneven-aged stand and four traps in the even-aged stand made of wooden frames (50 cm x 50 cm) with a nylon mess were used. They were placed directly on the ground adjacent to the summer litter traps. Winter litterfall was collected once, while growing season litterfall was collected two to three times each growing season. The last litter collection was made in October 2003. One year litterfall is based on the period summer 2002 to summer 2003. No litter from the field vegetation layer was collected. Five representative samples were taken from the litter and dried at 70 °C for carbon analysis. The remaining litter was dried at 105 °C and weighted and the total litter production calculated. The total C content of the litter was found by multiplying the C concentration and the dry matter content.
2.5 Soil sampling and analyses
Two soil profiles down to one meter depth were dug inside the uneven-aged stand and one inside the even-aged stand and described and sampled for soil classification purpose and for determination of soil bulk density in the mineral soil horizons in particular. Soil bulk density was determined by pressing three 100 cm3 cylinders into each horizon, these were taken out and the soil was dried at 105 °C for 24 hours, weighted and dry bulk density was determined. Gravel and stones (fractions > 2 mm) were negligible in all profiles. The mineral soil density data from the profiles were used together with the C concentration measured in the composite samples described below to calculate the soil C stock.
Composite soil samples from the O horizon and mineral soil horizons were taken systematically adjacent to each litterfall sampler. The uneven-aged stand was divided into four sectors and five soil samples from similar horizons were bulked within each sector. In the even-aged stand, five soil samples from similar horizons were bulked within each of the two plots. Bulk density was calculated individually for each sample of the O horizon, these samples were taken with a cylinder bore (6.6 cm diameter). The thickness of each O horizon was measured in every core, the samples were dried at 105 °C for three days and the bulk density was calculated. Mineral soil samples were taken with a slice borer down to a depth of 1 meter. Thickness of the different horizons were measured and averaged within each sector and plot. All soil samples were air dried at 25 °C and sieved through a 2 mm mesh prior to chemical analyses.
2.6 Carbon analyses of soil, litter and ground vegetation samples
The bulked soil samples from the sectors and plots were all analysed for concentration of total C by an Elementar Vario EL with TCD detector on mortared soil samples (Ogner et al. 1999). Samples from ground vegetation and litter were mortared and analysed for total C using the same procedure. The C concentrations of soil, litter and vegetation were all dry matter corrected.
2.7 Soil CO2 efflux
In the uneven-aged stand, 20 sampling points were chosen in the described grid system for measuring soil CO2 efflux. The sampling points were placed systematically nearby the litter traps. In the even-aged stand, ten sampling points were placed in the same way nearby the litter traps. At nine occasions during the growing season CO2 measurements were performed with a PP EGM-4 gas monitor for CO2, to estimate soil respiration (PP Systems 2002). The chamber was of the SRC-1 type, cylindrical with an internal diameter of 100 mm and 150 mm height. Air was circulated between the analyser and the chamber at flow rate of 0.3 l min−1. The CO2 concentration was measured every 8 s and the flux was calculated from the concentration increase over time. Each flux measurement lasted three min or until a good quadratic fit was obtained (Pumpanen et al. 2004). The accuracy of the CO2 monitoring is 1% given by producer. At each sampling point one measurement was made directly on the soil surface without any exclusion of roots by collars. A second sample was taken at an adjacent point where a collar was forced 15 cm down in the soil at the start of the growing season. The ground vegetation was in both cases carefully removed before measurement in order to ensure a good contact between chamber and soil to minimise any loss of CO2 from the measurement area, the mosses were kept intact where they occurred in the sampling points. Measured fluxes without root excluding collars thus represent the tree root respiration, moss respiration and heterotrophic soil respiration. Each sample point was measured two to four times (three minute reading) depending on the variation in the results. The mean value of these readings was used for further analysis. All measurements were done during daytime.
2.8 Statistical analyses
All analyses have been performed in the SAS system (SAS 1999). Since no true replicate exists within the uneven-aged stand, the four sectors in the uneven-aged stand and two plots in the even-aged stand have been used for soil and CO2 analyses in evaluating differences between the cutting systems (ANOVA analyses). At each occasion ANOVA analyses was performed within each experiments to test for differences in CO2 efflux inside and outside root collars. For aboveground biomass only values on experimental or plot level are presented.
3 Results
3.1 Carbon stocks in biomass
Tree biomass dry weight and C content is shown in Table 2 for the even-aged and the uneven-aged stand experiments. The C content was nearly three times higher in the even-aged stand (199–220 Mg ha–1) compared to the uneven-aged stand (76 Mg ha–1). The amount of C in ground vegetation (roots not included) was also higher in the even-aged stand (Table 2) and it comprised 0.3–0.6% of the values found in the trees.
The current stem volume increment was 2 times higher for the even-aged stand compared to the uneven-aged stand (Table 3), varying from 11.3 to 24.2 m3 ha–1 a–1, while the current C accumulation was 4130 kg ha–1 a–1, representing 32 per cent lower accumulation than the even-aged stand at the present stage. The mean annual increment in the 81 year period has been 10.0 m3 ha–1 a–1 for the uneven-aged system and 10.5 m3 ha–1 a–1 on an average for the even-aged system and the total net C accumulated (including harvested trees and natural mortality) in the period was 225 Mg ha–1 in the uneven-aged stand system compared to 262 Mg ha–1 in the even-aged stand (Table 3). Thus the difference between the two management systems accounted to 37 Mg C ha–1 in tree biomass accumulation over the 81 year period.
| Table 2. Total biomass in standing trees and distributed on different tree compartments and C in tree biomass and ground vegetation (Mg ha–1) in the experimental stands in 2003. | |||||||||||
| Experiment | Biomass | ||||||||||
| Sum total biomass | Stem wood | Stem bark | Living branches | Dead branches | Stump | Coarse roots | Fine roots | C in tree biomass | C in ground vegetation | ||
| Uneven-aged | 155 | 79 | 8 | 35 | 0.016 | 9 | 17 | 7 | 76 | 0.39 | |
| Even-aged light thinning | 450 | 266 | 21 | 74 | 0.013 | 23 | 49 | 15 | 220 | 0.70 | |
| Even-aged medium thinning | 407 | 211 | 19 | 68 | 0.013 | 21 | 44 | 15 | 199 | 0.52 | |
| Table 3. Mean annual harvest of stem volume (including natural mortality) in an 81 year period in uneven-aged stand and mean annual increment (81 year period) in even-aged stand, total C accumulation in tree biomass, current stem volume increment and current C-accumulation in all tree parts (incl. roots < 5 cm). | ||||
| Experiment | Mean annual increment/harvest, m3 ha–1 a–1 | Total C accumulation in trees (81 year period), Mg ha–1 | Current stem volume increment, m3 ha–1 a–1 | Current C accumulation, kg ha–1 a–1 |
| Uneven-aged | 10.0 | 225 | 11.3 | 4130 |
| Even-aged light thinning | 11.0 | 276 | 23.0 | 5590 |
| Even-aged medium thinning | 10.0 | 248 | 24.2 | 5270 |
3.2 Litterfall
C litter fall fluxes in uneven-aged stand and the two plots in the even-aged stand during one year are shown in Fig. 1. The even-aged stand had 65% higher amount of C in litterfall during the one year investigated, and the difference of 950 kg C ha–1 was significant (5%-level) using the four sectors in the uneven-aged stand as replicates.
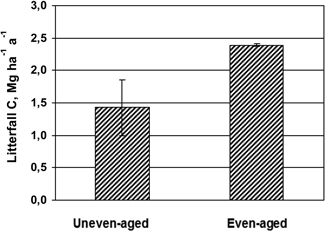
Fig. 1. Mean values and standard deviation (vertical bars) of C in litterfall during one year in the uneven-aged (n = 4) and even-aged stands (n = 2).
3.3 C stocks in soil
The average O- horizon thickness in the uneven-aged stand was one cm thicker than in the even-aged stand but the difference was not significant (Table 4). The total C content of 199 Mg ha–1 in the uneven-aged stand compared to 178 Mg ha–1 in the even-aged stand. The difference was mainly due to a 20% higher C content in the humus layer in the uneven-aged stand compared to the even-aged stand. The difference was, however, not significant.
| Table 4. O-horizon thickness (cm) and C stocks (Mg ha–1) in humus and mineral soil layers down to 1 m depth in the different treatments, standard deviation in brackets. | ||||
| Exp. plot | O-horizon | C Mg ha–1 | ||
| Thickness, cm | O-horizon | Mineral (30 cm) | O and mineral (100 cm) | |
| Uneven-aged | 8.30 (2.47) | 53.7 (8.3) | 103.2 (30.5) | 198.8 (50.4) |
| Even-aged | 7.25 (2.26) | 43.6 (4.8) | 100.8 (15.9) | 178.1 (16.0) |
3.4 CO2 efflux from soil
As seen from Fig. 2 the even-aged stand showed a very similar CO2 efflux pattern as the uneven-aged stand during the growing season, varying between 0.2–1.1 g CO2 m–2 h–1. Average values of all measurements showed a 16.6% higher CO2 efflux in the even-aged stand compared to the uneven-aged. The CO2 efflux during midsummer was some 25% higher in the even-aged stand. The analyses using 4 sectors as replicates in the uneven-aged stand showed significant difference in CO2 efflux between the stands only at June 2 (5%-level). This holds both for the efflux inside and outside root collars separately.
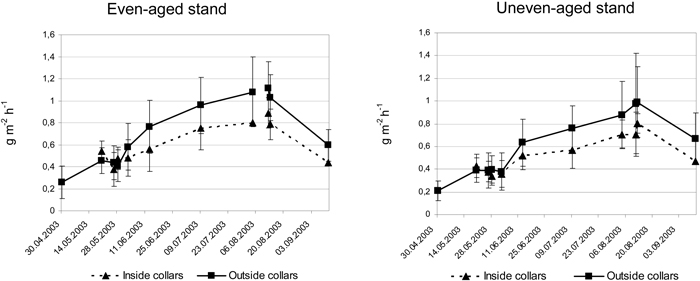
Fig. 2. Average CO2 efflux in g m–2 h–1 and standard deviation at different occasions during the growing season 2003 inside and outside collars in the uneven-aged and even-aged stands.
The CO2 efflux was on an average 21.6% higher outside the root collars compared to the efflux inside root collars in the uneven-aged stand, and the corresponding difference within the even-aged stand was 19.6%. The differences were significant at 5%-level from June 13 to September 11 within both stands. At most, the CO2 efflux was 38% (August 8) and 31% (July 11) higher from patches without root collars compared to patches with root collars in the uneven-aged and even-aged stand, respectively
4 Discussion
4.1 Tree yield and C sequestration
The results show that tree biomass production and hence net C sequestration in the 81 year period has been higher in the even-aged system compared to the uneven-aged system. The difference was 37 Mg C ha–1. This is not surprising due to the fact that C sequestration is closely linked to tree volume production, and in the present investigation the mean annual increment was 5% less in the uneven-aged stand compared to the even-aged. Under Nordic conditions the uneven-aged system has been reported to perform 8 to 20% less volume production than the even-aged system (Lundqvist 1989; Andreassen 1994; Andreassen and Øyen 2002). There are several obstacles in comparing the C sequestration potential between an uneven-aged system and an even-aged forestry system. The timber production potential usually refers to the long term timber harvest (including mortality) in the uneven-aged system compared to the mean annual increment in an even-aged stand under similar conditions and over a rotation period. The performance of the even-aged stand is dependent of thinning regime and what stand density that is chosen throughout the rotation period. By increasing the standing volume (less thinning) over a period, it is possible to increase the timber production (Braastad 1975) and thus C sequestration. The density effect on productivity also holds for the uneven-aged system, but the regeneration conditions and recruitment of small dimensions into the selection stand will be significantly hampered by a too high density. Unfortunately, there are too few uneven-aged experiments in Norway to recommend an optimum density for both production and regeneration. However, based on 16 selection cutting experiments from Norway, the measured production was on an average 20% less than the yield capacity based on site index estimation (Andreassen 1994). From Sweden an average 8% reduction compared to yield capacity in 11 experiments were found (Lundqvist 1989). Based on this it is most probable that the uneven-aged system in the long run (more than one rotation period) will sequester less C aboveground compared to an even-aged system.
The C sequestered by the ground vegetation is small compared to the C in the trees. In the present investigation the C storage in the vegetation (above ground parts) is some 0.3–0.6% of the C in the trees (Table 2). However, the annual ground vegetation turnover rate is high and it has been demonstrated that C input to soil from field layer can account for more than 25% of total ecosystem production (Kleja et al. 2008) in a 40 year old Picea abies stand.
4.2 Soil C
A crucial question is whether the absence of a clear-cutting stage, with sometimes high soil C loss, will increase the long term soil C content in the uneven-aged system compared to the even-aged system. The C loss from soil after clear cutting in 1923 is not possible to estimate, but a non-significant 10% higher soil C (21 Mg ha–1) content was found in the uneven-aged system after 81 years. We could argue that the situation in 1923 just prior to the clear-cutting and stand establishment was rather similar concerning forest and soil conditions.
When summing up total net C sequestered in trees and present soil C-stocks the difference is 24 Mg ha–1 in favour the even-aged system. This represents around 10% of net C sequestration by trees in the period. Based on these figures it could be claimed that there are not large differences between the two systems concerning long term C sequestration. The interpretation should be done with great caution due to several uncertain factors, e.g. choice of management activities as tending, thinning and soil disturbances, and also the lack of knowledge of the pre-treatment soil C conditions. The dissolved organic carbon (DOC) runoff has not been measured in the experiments, but the magnitude of C leaving as DOC is in the order of a few up to ten per cent of the total CO2 fluxes (Neff and Hooper 2002). Kleja et al. (2008) found that between 6 –19% of the litter input to the O-horizon was lost as DOC in a study of Swedish spruce forests, however, almost all (95%) of the DOC was captured in the upper mineral soil, so loss of C as DOC appears to be minimal from boreal forest soils. Cautions should also be taken due to the lack of real experimental replications. This is due to the very old history of the experiments and the large areas needed for an uneven-aged stand experiment, both disregarding the possibilities for true replications.
The magnitude and duration of C loss from soils after clear-felling varies a lot due to several factors. Johnson and Curtis (2001) made a meta analyses of C in mineral soil after clear-cutting and found both increase and decrease in mineral soil C content. Their conclusion was that on an overall basis no significant changes in soil C occurred after harvest. However, a significant increase in A-horizon C content was found after saw log harvesting of conifer trees. The so-called “Covington Curve”, describing a depletion of soil organic carbon (SOC) after harvesting hardwoods for some decades and then a recovery period (Covington, 1981), has been questioned (Yanai et al. 2003; Lal 2005). They claim that by taking options as careful deforestation, nutrient management and improved species into account, one can avoid a period of SOC depletion and even improve the SOC content. With relevance for the present study several investigations show a depletion of soil C after clear-felling. From Finland a net ecosystem exchange close to zero was found 12 years after clear-felling in Pinus sylvestris (Kolari et al. 2004) and 8–10 years after clear-felling in Picea glauca x engelmannii (Fredeen et al. 2007) in British Colombia Canada. Figures in the range of 10–14% depletion of soil C in a 15–22 year period after clear-felling has been demonstrated (Olsson et al. 1996; Liski et al. 1998) in Sweden and Finland. However, part of what was lost in organic layer was redistributed to the mineral soil (Olsson et al. 1996).
Model simulations are one way for evaluating the long term potentials of C sequestration in the two systems. Thornley and Cannell (2000) demonstrate with The Edinburgh Forest Model that pine plantations in Scottish climate, treated with 2.5% harvest of woody biomass each year, will have a lower volume yield compared to a thinned plantation with clear-felling after 60 year. The long term equilibrium of C sequestration was, however, almost twice in the partial harvested system compared to the thinned and clear-felled alternative, 28.1 and 14.3 kg C m–2. Similar results were found if 50% of the biomass was harvested each 20 year.
4.3 Litter fall and soil CO2 efflux
The figures for present litter fall and soil CO2 efflux can give an indication to what extend the small non-significant differences between the systems will increase when the rotation period is extended. With the clear differences in biomass of living branches (Table 2) one would also expect a higher annual litter fall in the dense even-aged stand compared to the uneven-aged stand. The amount of litter fall of approximately 1.5 to 2.5 Mg ha–1 a–1 found in this investigation is in good agreement with figures from the Norwegian Monitoring Programme for Forest Damage (Andreassen et al. 2002), where a variation of between 1 and 5 Mg ha–1 a–1 has been reported in comparable even-aged stands. The figures are small compared to highly productive forests in central Europe, where litter fall figures up to 8 Mg ha–1 a–1 have been reported from thinning experiments (Slodicak et al. 2005). The difference between the two systems represents 0.95 Mg C ha–1 a–1. In addition root litter and field layer litter should be accounted for. Figures on these fluxes lack in the present investigation , but based on results from Sweden, the figures on root litter are in the same order of magnitude as the above ground litterfall (Kleja et al. 2008). This means that the present difference in litter fall C input to the soil could be some 1.9 Mg C ha–1 a–1 (65%) higher in the even-aged system.
On the other hand the higher soil CO2 efflux from the even-aged stand must be substracted from the input to evaluate the source strength. The mean CO2 efflux from soil and roots in the stands varied between 0.2–1.1 g m–2 h–1 during the growing season. These are very common values in boreal and temperate coniferous forests (Thuille et al. 2000; Jiang et al. 2002; Olsson et al. 2005). The difference between the stands represents a roughly average of about 1 kg CO2 ha–1 h–1 during the growing season (Fig. 3 and 4). Using 6 month growing season this represents some 1.2 Mg C, indicating that the even-aged stand is at present a higher sink for soil C than the uneven-aged stand based upon litter fall and CO2 efflux measurement. The present much higher tree C sequestration in the even-aged stand will add to this.
Between 50 and 60% of the CO2 efflux from boreal forest soils is said to originate from root respiration (Bhupinderpal et al. 2003; Högberg et al. 2001; Russell and Voroney 1998). In the present investigations the CO2 efflux outside root collars was in the range from zero to 38% higher than inside root collars. The reason for the relatively low root respiration values is not elaborated any further, but could be due to a high age in the investigated stands. It is also evident that not all root respiration is excluded with the use of just 15 cm root collars. The soil profiles showed root penetrating down to 50 cm, even if the main part was in the upper 10–20 cm.
4.4 Conclusions
The results demonstrate an increase in soil C accumulation (21 Mg C ha–1 ) during 81 years in an uneven-aged system compared to an even-aged stand, mostly connected to differences in the O-horizon. On the other hand a higher total above-ground net C sequestration in the even-aged system is demonstrated. Over a period of 81 years the difference sum up to 37 Mg C ha–1 in the favour the even-aged system. The total net C sequestered in trees during 81 years minus the present soil C-stock accounts to 16 Mg ha–1 in favour the even-aged system. This coupled with the present higher C sink in soil in the even-aged stand indicates that the difference will increase if final harvest of the even-aged stand is postponed. The differences are not significant and several obstacles (e.g. time and stand history) make field based comparison difficult and more modelling efforts should therefore be directed to a clarification on this matter. Based on the present study it is reasonable to state that large differences are not to be expected between the two management systems concerning C sequestration in an 81 year perspective. Another aspect when comparing the two systems is the use of produced and extracted timber. It is not indifferent for an overall C budget if the produced timber is extracted and used for e.g. bioenergy or construction work and thereby stored for a long period, or simply stay unutilised, representing a part of natural mortality and thereby a relatively rapid CO2 release. This is, however, outside the goal of this paper.
References
Adams A.B., Harrison R.B., Sletten R.S., Strahm B.D., Turnblom E.C., Jensen C.M. (2005). Nitrogen-fertilization impacts on carbon sequestration and flux in managed coastal Douglas-fir stands of the Pacific Northwest. Forest Ecology and Management 220: 313–325. http://dx.doi.org/10.1016/j.foreco.2005.08.018.
Andreassen K. (1994). Development and yield in selection forest. Communications of Skogforsk 47(5): 1–37.
Andreassen K., Øyen B.H. (2002). Economic consequences of three silvicultural methods in uneven-aged mature coastal spruce forests of central Norway. Forestry 75: 483–488. http://dx.doi.org/10.1093/forestry/75.4.483.
Andreassen K., Clarke N., Røsberg I., Solberg S., Aas W. (2002). Intensive skogovervåkingsflater. Resultater fra 2001. Aktuelt fra Skogforskningen 4(2): 1–20. [In Norwegian with English summary].
Bergh J., Linder S., Bergström J. (2005). Potential production of Norway spruce in Sweden. Forest Ecology and Management 204: 1–10. http://dx.doi.org/10.1016/j.foreco.2004.07.075.
Bhupinderpal S., Nordgren A., Lofvenius M.O., Högberg M.N., Mellander P.E., Högberg P. (2003). Tree root and soil heterotrophic respiration as revealed by girdling of boreal Scots pine forest: extending observations beyond the first year. Plant Cell and Environment 26: 1287–1296. http://dx.doi.org/10.1046/j.1365-3040.2003.01053.x.
Binkley C.S., Apps M.J., Dixon R.K., Kauppi P.E., Nilsson L.O. (1997). Sequestering carbon in natural forests. In: Sedjo R.A., Sampson R.N., Wisniewski J. (eds.). Economics of carbon sequestration in Forestry. Critical Reviews in Environmental Science and Technology 27. p. 23–45.
Braastad H. (1975). Yield tables and growth models for Picea abies. Reports from the Norwegian Forest Research Institute 31(9): 359–537. [In Norwegian with English summary].
Chen W., Chen J., Price D.T., Cihlar J., Liu J. (2000). Carbon offset potentials of four alternative forest management strategies in Canada: a simulation study. Mitigation and Adaptation Strategies for Global Change 5: 143–169. http://dx.doi.org/10.1023/A:1009671422344.
Covington W.W. (1981). Changes in forest floor organic matter and nutrient content following clear cutting in northern hardwoods. Ecology 62: 41–48. http://dx.doi.org/10.2307/1936666.
Dixon R.K., Brown S., Houghton R.A., Soloman A.M., Trexler M.C., Wisniewski J. (1994). Carbon pools and flux of global forest ecosystems. Science 263: 185–190. http://dx.doi.org/10.1126/science.263.5144.185.
Federer C.A. (1984). Organic matter and nitrogen content of the forest floor in even-aged northern hardwoods. Canadian Journal of Forest Research 14(6): 763–767. http://dx.doi.org/10.1139/x84-136.
Fredeen A.L., Waughtal J.D., Pypker T.G. (2007). When do replanted sub-boreal clearcuts become net sinks for CO2? Forest Ecology and Management 239: 210–216. http://dx.doi.org/10.1016/j.foreco.2006.12.011.
Grace P. (2005). Role of forest biomes in the global carbon balance. In: Griffiths H., Jarvis P.G. (eds.). The carbon balance of forest biomes. Taylor and Francis, Oxon, UK. p. 19–45.
Harmon M.E., Marks B. (2002). Effects of silvicultural practices on carbon stores in Douglas-fir – western hemlock forests in the Pacific Northwest, U.S.A.: results from a simulation model. Canadian Journal of Forest Research 32: 863–877. http://dx.doi.org/10.1139/x01-216.
Hoen H.F., Solberg B. (1994). Potential and economic efficiency of carbon sequestration in forest biomass through silvicultural management. Forest Science 40: 429–451.
Högberg P., Nordgren A., Buchmann N., Taylor A.F.S., Ekblad A., Högberg M.N., Nyberg G., Ottosson-Lofvenius M., Read D.J. (2001). Large-scale forest girdling shows that current photosynthesis drives soil respiration. Nature 411: 789–792. http://dx.doi.org/10.1038/35081058.
IPPC (2000). Land use, land-use change and forestry. Cambridge University Press, Cambridge.
Jandl R., Lindner M., Vesterdal L., Bauwens B., Baritz R., Hagedorn F., Johnson D.W., Minkkinen K., Byrne K.A. (2007). How strongly can forest management influence soil carbon sequestration? Geoderma 137: 253–268. http://dx.doi.org/10.1016/j.geoderma.2006.09.003.
Jarvis P.G., Ibrom A., Linder S. (2005). ‘Carbon forestry’: managing forests to conserve carbon. In: Griffiths H., Jarvis P.G. (eds.). The carbon balance of forest biomes. Taylor and Francis Group 2005. p. 331–349.
Jiang H., Apps M.J., Peng C., Zhang Y., Liu J. (2002). Modelling the influence of harvesting on Chinese boreal forest carbon dynamics. Forest Ecology and Management 169: 65–82. http://dx.doi.org/10.1016/S0378-1127(02)00299-2.
Johnson D.W. (1992). Effects of forest management on soil carbon storage. Water, Air, and Soil Pollution 64: 83–120. http://dx.doi.org/10.1007/BF00477097.
Johnson D.W., Curtis P.S. (2001). Effects of forest management on soil C and N storage: meta analysis. Forest Ecology and Management 140: 227–238. http://dx.doi.org/10.1016/S0378-1127(00)00282-6.
Kielland-Lund J. (1981). Die Waldgesellschaften SO-Norwegens. Phytocoenologia 9: 53–259.
Kleja D.B., Svensson M., Majdi H., Jansson P-E., Langvall O., Bergkvist B., Johansson M-B., Weslien P., Truusb L., Lindroth A., Ågren G. (2008). Pools and fluxes of carbon in three Norway spruce ecosystems along a climatic gradient in Sweden. Biogeochemistry 89: 7–25. http://dx.doi.org/10.1007/s10533-007-9136-9.
Kolari P., Pumpanen J., Rannik Ü., Ilvesniemi H., Hari P., Berninger F. (2004). Carbon balance of different aged Scots pine in forests in Southern Finland. Global Change Biology 10: 1106–1119. http://dx.doi.org/10.1111/j.1529-8817.2003.00797.x.
Kuuluvainen T., Tahvonen O., Aakala T. (2012). Even-aged and uneven-aged forest management in boreal Fennoscandia: a review. Ambio 41(7): 720–737. http://dx.doi.org/10.1007/s13280-012-0289-y.
Lal R. (2005). Forest soils and carbon sequestration. Forest Ecology and Management 220: 242–258. http://dx.doi.org/10.1016/j.foreco.2005.08.015.
Liski J., Ilvesniemi H., Mäkelä A., Starr M. (1998). Model analysis of the effects of soil age, fires and harvesting on the carbon storage of boreal forest soils. European Journal of Soil Science 49: 407–416. http://dx.doi.org/10.1046/j.1365-2389.1998.4930407.x.
Liski J., Pussinen A., Pingoud K., Mäkipää R., Karjalainen T. (2001). Which rotation length is favourable to carbon sequestration? Canadian Journal of Forest Research 31: 2004–2013. http://dx.doi.org/10.1139/x01-140.
Lundqvist L. (1989). Use of the selection cutting system in Norway spruce forests – changes in the stand structure, volume increment, ingrowth and regeneration on experimental plots managed with single-tree selection. Swedish University of Agricultural Sciences, Department of Silviculture. Dissertation. p. 1–100. [In Swedish].
Lunnan A., Navrud S., Rørstad P.K., Simensen K., Solberg B. (1991). Forest and wood products in Norway as a means to reduce CO2-accumulation in the atmosphere. Aktuelt fra Skogforsk 6: 1–86. [In Norwegian].
Marklund L.G. (1988). Biomass functions for pine, spruce and birch in Sweden. Swedish University of Agricultural Sciences, Department of Forest Survey, Report 45: 1–73. [In Swedish].
Minkkinen K., Laine J., Hökkä H. (2001). Tree stand development and carbon sequestration in drained peatland stands in Finland – a simulation study. Silva Fennica 35(1): 55–69.
NGU (2005). Norwegian geological survey. Geological maps. http://geo.ngu.no/kart/berggrunn/. [Cited 30 March 2013].
Neff J.C., Hooper D.U. (2002). Vegetation and climate controls on potential CO2, DOC and DON production in northern latitude soils. Global Change Biology 8: 872–884. http://dx.doi.org/10.1046/j.1365-2486.2002.00517.x.
Nilsen P., Larsson J. (1992). Site index estimation from vegetation type and site properties. Research Paper of Skogforsk 22: 1–43. [In Norwegian].
Nilsen P., Strand L.T. (2008). Thinning intensity effects on carbon and nitrogen stores and fluxes in a Norway spruce (Picea abies (L.) Karst.) stand after 33 years. Forest Ecology and Management 256: 201–208. http://dx.doi.org/10.1016/j.foreco.2008.04.001.
Ogner G., Wickström T., Remedios G., Gjelsvik S., Hensel G.R., Jacobsen J.E., Olsen M., Skretting E., Sørlie B. (1999). The chemical analysis program of the Norwegian Forest Research Institute 2000. Internal report. p. 1–23. ISBN 82-7169-917-2.
Olsson B.A., Staaf H., Lundkvist H., Bengtsson J., Rosén K. (1996). Carbon and nitrogen in coniferous forest soils after clear-felling and harvests of different intensity. Forest Ecology and Management 82: 19–32. http://dx.doi.org/10.1016/0378-1127(95)03697-0.
Olsson P., Linder S., Giesler R., Högberg P. (2005). Fertilization of boreal forest reduces both autotrophic and heterotrophic soil respiration. Global Change Biology 11: 1–9. http://dx.doi.org/10.1111/j.1365-2486.2005.001033.x.
PP Systems (2002). EGM-4 Environmental gas monitor for CO2. Operators manual, version 1.00. PP Systems Inc. MA, USA.
Pukkala T., Lahde E., Laiho O., Salo K., Hotanen J.P. (2011). A multifunctional comparison of even-aged and uneven-aged forest management in a boreal region. Canadian Journal of Forest Research 41: 851–862. http://dx.doi.org/10.1139/x11-009.
Pumpanen J., Kolari P., Ilvesniemi H., Minkkinen K., Vesala T., Niinistö S., Lohila A., Larmola T., Morero M., Pihlatie M., Janssens I., Yuste J.C., Grünzweig J.M., Reth S., Subke J-A., Savage K., Kutsch W., Østreng G., Ziegler W., Anthonim P., Lindroth A., Hari P. (2004). Comparison of different chamber techniques for measuring soil CO2 efflux. Agricultural and Forest Meteorology 123: 159–176. http://dx.doi.org/10.1016/j.agrformet.2003.12.001.
Russell C.A., Voroney R.P. (1998). Carbon dioxide efflux from the floor of a boreal aspen forest. I. Relationship to environmental variables and estimates of C respired. Canadian Journal of Soil Science 78: 301–310. http://dx.doi.org/10.4141/S97-054.
Sampson R.N., Scholes R.J., Cerri C., Erda L., Hall D.O., Handa M., Hill P., Howden M., Janzen H., Kimble J., Lal R., Marland G., Minami K., Paustian K., Read P., Sanchez P.A., Scoppa C., Solberg B., Trossero M.A., Trumbore S., Van Cleemput O., Whitmore A., Xu D. (2000). Additional human-induced activities – article 3.4. In: Watson R.T., Noble I.R., Bolin B., Ravindranath N.H., Verardo D.J., Dokken D.J. (eds.). Land use, land-use change, and forestry. a special report of the Intergovernmental Panel on Climate Change. Cambridge University Press, Cambridge, UK. p. 1–377.
SAS (1999). Statistical analyses system. SAS release 8.02. SAS Institute Inc., Cary, NC, USA.
Schütz J.-Ph. (1989). Der Plenterbetrieb. Fachbereich Waldbau ETH, Zürich, Switzerland. p. 1–54.
Slodicak M., Novak J., Skovsgaard J.P. (2005). Wood production, litter fall and humus accumulation in a Czech thinning experiment in Norway spruce (Picea abies (L.) Karst.). Forest Ecology and Management 209: 157–166. http://dx.doi.org/10.1016/j.foreco.2005.01.011.
Thornley J.H.M., Cannell G.R.(2000). Managing forests for wood yield and carbon storage: a theoretical study. Tree Physiology 20: 477–484. http://dx.doi.org/10.1093/treephys/20.7.477.
Thuille A., Buchmann N., Schulze E-D. (2000). Carbon stocks and soil respiration rates during deforestation, grassland use and subsequent Norway spruce afforestation in the Southern Alps. Italy. Tree Physiology 20: 849–857. http://dx.doi.org/10.1093/treephys/20.13.849.
Tveite B. (1977). Site index curves for Norway spruce (Picea abies L. Karst.). Communications of the Norwegian Forest Research Institute 33: 1–84. [In Norwegian with English summary].
USDA (1999). Soil taxonomy. A basic system for soil classifiation for making and interpreting soil surveys. Second edition. United States Department of Agriculture, Natural Resources Conservation Service. Agriculture Handbook Number 436.
Vestjordet E. (1967). Funksjoner og tabeller for kubering av stående gran. Communications of Norwegian Forest Research Institute 22: 543–574. [In Norwegian with English summary].
Yanai R.D., Currie W.S., Goodale C.L. (2003). Soil carbon dynamics after forest harvest: an ecosystem paradigm reconsidered. Ecosystems 56: 197–212. http://dx.doi.org/10.1007/s10021-002-0206-5.
Yrjölä T. (2002). Forest management guidelines and practices in Finland, Sweden and Norway. European Forest Institute, Joensuu, Finland, Internal Report 11: 1–46.
Total of 56 references
