Jari Miina  ,
Inka Bohlin,
Torgny Lind,
Jonas Dahlgren,
Kari Härkönen,
Tuula Packalen,
Anne Tolvanen
,
Inka Bohlin,
Torgny Lind,
Jonas Dahlgren,
Kari Härkönen,
Tuula Packalen,
Anne Tolvanen
Lessons learned from assessing the cover and yield of bilberry and lingonberry using the national forest inventories in Finland and Sweden
Miina J., Bohlin I., Lind T., Dahlgren J., Härkönen K., Packalen T., Tolvanen A. (2021). Lessons learned from assessing the cover and yield of bilberry and lingonberry using the national forest inventories in Finland and Sweden. Silva Fennica vol. 55 no. 5 article id 10573. https://doi.org/10.14214/sf.10573
Highlights
- Model-based predictions of the berry yields of an average crop year are produced using the Finnish National Forest Inventory (NFI)
- Inventory-based estimates of seasonal berry yields are produced using the Swedish NFI observations
- The inventory-based method provides seasonal estimates, whereas models can be utilised to integrate vegetation cover and berry yields in numerical multi-objective forest planning.
Abstract
Bilberry (Vaccinium myrtillus L.) and lingonberry (V. vitis-idaea L.) can be a part of healthy diet and are important for many animals. Two approaches are described to assessing their vegetation cover and berry yield via national forest inventory (NFI) observations. The aim was to provide estimates and predictions of the abundance and yield of the species at regional and national levels in Finland and Sweden. In Finland, the model-based predictions are used in evaluating the impacts of cutting intensity on forest berries needed in forest-related decision making. In Sweden, seasonal inventory-based estimates are used to evaluate the annual national and regional berry yields, and in a forecasting system aimed at large public and berry enterprises. Based on the NFI sample plots measured between 2014 and 2018, the total annual yields are estimated to be 208 Mkg of bilberry and 246 Mkg of lingonberry on productive forest land (increment at least 1 m3 ha–1 year–1) in Finland, and 336 and 382 Mkg respectively in Sweden (average of NFI inventories in 2015–2019). The predicted development of berry yields is related to the intensity of cuttings in alternative forest management scenarios: lower removals favoured bilberry, and higher removals lingonberry. The model-based method describes the effects of stand development and management on berry yields, whereas the inventory-based method can calibrate seasonal estimates through field observations. In providing spatially and timely more accurate information concerning seasonal berry yields, an assessment of berry yields should involve the elements of both inventory-based and model-based approaches described in this study.
Keywords
forest management planning;
berry models;
field measurements;
predictions
-
Miina,
Natural Resources Institute Finland (Luke), Yliopistokatu 6 B, FI-80100 Joensuu, Finland
 https://orcid.org/0000-0002-8639-4383
E-mail
jari.miina@luke.fi
https://orcid.org/0000-0002-8639-4383
E-mail
jari.miina@luke.fi
- Bohlin, Swedish University of Agricultural sciences (SLU), Department of Forest Resource Management, Skogsmarksgränd, S-901 83 Umeå, Sweden E-mail inka.bohlin@slu.se
- Lind, Swedish University of Agricultural sciences (SLU), Department of Forest Resource Management, Skogsmarksgränd, S-901 83 Umeå, Sweden E-mail torgny.lind@slu.se
- Dahlgren, Swedish University of Agricultural sciences (SLU), Department of Forest Resource Management, Skogsmarksgränd, S-901 83 Umeå, Sweden E-mail jonas.dahlgren@slu.se
- Härkönen, Natural Resources Institute Finland (Luke), Latokartanonkaari 9, FI-00790 Helsinki, Finland E-mail kari.harkonen@luke.fi
- Packalen, Natural Resources Institute Finland (Luke), Yliopistokatu 6 B, FI-80100 Joensuu, Finland; Ministry of Agriculture and Forestry of Finland, P.O. Box 30, FI-00023 Government, Finland E-mail tuula.packalen@mmm.fi
- Tolvanen, Natural Resources Institute Finland (Luke), Paavo Havaksentie 3, FI-90014 University of Oulu, Finland E-mail anne.tolvanen@luke.fi
Received 25 May 2021 Accepted 16 November 2021 Published 18 November 2021
Views 92729
Available at https://doi.org/10.14214/sf.10573 | Download PDF

1 Introduction
Bilberry (Vaccinium myrtillus L.) and lingonberry (Vaccinium vitis-idaea L.) are typical forest dwarf shrubs producing berries. These two species are widely distributed across different parts of Europe and Northern Asia (Ritchie 1955, 1956). The species occur and produce yields in mesic and dryish forests, as well as many marginal forest and other treed peatland sites (Kardell 1980; Reinikainen et al. 2000). The picking of bilberries and lingonberries for both household consumption and sale is of great economic significance to many regions in the Nordic countries due to the right of public access to all forested land (Turtiainen and Nuutinen 2012). In addition, these two shrub species provide shelter and food for a variety of birds and small animals (Storch 1993). Due to the high importance of bilberry and lingonberry, there is a need to estimate and predict the development of vegetation cover and berry yield.
Based on national surveys, 58% of Finns picked berries, and 40% mushrooms, in 2010 (Sievänen and Neuvonen 2011). In Sweden, the corresponding figures were 54% for berry picking and 59% for mushroom picking (Fredman et al. 2013). Turtiainen et al. (2011) estimated that in Finland approximately 5–6% of the total bilberry yields and almost 10% of lingonberries were collected between 1997 and 1999. Commercial berry picking by foreign seasonal pickers has increased the utilisation rates of wild berries in the Nordic countries (Tahvanainen et al. 2019). Official and unofficial numbers show that 5000–8000 such people have been active in recent years, primarily in northern Sweden. In Finland, the number of migrant collectors has been estimated to be about 4000 (Peltola et al. 2014). According to Johansson (2016), the Swedish export of wild forest berries amounted to 10 Mkg of bilberry and 6 Mkg of lingonberry in 2015, with a value of about €25 and €20 M respectively. In the last five years (2016–2020), an average of 2.3 Mkg of Finnish bilberries (fresh and frozen) and 0.4 Mkg of lingonberries, with a value of €6.4 and €0.6 M respectively, was exported (Marsi 2016, 2018, 2020).
The diverse forest management goals of different forest owners (Silver et al. 2015) and citizens’ wishes (Juutinen et al. 2017) call for the integrating of biodiversity and ecosystem services (incl. forest berries) with forest holding and larger scale forest management planning calculations (Haara et al. 2018). Forest cuttings are a major cause of vegetation cover changes, including changes in bilberry and lingonberry (Tonteri et al. 2016). Since berry yield is linked to the respective plant cover, this indicates that cuttings also influence forests’ multiple-use potential. Kilpeläinen et al. (2018) has investigated the effects of forest management scenarios on bilberry yield in the North Karelia region in Finland. Recently, Kärkkäinen et al. (2020) have assessed the impact of land-use zoning decisions on the provision of various ecosystem services, including bilberry and lingonberry. Berry yield models have been utilised to integrate berries in numerical multi-objective forest planning (Miina et al. 2016; Kurttila et al. 2018; Kilpeläinen et al. 2018; Kärkkäinen et al. 2020) but so far, the national berry yields have not been assessed along the forest management scenarios.
The need for berry yield information is growing, along with increasing awareness of forests’ non-timber benefits. Previously, the Finnish estimates of regional and national bilberry and lingonberry yields have been based on empirical berry yield studies (determined from the literature) and the total areas of different site types according to the NFI data (Turtiainen et al. 2005, 2007). This provided estimates of the total annual bilberry and lingonberry yields (fresh weight) 184 Mkg and 257 Mkg, respectively (Turtiainen et al. 2007). Peatlands could produce an average of about 15.2 Mkg of bilberries (8.3% of the total berry yield) and 13.4 Mkg of lingonberries (5.2%) annually. Turtiainen et al. (2011) also estimated the total yields of poor and abundant crop years using the berry yield data on permanent sample plots, so-called MASI plots (Salo 1999). According to their calculations, annual yields varied from 92 to 312 Mkg for bilberry, and from 129 to 386 Mkg for lingonberry.
The Swedish NFI was already used to estimate the occurrence and yield of bilberry, lingonberry, and raspberry (Rubus idaeus L.) at regional and national levels in the mid-1970s (Kardell 1980). Between 1974 and 1977, the cover and fertility (occurrence of flowers or berries) of berry plants were monitored on all sample plots on productive forest land, about 10 000 plots per year. In a sub-sample of these plots, trained field staff picked ripe berries during the season on four or eight 1-m2 sub-plots. The information about ripe berries was used to convert the fertility data into the yield of ripe berries. The estimated total annual berry yields (fresh weight) varied between 219–307 Mkg for bilberry and 142–168 Mkg for lingonberry. In 1977, non-productive forest land was also inventoried, and estimates of additional yield were 20 Mkg for bilberry, and 10 Mkg for lingonberry.
Finland and Sweden have the extensive datasets on the cover and yield of forest berry species (Salo 1999; Reinikainen et al. 2000; Skogsdata 2020 2020). Merging them and evaluating them together provides a remarkable dataset and basis for modelling over the European boreal zone. For example, monitoring and predictions over time can be used to estimate the impacts of environmental changes on these dominant understory plants: bilberry and lingonberry. Changes occurring in their cover may reflect large-scale changes in forest ecosystems as well (Tonteri et al. 2016; Hedwall et al. 2019; Jonsson et al. 2021). The berry crops of these two species have high economic value, and predictions of their availability provide information on the multiple-use potential of forests in different management scenarios.
This paper aims to present and compare the current methods used to assess the cover and yield of bilberry and lingonberry using the national forest inventories in Finland and Sweden. In both Finland and Sweden, the current assessment of regional and national berry yields is based on NFI data, but the countries’ methods differ. In Finland, the berry yields were predicted using a model-based method consisting of models for the cover and yield of bilberry and lingonberry. In this study, the method was further developed by fitting the nationwide cover models and by calibrating local berry yield models to estimate berry yields across Finland. In addition, the performance of the model-based approach was illustrated by analysing the effects of intensified forest management on berry crops in regional and national level forest scenario analyses. In Sweden, the current field inventory method for bilberry and lingonberry used in the Swedish NFI was presented and used to estimate the annual berry yields. Finally, we suggest further avenues for developing the estimation methods for the yields of wild forest berries to better integrate them into forest inventory and management.
2 Material and methods
2.1 Model-based predictions on the cover and yield in Finland
2.1.1 Stand-scale models for bilberry and lingonberry
In the model-based method, first the vegetation cover of each species was predicted as a function of e.g., site fertility, stand age and stand basal area. Then, the berry yields were predicted from the cover and some other predictors.
New national models for the cover were fitted using an extensive dataset, whereas berry yields were predicted by using the existing models. Finally, due to local berry yield models, the yield predictions were calibrated to be able to estimate the berry yields in all sites and locations in Finland.
The bilberry and lingonberry cover models were based on relationships of the site and stand characteristics and the cover of understorey species measured on permanent sample plots in forests on mineral soils and mires in Finland in 1985–1986 (Reinikainen et al. 2000). These sample plots belong to a systematic network of 3000 permanent plots (PSP3000) established in connection with the 8th Finnish national forest inventory (NFI8). Understorey species (e.g., bilberry and lingonberry) were identified, and their percentage cover was visually estimated, in most cases, in four 2 m2 permanent quadrats within circular 300 m2 sample plots. In the data analysis, the cover estimates of berry species in the quadrats were averaged for each sample plot. If the sample plot was bisected by a stand compartment boundary, the stand characteristics and species cover were estimated separately for each stand. In the PSP3000 data, the number of quadrats varied from one to six per stand, but in this study, only the stands measured by at least three quadrats in 1985–1986 were included. As a result, each NFI sample plot was represented by only one stand, and the data consisted of a total of 2199 sample plots in 912 sample plot clusters (systematic cluster sampling is applied in the NFI) (Table 1).
| Table 1. Main continuous and categorical characteristics of the sample plots (the PSP3000 data) used in modelling the bilberry and lingonberry cover in Finland (N = 2199). Sites I–VIII refer to different site quality classes (I = herb-rich sites on brown soils, eutrophic mires, II = herb-rich sites, mesotrophic mires, III = mesic sites, meso-oligotrophic mires, IV = sub-xeric sites, oligotrophic mires, V = xeric sites, poor ombro-oligotrophic bogs, VI = barren sites, ombrotrophic bogs, VII = rocky and sandy soils and alluvial land, VIII = poorly productive and unproductive land). | |||
| Variable | Mean | SD | Range |
| Bilberry cover (%) | 9.2 | 13.5 | 0.0–87.5 |
| Lingonberry cover (%) | 6.7 | 7.6 | 0.0–57.5 |
| Stand age (years) | 61 | 48 | 0–325 |
| Stand basal area (m2 ha–1) | 13.2 | 10.1 | 0.0–53.8 |
| Altitude (m) | 137 | 8 | 0–830 |
| Temperature sum (dd) | 1085 | 170 | 410–1360 |
| Variable | Mineral soils (N = 1812) | Spruce mires (N = 120) | Pine mires (N = 267) |
| Site I | 40 | 2 | 3 |
| Site II | 270 | 39 | 5 |
| Site III | 802 | 57 | 31 |
| Site IV | 534 | 13 | 97 |
| Site V | 78 | n.a. | 130 |
| Site VI | 0 | n.a. | 1 |
| Site VII | 35 | n.a. | n.a. |
| Site VIII, poorly productive land | 28 | n.a. | n.a. |
| Site VIII, waste land | 25 | n.a. | n.a. |
| n.a. = not applicable | |||
Due to a highly skewed distribution, the non-integer values of the percentage cover, and overdispersion, a generalised linear mixed-effects model using a log-link function and a quasi-Poisson distribution assumption was used in modelling the cover (cf., Miina et al. 2020).
In the cover models, those site and stand characteristics were used as potential predictors that are available in the NFI data and usually known in forest planning systems. The parameters of the final models were fitted by using the function glmmPQL in the R package MASS (Venables and Ripley 2002). The continuous predictors were stand age (years), stand basal area (m2 ha–1), altitude (m), and temperature sum, i.e., the sum of the positive differences between daily mean temperatures and +5 °C (dd). The categorical predictors included (i) the dominant tree species: Scots pine (hereafter pine; Pinus sylvestris L.), Norway spruce (hereafter spruce; Picea abies (L.) H. Karst.) or deciduous trees (mainly birch Betula spp.), and (ii) site fertility classes separately for mineral soils and the main groups of forested peatland site types (cf., Turtiainen et al. 2013, 2016). Site fertility of mineral soils was classified as follows: I = herb-rich sites on brown soils (groves); II = herb-rich sites; III = mesic (fresh) sites; IV = sub-xeric (dryish) sites; V = xeric (dry) sites; VI = barren sites; VII = rocky and sandy soils and alluvial land; and VIII = poorly productive and unproductive land (Tomppo et al. 2011). The peatland site quality classes were: I = eutrophic; II = herb-rich (mesotrophic); III = Vaccinium myrtillus and tall-sedge (meso-oligotrophic); IV = Vaccinium vitis-idaea and small-sedge (oligotrophic); V = cotton-grass and dwarf-shrub (poor ombro-oligotrophic bogs); and VI = Sphagnum fuscum (ombrotrophic bogs). Spruce mires belong to classes I–IV, and the pine mires to classes I–VI.
The predictions for cover were computed based on the fixed part of the mixed-effects model by setting the random effects to zero. Such marginal predictions were expected to be biased. This bias was then corrected by applying an empirical ratio estimator suggested by Snowdon (1991), so that the marginal predictions were multiplied by the ratio of the mean of the cover observed in the modelling data and the mean of the marginal predictions.
The berry yields were predicted based on the predicted percentage cover in different types of sites using the models of Miina et al. (2009) for bilberry and Turtiainen et al. (2013) for lingonberry. Miina et al. (2009) fitted the bilberry yield model to the number of bilberries recorded in a total of 32 NFI10 stands in 2006 in North Karelia. In each stand, the number of berries and the percentage cover of bilberry were recorded in four 1-m2 quadrats, and the site and stand characteristics were obtained from the NFI10 data. Because these data were from only one berry season, they calibrated the year effect of model to correspond to an average berry year during 2001–2007 using annual berry yield data collected from 51 “MASI” sample plots (Salo 1999). The network of MASI plots measured since 1999 is independent of the NFI, and it consists of the permanent sample plots located in stands in different areas of Finland. In each stand, the numbers of flowers, and unripe and ripe berries are counted annually in five 1-m2 quadrats. Separate bilberry yield models were used for pine and spruce dominated stands (Miina et al. 2009):
![]()

where BilberryP and BilberryS are the mean number of bilberries per m2 in pine and spruce dominated stands respectively; CoverB is bilberry cover (%); and G is the stand basal area (m2 ha–1). For deciduous trees, the model for pine-dominated stands was applied (Eq. 1). In a mixed stand, the number of bilberries was predicted as the weighted average of the species-specific predictions; for spruce, the weight (w) was Gs/(G+0.1), and for pine and deciduous trees 1–w, where Gs is the stand basal area of spruce, and G is the total stand basal area. Finally, the number of bilberries was converted into yield (kg ha–1) by multiplying it by the mean fresh weight of one berry (0.35 g) (Eronen 2004).
The lingonberry yield model followed Turtiainen et al. (2013):

where Lingonberry is the mean number of lingonberries per m2; CoverL is lingonberry cover (%); G is the stand basal area (m2 ha–1); Alt is altitude (m); and TS is temperature sum (dd).
The model was fitted using the yield data recorded in a total of 34 MASI stands in different parts of Finland between 2001 and 2011 (Turtiainen et al. 2013). Thus, the model predicts the average yield observed during these years. The predicted number of lingonberries was converted into the lingonberry yield (kg ha–1) by multiplying it by the mean fresh weight of one berry (0.23 g) (Ihalainen et al. 2003).
The MASI data mainly covered sites III and IV on mineral soils and were collected from stands most suitable for bilberry or lingonberry (Miina et al. 2009; Turtiainen et al. 2013). Due to unrepresentative modelling data, the berry yield predictions were calibrated to agree with the site type and location-specific berry yield levels presented by Turtiainen et al. (2005). Turtiainen et al. (2005) calculated these berry yield levels from the results of empirical berry yield studies for different development classes, site types and locations in Finland. Calibrating for site and location bias was conducted so that the patterns of berry yield predictions with respect to the characteristics of growing stock, especially stand basal area controlled by cuttings, were maintained. On peatlands, empirical data on bilberry and lingonberry yields are scarce (Turtiainen et al. 2007) and thus, only rough constant estimates for post-drainage succession phases (i.e., recently drained, transforming phase, transformed phase) were applied there as presented by Turtiainen et al. (2007, Tables 1 and 2). Depending on the site fertility of undrained mires, bilberry and lingonberry yields are 0–11.1 kg ha–1 and 0–10.0 kg ha–1 respectively. On recently drained and transforming peatlands, bilberry yields are 1.1–5.4 kg ha–1, and lingonberry yields 1.4–3.6 kg ha–1. On transformed peatlands, both bilberry and lingonberry yields are 2.1 kg ha–1.
On mineral soil sites, the evaluation and calibration of berry yield predictions were conducted as follows. First, the annual berry yields were predicted along a full rotation of stands growing in various site types and locations in Finland, and the mean berry yields (kg ha–1 year–1) during the rotation were calculated. The full rotation periods were simulations to calculate the average of the berry yields over all development classes (i.e., regeneration areas and seedling, thinning and mature stands). Berry yields were predicted for the following locations (and temperature sums): Sodankylä (650 dd), Rovaniemi (850 dd), Kuhmo (950 dd), Oulu (1050 dd), Joensuu (1200 dd) and Turku (1300 dd). At these locations, the development and management of forest stands growing on various site types were simulated using the Motti simulator (Salminen et al. 2005; Hynynen et al. 2014). Stand management followed the silvicultural recommendations (Äijälä et al. 2019). The development of spruce stands was simulated on Sites II–III, and that of pine stands on Sites III–V. On Sites IV and V, pine stands were naturally regenerated, whereas artificial regeneration was used on Sites II and III. Second, the ratios between the empirically derived mean berry yields presented by Turtiainen et al. (2005, Table 4) and predicted for the simulated stands were calculated. Third, the ratios (scaling factors) were modelled as a function of site type and temperature sum (location). The resulting berry yields predicted by the cover and yield models presented in this study were calibrated using the following models:


where FactorB and FactorL are scaling factors, which were used to multiply bilberry and lingonberry yield predictions respectively; Site is the categorical variable for the fertility of mineral soil sites; and TS is the temperature sum (dd).
2.1.2 Large-scale prediction of the average cover and total berry yield
The large-scale predictions for the average cover and total yield of bilberry and lingonberry in Finland were carried out using the Finnish forestry dynamics model MELA (Packalen et al. 2017). The berry models and the sample plot data of the 12th NFI (NFI12), measured between 2014 and 2018 were linked to the MELA programme. On average, the NFI forest data represented the year 2016, which was the starting point of the analyses. Finland is divided into 19 regions. Regional estimates of the average cover of a given berry species were calculated by turning the predicted cover into the area occupied by the berry species in each NFI sample plot and comparing the species-occupied area to the total area represented by the NFI sample plots in each region. The regional estimates of the total berry yield were calculated in the same way. In this study, results for average cover and berry yield in forest land (increment at least 1 m3 ha–1 year–1) are presented for the whole country, and separately for South and North Finland. North Finland covers the Kainuu, North Ostrobothnia and Lapland regions, and South Finland the remaining regions.
Using the MELA programme and the NFI12 data, different forest management scenarios were used to illustrate the effects of alternative cutting scenarios on the average species cover and total berry yields. We used the following previously defined scenarios (http://mela2.metla.fi/mela/tupa/tupaindex-en.htm, accessed 16 April 2021):
Business as usual (BAU): The net present value is maximised with a 4% discount rate subject to realised harvest removals by timber assortments. This scenario outlines the development of forest resources if the roundwood and energy wood harvesting levels realised in 2016–2018 are carried out in the future.
Maximum sustained yield (MaxSus): The net present value is maximised with a 4% interest rate subject to non-declining periodic total roundwood and energy wood removals, saw log removals, and net income between subsequent periods.
Maximum economic cuttings (MaxEco): The net present value is maximised with a 5% interest rate without taking into account any constraints on sustained yield or the demand for wood products. Each forest stand is harvested when it is eligible for harvesting according to silvicultural recommendations (Äijälä et al. 2019), and which do not fulfil the economic prerequisite (5% interest rate) for further growth. This scenario defines the maximum short-term economic timber supply.
2.2 Inventory-based estimates on the cover and yield in Sweden
2.2.1 Assessing the cover and berries in the NFI
In the Swedish NFI, randomly placed systematic field samples are distributed across the whole country. The sample consists of either permanent or temporary plots located in square or rectangular clusters. The vegetation cover has been measured annually since 1993: between 1993 and 2007, only on productive forest land and in coniferous forests on mountains, then also on peatlands (2008–2017), and since 2018, also on low-productive land with rocks and grazing land. The cover of bilberry and lingonberry is measured in half the permanent sample plots, using 100 m2 circular plots in the centre of the NFI plot. If the plot is split so that the vegetation area is less than 5 m2, no inventory is performed. The cover refers to the plant’s vertical projection on the ground, excluding gaps in the foliage, and is registered at 1-m2 accuracy.
Since 2003, the inventory of berries has been integrated in the Swedish NFI (Fridman et al. 2014). Observations of bilberries and lingonberries are made in sample plots in the following land-use classes: productive forest land; grazing land; mire; low-productive rocky land; coniferous forests on mountains; mountain areas; and powerlines. Between 2003 and 2010, the berry inventory was executed in only half the permanent sample plots, and since 2011, in both permanent and temporary sample plots (except in 2017, when only half the permanent sample plots were measured). The berries are assessed in two 0.25-m² circular sub-plots located 2.5 m from the centre of the NFI sample plot, using angles of 45 (right) and 225 (left) degrees from the original walking direction. Assessments are made of the occurrence of living plants (yes/no), the height of bilberry plants, and the stage of development (i.e., before flowering, flowering, unripe berries, ripe berries, or shed berries). Flower and berry numbers are counted. Between 2006 and 2017, the number of flowers and berries was counted in plots with the development stages of flowering, unripe, and ripe berries, but since 2018, the counting has only been done when berries are ripe. The stage of development is determined based on the stage of the majority of berry plants inside the plot, but it can also be evaluated from the vegetation around the plot if flowers and/or berries are missing from it. For more details, see Riksinventering av skog, Fältinstructions 2020 (2020).
2.2.2 Estimating the average cover and total berry yields
In the Swedish NFI, the estimation of totals and means is based on the ratio estimators with respect to the area assessed in relation to the total area (the area data obtained from the Swedish Land Survey). The estimators used vary between years and plot type (permanent or temporary), and a weighting procedure is therefore applied when calculating the averages over the years. The Swedish NFI estimators are described in more detail by Fridman et al. (2014, Appendix B).
Berry yields are determined by both berry number per m2 and fresh weight in kg per m2, linked by conversion rates based on the annual data measured in experimental plots in the research parks of Swedish University of Agricultural Sciences (SLU). In these experimental plots, berries are counted and weighted, and this relationship is used to convert the number of berries counted annually on the NFI sample plots to the berries’ fresh weight.
Since the NFI is counting berries over the long season, the number of uncountable berries (i.e., eaten, picked, shed, etc.) is considered in the final calculations of the annual yield. This is done by using species-wise correction factors, based on the relationship between data of 12-year berry prognoses (2006–2017) made in SLU and the total calculated yields from the same years, i.e., berry yield prognoses (see below) based on early season measurements is compared to final calculated berry yields from the same year. According to these calculations, the actual total yield of bilberry and lingonberry is about 22% and 1% higher, respectively, than that assessed in the NFI (Riksskogstaxeringen 2020). However, in the official statistics, only the bilberry yield is corrected, with a factor of 1.2195.
SLU annually reports the percentage cover (since 2017) and berry yields (since 2018) of bilberry and lingonberry in forest land at the regional and national levels in Skogsdata (official statistic of Sweden). Percentage cover is reported as an average of the last ten years in forests land and productive forest land excluding conservation areas, and berry yields as an average of the last five years in forest land excluding conservation areas (Skogsdata 2020 2020). In this study, we calculated the average percentage cover in productive forest land between 2010 and 2019, including conservation areas (Riksskogstaxeringen 2020). The dataset used in analysis included 62 764 NFI plots. Respectively, we calculated the average total bilberry and lingonberry yields in productive forest land between 2015 and 2019, including conservation areas (Riksskogstaxeringen 2020). The dataset included 31 843 NFI plots, where the number of bilberries were counted in 6644 plots, and lingonberries in 5442 plots.
Until 2017, the berry prognoses, i.e., the estimates of the coming berry season’s crop, were based on the observations of seasonal flowering and berry ripening. The estimating (or forecasting) the coming berry season’s crop using the information collected in the flowering phase is not straightforward. The number of flowers and unripe berries counted in the NFI plots was converted to the number of ripe berries using information on seasonal berry ripening. For this, a network of permanent sample plots in SLU’s research parks was visited at the time of flowering and unripe and ripe berries to collect data on berry ripening. In 2006–2017, this approach was used to estimate the total berry yields and to make prognoses during the season. SLU published the regional annual berry yield prognoses in June for bilberry and in August for lingonberry. Since 2018, due to lack of resources for assessing the experimental plots, berry yield has been estimated based on only the ripe berries counted in the NFI, and no prognoses for seasonal production have been made (Sveriges lantbruksuniversitet 2019).
3 Results
3.1 Bilberry and lingonberry in Finland
3.1.1 Vegetation cover
According to the cover models fitted (Tables 2 and 3), the highest bilberry cover was found in mesic forests (Site III), and that of lingonberry in sub-xeric forests (Site IV). Bilberry and lingonberry cover increased with stand age and stand basal area up to the ages of 168 and 130 years, and a density of 25 and 20 m2 ha–1 respectively, after which cover gradually decreased. The dominance of pine as a tree species significantly promoted the abundance of both bilberry and lingonberry. Negatively correlated temperature sum and altitude (r = –0.79) were significant predictors of the abundance of lingonberry, describing large-scale geographical variation in lingonberry cover in Finland.
| Table 2. Parameter estimates and goodness-of-fit statistics of the multi-level quasi-Poisson models estimated for the percentage cover of bilberry in the Finnish PSP3000 data (N = 2199). Sites I–VIII refer to different site quality classes (see Table 1). | ||
| Variable | Estimate | Std. error |
| Intercept | 0.7185*** | 0.0869 |
| Site I, mineral soils | –1.8948*** | 0.3290 |
| Site II, mineral soils | –0.9147*** | 0.0863 |
| Site III, mineral soils | 0.0 a | -- |
| Site IV, mineral soils | –0.5696*** | 0.0614 |
| Site V, mineral soils | –1.6221*** | 0.2058 |
| Site VI, mineral soils | –3.0 b | -- |
| Site VII, mineral soils | –1.0172*** | 0.2146 |
| Sites I–II, spruce mires | –1.5157*** | 0.2843 |
| Sites III, spruce mires | –0.5228*** | 0.1223 |
| Sites IV, spruce mires | –0.7371*** | 0.2022 |
| Sites I–III, pine mires | –0.8469*** | 0.2227 |
| Site IV, pine mires | –0.7566*** | 0.1356 |
| Site V, pine mires | –1.9882*** | 0.2138 |
| Site VI–VII, pine mires | –3.0 b | -- |
| Site VIII, poorly productive land | 1.3769*** | 0.2227 |
| Site VIII, waste land | 0.2147 | 0.3191 |
| Pine on sites II–III, mineral soils & mires c | 0.1309** | 0.0551 |
| Deciduous trees on sites I–II, mineral soils & mires c | –0.4619* | 0.1633 |
| Stand age (years) | 0.0142*** | 0.0014 |
| Stand age2/1000 (years) | –0.0422*** | 0.0059 |
| Stand basal area (m2 ha–1) | 0.1138*** | 0.0090 |
| Stand basal area2 (m2 ha–1) | –0.0023*** | 0.0002 |
| Variance components at cluster level (N = 912) | 0.3712 | |
| Snowdon’s bias correction ratio | 1.12 | |
| Pearson correlation coefficient (predicted vs measured) | 0.61 | |
| Proportion of explained variance R2 | 37.1% | |
| Root mean square error RMSE (relative RMSE) | 10.7 (116%) | |
| a = Site III on mineral soils was the reference. b = Not estimated due to few or no observations, and ad-hoc parameters were set. c = Spruce as the dominant tree species was the reference. *, **, *** = Significant at the 0.05, 0.01 and 0.001 levels, respectively. | ||
| Table 3. Parameter estimates and goodness-of-fit statistics of the multi-level quasi-Poisson models estimated for the percentage cover of lingonberry in the Finnish PSP3000 data (N = 2199). Sites I–VIII refer to different site quality classes (see Table 1). | ||
| Variable | Estimate | Std. error |
| Intercept | 2.1192*** | 0.0960 |
| Site I, mineral soils | –2.8116*** | 0.4719 |
| Site II, mineral soils | –1.3939*** | 0.1083 |
| Site III, mineral soils | –0.2216*** | 0.0556 |
| Site IV, mineral soils | 0.0 a | -- |
| Site V, mineral soils | –0.3011** | 0.1051 |
| Site VI, mineral soils | –0.3 b | -- |
| Site VII, mineral soils | –0.3 b | -- |
| Sites I–II, spruce mires | –1.2713*** | 0.2226 |
| Sites III, spruce mires | –0.5535*** | 0.1378 |
| Sites IV, spruce mires | –0.3888* | 0.1733 |
| Sites I–III, pine mires | –0.8543*** | 0.1825 |
| Site IV, pine mires | –0.4815*** | 0.0958 |
| Site V, pine mires | –1.2542*** | 0.1181 |
| Site VI–VII, pine mires | –2.8 b | -- |
| Site VIII, poorly productive land | –0.4973* | 0.2392 |
| Site VIII, waste land | –1.5922*** | 0.4142 |
| Spruce on sites I–III, mineral soils & spruce mires c | –0.2273*** | 0.0614 |
| Deciduous trees on sites I–III, mineral soils & spruce mires c | –0.3203*** | 0.0888 |
| Altitude (m) | –0.0029*** | 0.0005 |
| ln(Temperature sum/1000) (dd) | –1.4225*** | 0.2289 |
| Stand age (years) | 0.0050*** | 0.0013 |
| Stand age2/1000 (years) | –0.0193*** | 0.0053 |
| Stand basal area (m2 ha–1) | 0.0635*** | 0.0078 |
| Stand basal area2 (m2 ha–1) | –0.0016*** | 0.0002 |
| Variance components at cluster level (N = 912) | 0.1975 | |
| Snowdon’s bias correction ratio | 1.06 | |
| Pearson correlation coefficient (predicted vs measured) | 0.50 | |
| Proportion of explained variance R2 | 25.0% | |
| Root mean square error RMSE (relative RMSE) | 6.6 (98%) | |
| a = Site IV on mineral soils was the reference. b = Not estimated due to few or no observations, and ad-hoc parameters were set. c = Pine as the dominant tree species was the reference. *, **, *** = Significant at the 0.05, 0.01 and 0.001 levels, respectively. | ||
The rotation-length development of bilberry and lingonberry cover was predicted with the development and management of stands in different site fertility classes at different locations (Fig. 1, Sodankylä, Finland). The cover models logically predicted increasing cover with stand ageing. The superiority of mesic (Site III) and sub-xeric sites (Site IV) for the cover of bilberry and lingonberry respectively was evident at each studied location.
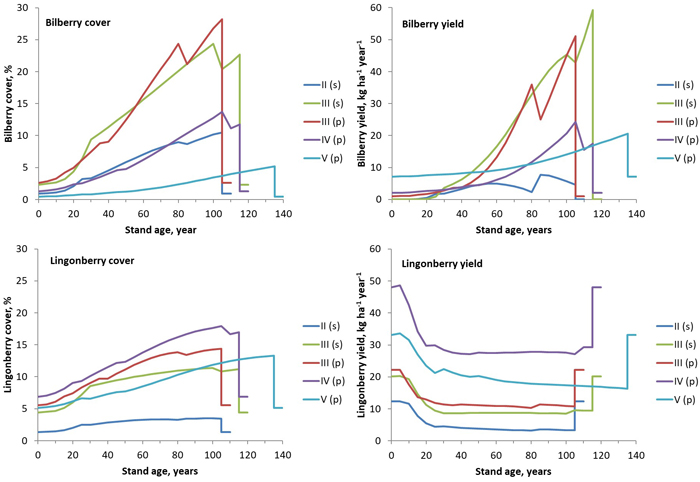
Fig. 1. Simulated cover (left) and yield (right) of bilberry (above) and lingonberry (below) in stands in different fertility classes in Sodankylä in North Finland. The full rotation periods including a final cut at the end were simulated. Site fertility: II = herb-rich sites, III = mesic sites, IV = sub-xeric sites, and V = xeric sites. Dominant tree species: s = spruce, p = pine. View larger in new window/tab.
Based on the berry models and the NFI12, the average percentage cover of bilberry and lingonberry in Finnish mineral soil forests was estimated to be 10.9% and 6.9%, respectively (Fig. 2). The corresponding figures presented by Tonteri et al. (2005), who also used the PSP3000 data, were 8.2% and 6.5%, respectively. Despite the higher average cover, our models underestimated the cover in the most suitable sites for bilberry (Site III) and lingonberry (Sites IV and V). According to our predictions, the average cover of both bilberry and lingonberry is higher in North Finland than South Finland.
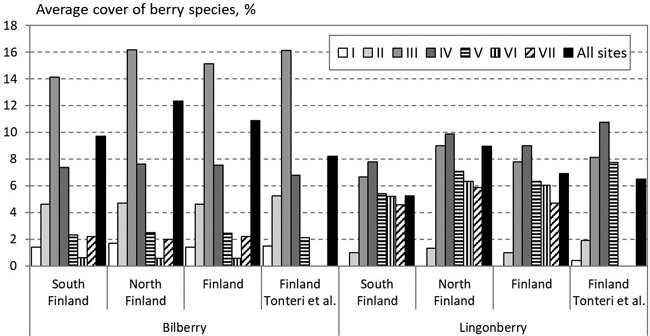
Fig. 2. The average cover of bilberry (left) and lingonberry (right) in different site types on mineral soils predicted based on the NFI12 data in South and North Finland and the whole country and measured in the whole country by Tonteri et al. (2005). The data for Sites VI and VII were not presented by Tonteri et al. (2005).
3.1.2 Berry yields
In stand-scale simulations, bilberry yields also increased with stand ageing (Fig. 1). Spruce as a dominant tree species had a negative effect on bilberry yield in southern locations, but not in the north due to sparser stands. The lingonberry yield was highest on regeneration areas and in small seedling stands. The lingonberry yield level decreased strongly with increasing stand basal area (at an age of 5–30 years), after which it was relatively constant and increased only slightly after thinnings.
Based on the NFI12, the national berry crops were estimated to be 208 Mkg of bilberry and 246 Mkg of lingonberry (Fig. 3). The total berry yields predicted for peatlands were 16.5 Mkg of bilberry and 15.4 Mkg of lingonberry (Fig. 3).
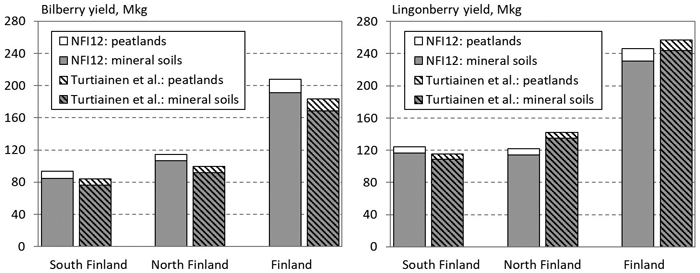
Fig. 3. The total annual yield of bilberry (left) and lingonberry (right) in forest land in South and North Finland, and the whole country. Prediction based on the NFI12 data and estimated by Turtiainen et al. (2005, 2007).
3.1.3 Effects of forest management scenarios on bilberry and lingonberry
In the end of 30-year-long simulation period, the bilberry cover varied considerably between the alternative forest management scenarios (Fig. 4). In the MaxEco and MaxSus scenarios, the average bilberry cover decreased by up to 1.3%-units and 0.6%-units respectively; in the BAU scenario, the bilberry cover increased by up to 1.1%-units. Compared with bilberry, the average lingonberry cover varied less between the alternative scenarios. In all scenarios, the lingonberry cover slightly decreased, except in the BAU scenario, where the cover increased in North Finland.
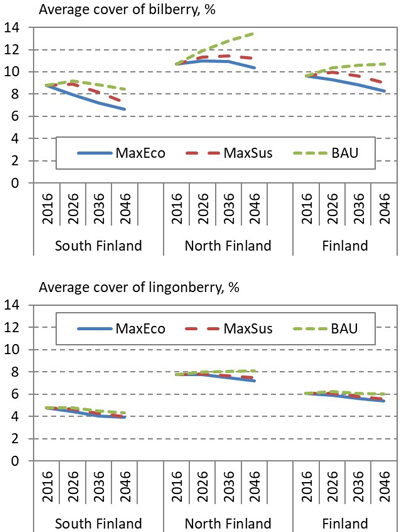
Fig. 4. Development of the average cover of bilberry (above) and lingonberry (below) in South and North Finland and the whole country, according to alternative 30-year regional forest scenarios: Maximum economic removal (MaxEco); Maximum sustainable yield (MaxSus); and Realised cutting removals (BAU).
The scenarios likewise affected the cover and yield of bilberry (Fig. 5). The lowest lingonberry yields were obtained in the BAU scenario, which in turn resulted in the highest lingonberry cover. In general, the development of the cover and yield of bilberry and lingonberry were related to the intensity of cuttings in the alternative scenarios (Fig. 6). In the BAU scenario, due to lower removals, the growing stock volume over 30 years increased more than in other scenarios, which was favourable to bilberry, whereas higher removals in the MaxEco and MaxSus scenarios favoured lingonberry.
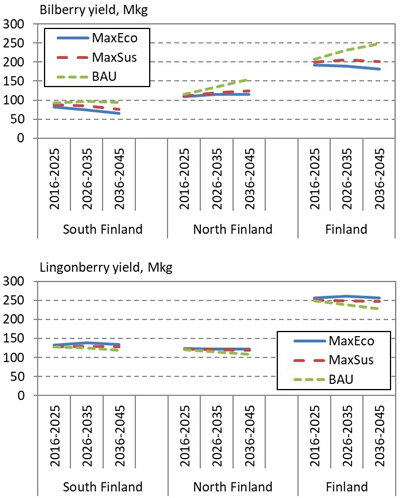
Fig. 5. Development of the total annual yield of bilberry (above) and lingonberry (below) in South and North Finland, and the whole country, according to the NFI12 data and alternative 30-year regional forest scenarios: Maximum economic removal (MaxEco); Maximum sustainable yield (MaxSus); and Realised cutting removals (BAU).
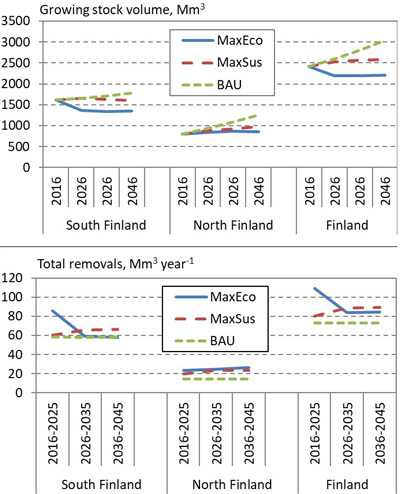
Fig. 6. Development of the volume of growing stock (above) and removals (below) in South and North Finland, and the whole country, according to the NFI12 data and alternative 30-year regional forest scenarios: Maximum economic removal (MaxEco); Maximum sustainable yield (MaxSus); and Realised cutting removals (BAU).
3.2 Bilberry and lingonberry in Sweden
3.2.1 Vegetation cover
The average percentage cover in productive forest land between 2010 and 2019, including conservation areas is presented in Table 4 and Fig. 7. The cover of bilberry and lingonberry varied between regions and was highest in northern Sweden. In general, during these years, bilberry and lingonberry cover had very similar relative variability (coefficient of variation) (Table 4). Bilberry cover increased with increasing the age of the forest and was highest in site index classes (Hägglund and Lundmark 1977) 19–26 and lowest if the site index was higher than 34 (Fig. 7, upper left). Lingonberry cover was highest in very old forests and in forests aged between 40 and 70 years, especially when the site index was lower than 22 (Fig. 7, lower left). The relative standard error based on 5 years moving average was 3.6% for bilberry and 3.9% for lingonberry.
| Table 4. Estimated percent cover (%) of bilberry and lingonberry in productive forest land in Sweden (including conservation areas). The values are the averages of cover estimated between 2010 and 2019, and are weighted by area. CV = coefficient of variation. | ||||||||||
| Bilberry cover (%) | Lingonberry cover (%) | |||||||||
| NNorr | SNorr | Svea | Göta | Sweden | NNorr | SNorr | Svea | Göta | Sweden | |
| Mean | 13.8 | 12.6 | 10.2 | 7.1 | 11.2 | 10.6 | 8.6 | 6.4 | 3.1 | 7.5 |
| SD | 0.9 | 1.9 | 1.1 | 1.1 | 0.7 | 1.2 | 1.3 | 0.6 | 0.7 | 0.5 |
| CV | 0.07 | 0.15 | 0.11 | 0.16 | 0.07 | 0.11 | 0.16 | 0.09 | 0.23 | 0.07 |
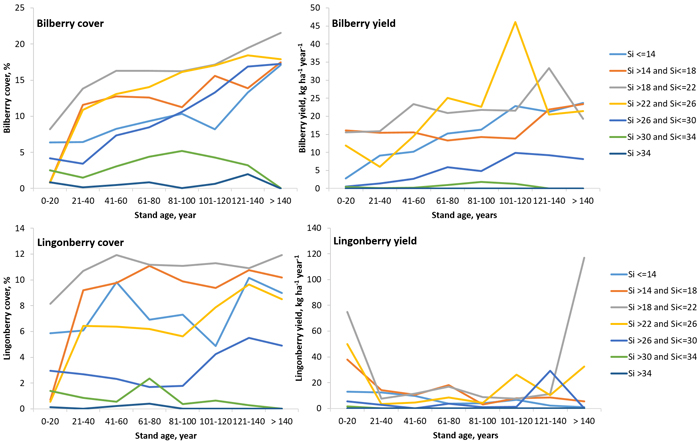
Fig. 7. The average estimated cover (left) and yield (right) of bilberry (above) and lingonberry (below) in different site indices (Si) and stand age classes based on the Swedish NFI data from 2015–2019. View larger in new window/tab.
3.2.2 Berry yields
The average total bilberry and lingonberry yields in productive forest land between 2015 and 2019, including conservation areas is presented in Table 5 and Figs. 7 and 8. The average total yields were 336 Mkg of bilberry and 382 Mkg of lingonberry, and varied between 142 and 565 Mkg, and 107 and 637 Mkg. During these years, lingonberry yields had a higher relative variability (coefficient of variation) than bilberry yields (Table 5). The average total bilberry yield increased from south to north, but the average total lingonberry yield was slightly higher in South Norrland than North Norrland during this review period (Fig. 8). The highest bilberry yield was produced in site index classes 23–26 in forests aged between 100 and 120 years, and in site index classes 19–22 in forests aged between 120 and 140 years (Fig. 7, upper right). The highest lingonberry yield was produced in clear-cuts and very young forests in site index classes 15–26, and in very old forests in site index classes 17–22 (Fig. 7, lower right). The estimation error of berry production consists of the sampling error, the measurement error as well as the error when converting number of berries to weight (and flowers or raw berries to ripen berries). Due the complexity of berry yield estimation, the standard error for berry production is not yet a part of the reporting of the Swedish NFI as for vegetation cover.
| Table 5. Estimated total annual yield of bilberry and lingonberry in productive forest land in Sweden (including conservation areas). NNorr = North Norrland, SNorr = South Norrland, Svea = Svealand, Göta = Götaland. CV = coefficient of variation. | ||||||||||
| Bilberry (Mkg) | Lingonberry (Mkg) | |||||||||
| Year | NNorr | SNorr | Svea | Göta | Sweden | NNorr | SNorr | Svea | Göta | Sweden |
| 2015 | 193 | 162 | 110 | 96 | 565 | 95 | 144 | 63 | 108 | 410 |
| 2016 | 194 | 179 | 91 | 58 | 522 | 253 | 195 | 138 | 8 | 595 |
| 2017 | 160 | 36 | 21 | 22 | 238 | 278 | 296 | 39 | 25 | 637 |
| 2018 | 95 | 77 | 41 | 3 | 216 | 25 | 65 | 15 | 3 | 107 |
| 2019 | 62 | 34 | 25 | 21 | 142 | 45 | 46 | 46 | 22 | 159 |
| Mean | 141 | 98 | 58 | 40 | 336 | 139 | 149 | 60 | 33 | 382 |
| SD | 60 | 69 | 40 | 37 | 193 | 118 | 102 | 47 | 43 | 243 |
| CV | 0.42 | 0.70 | 0.70 | 0.93 | 0.57 | 0.85 | 0.68 | 0.78 | 1.30 | 0.64 |
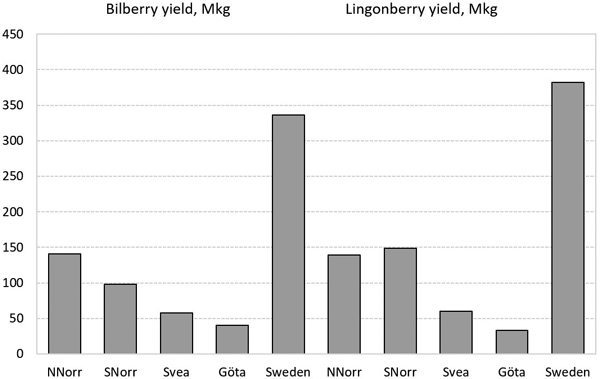
Fig. 8. The average of estimated total annual yields between 2015 and 2019 in productive forest land in Sweden (including conservation areas). NNorr = North Norrland, SNorr = South Norrland, Svea = Svealand, Göta = Götaland.
3.3 Comparison of the results in Finland and Sweden
Though the assessment methods for cover and berry yield are different, the estimated values correspond well each other in Finland and Sweden. For example, the highest cover and yield of bilberry were found in sites of medium fertility, and those of lingonberry in less fertile sites. In both countries, the cover of bilberry and lingonberry was higher in north than in south. Both simulated and inventoried vegetation cover and bilberry yield increased along the stand ageing (Figs. 1 and 7). In simulations, thinnings cause only temporal changes in cover and yields, but drastic changes are caused by regeneration cuttings in the end of rotation (Fig. 1). The Swedish NFI indicates the similar changes in cover and yield when the results of mature and young age classes are compared (Fig. 7).
The highest lingonberry yields were found in the beginning of the rotation and in mature stands on the most suitable sites in Sweden (Fig. 7). Both simulated and inventoried results indicate that lingonberry occurs frequently in mature stands, but the plants are mainly sterile under the canopy layer of mature trees. Compared to the Swedish inventory data, the Finnish model may underestimate lingonberry yields at the end of stand rotation, especially in sparse mature stands. In dense mature stands, however, lingonberry yields are expected to remain low.
The total annual yields were estimated to be 208 Mkg of bilberry and 246 Mkg of lingonberry in Finland, and 336 and 382 Mkg respectively in Sweden. Thus, the total yields of both bilberry and lingonberry in Sweden were estimated to be 1.6 times that of Finland. The difference is partly due to the larger forest area of Sweden, but probably also the variation of site and climatic conditions, stand structures, etc. between the countries.
4 Discussion
4.1 Evaluation and comparison of assessment methods
The model-based method used in Finland and the field inventory method used in Sweden were described to assess the regional and national percentage cover and yield of bilberry and lingonberry in these two countries. The model-based method was also linked to the stand- and regional-level forest simulators to assess the effects of alternative forest management scenarios on the cover and yields of bilberry and lingonberry. The main advantage of the inventory-based method is that it produces seasonal estimates which can be used to evaluate the changes over the time and in a forecasting system aimed at large public and berry enterprises.
In model-based calculations, the current silvicultural treatments were assumed to be used also in the future, and their effects on vegetation cover and berry yield were assumed to be similar to those observed in the past (i.e., in the modelling data sets). In general, increasing the intensity of cuttings will also increase the use of the relevant silvicultural treatments according to silvicultural guidelines. The simulated effects of cuttings on bilberry and lingonberry cover as well as the recovery of these species after regeneration cutting were in line with the Finnish empirical results. According to Tonteri et al. (2016), after regeneration cutting semi-shade tolerant bilberry decreased strongly (>70%) in cover and recovered relatively slowly. More light-tolerant lingonberry decreased also after regeneration cutting, but recovered relatively fast, reaching its old-forest cover level in about 30 years. Also, the interpretation of the bilberry cover model estimated in this study was comparable with the nationwide model of the bilberry cover in Norway estimated by Eldegard et al. (2019).
The berry yield models of Miina et al. (2009) and Turtiainen et al. (2013) used in this study have been evaluated earlier. Turtiainen (2015) compared the yield predictions with those of the empirical yield models presented by Ihalainen et al. (2003) and found the correlation of 0.79 for bilberry and 0.52 for lingonberry. Kilpeläinen et al. (2016) evaluated the models using independent empirical data and found that the predictions were biased for both bilberry (relative bias 57%) and lingonberry (–157%), indicating the need for calibration before applying them in forest decision support systems. In this study, the berry yield models were calibrated using the results of empirical yield studies, and thus the model predictions can be expected to be more accurate than those of the original models. However, further model evaluation and especially more berry yield data are needed, for example, to model the berry yields also in deciduous stands and peatland forests as well as to verify the magnitude of the increase in lingonberry yields despite the decreasing cover after regeneration cutting (cf., Raatikainen et al. 1984).
The total berry yields predicted in this study were in line with the values estimated earlier by Turtiainen et al. (2007): 208 vs 184 Mkg of bilberry and 246 vs 257 Mkg of lingonberry annually. The total yields on peatlands were close to the values estimated by Turtiainen et al. (2007) since the same site-specific berry yields per ha were also used in our predictions, and only the areas of different peatland site groups (undrained, recently drained, transforming, and transformed) have changed between the NFI12 used in this study and the NFI9 (1996–2003) used by Turtiainen et al. (2007). In mineral soil sites, the predicted bilberry yields were slightly higher, and lingonberry yields slightly lower, especially in northern Finland, than those calculated by Turtiainen et al. (2005). The model-based estimation approach presented here promises significant improvement to the earlier one (Turtiainen et al. 2005, 2007) in which the mean berry yield and regional areas of different site types were utilised for both mineral soils and peatlands. In addition, the vegetation cover models for bilberry and lingonberry were applied for the first time to calculate the impact of forest management scenarios on the average percentage cover in both mineral soils and peatlands in Finland.
Important lessons were learnt for developing further the model-based approach. Due to the lack of berry yield data from peatland forests, we used – like Turtiainen et al. (2007) – the mean berry yields in different peatland site types and post-drainage succession phases. Berry yield in drained peatlands (2.1 kg ha–1) was probably underestimated, because the vegetation cover of both berry species increases along with the post-drainage succession phases (Reinikainen et al. 2000; Lõhmus and Remm 2017). The model-based approach predicts berry yield without considering the annual and among-site variation in the number and weight of berries (Turtiainen et al. 2011); however, this can be sufficient for long-term scenario analyses. It would be possible to estimate the current season’s berry yield using field measurements of flowering and berry ripening as was done in Sweden. Natural Resources Institute Finland (Luke) has initiated crowdsourced berry monitoring in cooperation with the Finnish 4H organisation (the Marjahavainnot.fi platform). The resulting seasonal data on flowering, unripe and ripe berries would enable to forecast and estimate the current year’s berry crops. Alternatively, weather factors such as temperature and precipitation affecting berry crops (Wallenius 1999) could be utilised in estimation in an indirect way; however, the berry production patterns found in different site and stand conditions are most probably inconsistent between years (cf., Fernández-Calvo and Obeso 2004). So far, the range of the seasonal berry crops in Finland can be assumed to agree with the total yields of poor and abundant crop years estimated by Turtiainen et al. (2011).
A disadvantage of complex simulation systems of many functions and parameters is that the uncertainty (bias and variance) in predictions due to model and measurement errors is not easy to assess (Kangas 1999). The precision of predictions could be estimated through Monte Carlo simulation, combining several error sources with different variances. Here, a straightforward method would be to analyse the observed errors by comparing the field-inventoried and predicted berry yields. Unfortunately, in our case berry yields were inventoried in Sweden and predicted in Finland. In the future, the model-based approach should be development so that also the accuracy and precision of predictions can be given.
The inventory approach used in Sweden is well-established and enables the annual estimation of the actual bilberry and lingonberry cover and yield, and therefore an evaluation of the changes over the time and by geographical areas down to sub-county level. Some more statistical analyses of berry cover data from the Swedish national forest inventory can be found in Skogsdata 2011 (2011) and Dahlgren and Fridman (2012). When calculating the annual yields, the number of berries is converted to fresh berry weight based on the data from SLU’s research parks. However, the number of study sites is currently low (only four and some annually varying sites) for precise annual estimates. Annual berry yield forecasts have not been undertaken since 2018 because of a lack of resources. Interest to restart the berry yield forecasts is high, because public and media interest in them has been great over the years. Assessing the berry yield development during the whole season would enable the exploration of the effect of weather on berry yields, for example, and thus calibrate the berry yield forecasts over the course of the season. The inventory and calculation methods in the Swedish NFI is constantly updated, including berry yields, which makes possible to get deeper and more accurate information of berry yields and their distribution.
The berry yield data collected in the Swedish NFI over several years would enable the development of berry yield models and apply the model-based approach for predicting berry yields also in Sweden. A spatially and temporally comprehensive modelling approach could then be implemented in existing forest planning systems, as in Finland. The model-based approach used in the Finnish MELA system could be applied in developing the Swedish forest planning system Heureka (Wikström et al. 2011).
The results of scenario calculations were presented to illustrate the regional-level forest planning situation to which the model-based approach can be applied. Analysing only the NFI data without predicting the future development and management of the forests, it is not possible to consider the future production possibilities of the forests. Based on the Swedish NFI data, Gamfeldt et al. (2013) calculated that there was a negative relationship between tree biomass production and bilberry production due to excessive shading in closed productive forests. At the individual stand level, the use of berry models has earlier been implemented by Miina et al. (2016), who optimised the stand management for the joint production of timber, bilberry and lingonberry. According to their results, in stands having good berry yields, longer rotation and heavier thinnings were optimal to reduce canopy shading to a level that is favourable for berry crops. At the forest holding scale, Kurttila et al. (2018) examined the relationships among various non-timber forest products (incl. berries) and timber production. Due to good lingonberry yields after regeneration cuttings, timber drain correlated positively with lingonberry production, whereas increasing the drain led to a drastic decrease in bilberry yields.
To provide spatially more accurate and timely information on seasonal berry yields for practical use in both Finland and Sweden, also combining berry inventories with wall-to-wall remote sensing data could be attempted to create spatially useful landscape and stand-level data on berry yield. Recently Bohlin et al. (2021) in Sweden and Nielsen et al. (2020) in Canada predicted the yield of Vaccinium species using airborne laser scanning (ALS) data. Bohlin et al. (2021) created a general prediction model for bilberry and lingonberry yields based on ALS data and other auxiliary data and identified the laser-based structural features of forests that can be linked to locations of the highest berry yields. They used over 13 000 field plots from Swedish NFI and wall-to-wall data over the whole Sweden and took account also the reduction of berries during the season. They found, for example, that the laser-based canopy cover of circa 50% indicated the highest bilberry yield and canopy cover close to zero highest lingonberry yield. Their method can be used to identify the most potential locations for berry picking in forest landscape, and therefore support decision making in forest management. Recently, also models for vegetation cover of bilberry and lingonberry have been prepared using the Swedish NFI and remote sensing data in SLU, but no publications are available yet.
4.2 Recommendations for improving the assessment of the berry yields
The permanent sample plots of the Finnish NFI could be better utilised in berry yield modelling if besides vegetation cover the number of berries was also monitored in the sample plots as done in the Swedish NFI. Such nationwide data would make it possible to develop more reliable yield models and better model the berry yields on peatlands.
The crowdsourced berry yield (Marjahavainnot.fi) and forest resources data sets could be utilised to analyse the annual variation in berry crops, include it into the model predictions and to evaluate the Finnish berry yield models.
Considering the different site and climatic conditions and stand structures, the Finnish berry models must be evaluated by comparing model-based predictions and berry yields inventoried, for example, on the Swedish NFI plots.
In the Swedish inventory-based method, the number of sites measuring the fresh berry weights for the annual berry yield calculations should be increased to better capture the annual variation in berry yields.
Currently, in the Swedish NFI only ripe berries are inventoried to estimate seasonal berry yields. However, to forecast the current season’s berry crops, counting the flowers and unripe berries on the NFI plots is also needed.
The berry yield data collected in the Swedish NFI over several years could be utilised in modelling. As done in the Finnish forest planning systems (Motti and MELA), the berry models could then be linked to the Swedish forest planning system Heureka to analyse the impacts of forest management scenarios on berry crops also in Sweden.
To provide spatially more accurate and timely information on seasonal berry yields, also combining berry inventories with wall-to-wall remote sensing data could be attempted to create spatially useful landscape and stand-level data on berry yield (Bohlin et al. 2021). This kind of berry maps can be used to locate and map the potential berry forests for picking.
5 Conclusions
In providing spatially and timely more accurate information on berry yield, the assessment of berry yield should involve the elements of both inventory-based and model-based approaches. For example, information on seasonal berry yields can supplement the model-based approach to also include annual variation in berry yields. On the other hand, a quantitative evaluation of the impact of forest management alternatives on wild forest berries calls for reliable berry models to be linked to both stand- and regional-level forest planning systems. Stand- and forest holding-level results on the joint-production of timber and berries could be used especially in managing forest stands that are suitable for both timber and berry production. Information on the location of potential berry forests and seasonal abundance of berry yield could be utilised by large public and berry enterprises.
Acknowledgements
The research work was supported by the projects ‘New Products from Forests’ (project A72143) funded by the European Regional Development Fund; ‘Distributed, Integrated and Harmonised Forest Information for Bioeconomy Outlooks (DIABOLO)’ funded by the European Union’s Horizon 2020 research and innovation programme under Grant No. 633464; ‘Solutions for sustainable forest uses’ funded by Luke and ‘Adding value of non-wood forest product as part of ecosystem services: Improving berry yield prediction and mapping’ funded by Formas (2016-20056).
References
Äijälä O, Koistinen A, Sved J, Vanhatalo K, Väisänen P (2019) Metsänhoidon suositukset. [Forest management recommendations]. Tapion julkaisuja.
Bohlin I, Maltamo M, Hedenås H, Lämås T, Dahlgren J, Mehtätalo L (2021) Predicting bilberry and cowberry yields using airborne laser scanning and other auxiliary data combined with National Forest Inventory field plot data. For Ecol Manage 502, article id 119737. https://doi.org/10.1016/j.foreco.2021.119737.
Dahlgren J, Fridman J (2012) Här trivs blåbär och lingon bäst. [Here thrive bilberry and lingonberry best]. In: Skog & Mark 2012 – Om tillståndet i svensk landmiljö. Naturvårdsverket, pp 24–26.
Eldegard K, Scholten J, Stokland JN, Granhus A, Lie M (2019) The influence of stand density on bilberry (Vaccinium myrtillus L.) cover depends on stand age, solar irradiation, and tree species composition. For Ecol Manage 432: 582–590. https://doi.org/10.1016/j.foreco.2018.09.054.
Eronen S (2004) Flowering and berry crops of blueberry (Vaccinium myrtillus) and lingonberry (V. vitis-idaea) in 1997–2003. Thesis for degree programme in forestry. North Karelia Polytechnic, Joensuu.
Fernández-Calvo IC, Obeso JR (2004) Growth, nutrient content, fruit production and herbivory in bilberry Vaccinium myrtillus L. along an altitudinal gradient. Forestry 77: 213–223. https://doi.org/10.1093/forestry/77.3.213.
Fredman P, Mossing A, Sandell K, Stenseke M (eds) (2013) Friluftsliv i förändring: resultat från ett forskningsprogram. [Outdoor life in change: results from research program]. Slutrapport. Naturvårdsverket, Stockholm, Sweden, Rapport 27. ISBN 978-91-620-6547-8.
Fridman J, Holm S, Nilsson M, Nilsson P, Ringvall AH, Ståhl G (2014) Adapting National Forest Inventories to changing requirements – the case of the Swedish National Forest Inventory at the turn of the 20th century. Silva Fenn 48, article id 1095. https://doi.org/10.14214/sf.1095.
Gamfeldt L, Snäll T, Bagchi R, Jonsson M, Gustafsson L, Kjellander P, Ruiz-Jaen MC, Fröberg M, Stendahl J, Philipson CD, Mikusiński G, Andersson E, Westerlund B, Andrén H, Moberg F, Moen J, Bengtsson J (2013) Higher levels of multiple ecosystem services are found in forests with more tree species. Nat Commun 4, article id 1340. https://doi.org/10.1038/ncomms2328.
Haara A, Pykäläinen J, Tolvanen A, Kurttila M (2018) Use of interactive data visualization in multi-objective forest planning. J Environ Manage 210: 71–86. https://doi.org/10.1016/j.jenvman.2018.01.002.
Hägglund B, Lundmark J-E (1977) Site index estimation by means of site properties. Scots pine and Norway spruce in Sweden. Studia Forestalia Suecica 138. https://pub.epsilon.slu.se/5587/.
Hedwall PO, Gustafsson L, Brunet J, Lindbladh M, Axelsson A-L, Strengbom J (2019) Half a century of multiple anthropogenic stressors has altered northern forest understory plant communities. Ecol Appl 29, article id e01874. https://doi.org/10.1002/eap.1874.
Hynynen J, Salminen H, Ahtikoski A, Huuskonen S, Ojansuu R, Siipilehto J, Lehtonen M, Rummukainen A, Kojola S, Eerikäinen K (2014) Scenario analysis for the biomass supply potential and the future development of Finnish forest resources. The Finnish Forest Research Institute, Working Papers 302. http://urn.fi/URN:ISBN:978-951-40-2487-0.
Ihalainen M, Salo K, Pukkala T (2003) Empirical prediction models for Vaccinium myrtillus and V. vitis-idaea berry yields in North Karelia, Finland. Silva Fenn 37: 95–108. https://doi.org/10.14214/sf.513.
Johansson K (2016) Marknadsöversikt – frukt och grönsaker. [Market overview – fruits and vegetables]. Jordbruksverket, Rapport 22.
Jonsson BG, Dahlgren J, Ekström M, Esseen P-A, Grafström A, Ståhl G, Westerlund B (2021) Rapid changes in ground vegetation of mature boreal forests – an analysis of Swedish national forest inventory data. Forests 12, article id 475. https://doi.org/10.3390/f12040475.
Juutinen A, Kosenius A-K, Ovaskainen V, Tolvanen A, Tyrväinen L (2017) Heterogeneous preferences for recreation-oriented management in commercial forests: the role of citizens’ socioeconomic characteristics and recreational profiles. J Environ Plan Manage 60: 399–418. https://doi.org/10.1080/09640568.2016.1159546.
Kangas AS (1999) Methods for assessing uncertainty of growth and yield predictions. Can J For Res 29: 1357–1364. https://doi.org/10.1139/x99-100.
Kardell L (1980). Occurrence and production of bilberry, lingonberry and raspberry in Sweden’s forests. For Ecol Manage 2: 285–298. https://doi.org/10.1016/0378-1127(79)90055-0.
Kärkkäinen L, Haakana H, Hirvelä H, Lempinen R, Packalen T (2020) Assessing the impacts of land-use zoning decisions on the supply of forest ecosystem services. Forests 11, article id 931. https://doi.org/10.3390/f11090931.
Kilpeläinen H, Salminen O, Härkönen K, Miina J, Kurttila M (2018) Integrating bilberry yields into regional long-term forest scenario analyses. Scand J For Res 33: 378–386. https://doi.org/10.1080/02827581.2017.1407821.
Kurttila M, Pukkala T, Miina J (2018) Synergies and trade-offs in the production of NWFPs predicted in boreal forests. Forests 9, article id 417. https://doi.org/10.3390/f9070417.
Lõhmus A, Remm L (2017) Disentangling the effects of seminatural forestry on an ecosystem good: bilberry (Vaccinium myrtillus) in Estonia. For Ecol Manage 404: 75–83. https://doi.org/10.1016/j.foreco.2017.08.035.
Marsi (2016) Luonnonmarjojen ja -sienten kauppaantulomäärät vuonna 2016. [Trading volumes of wildberries and mushrooms in 2016]. Maaseutuviraston julkaisusarja: Raportteja ja selvityksiä 3/2017. https://www.ruokavirasto.fi/globalassets/viljelijat/tuet-ja-rahoitus/marsi-2016-raportti.pdf. Accessed 7 October 2021.
Marsi (2018) Luonnonmarjojen ja -sienten kauppaantulomäärät vuonna 2018. [Trading volumes of wildberries and mushrooms in 2018]. Ruokavirasto 3/2019. https://www.ruokavirasto.fi/globalassets/viljelijat/tuet-ja-rahoitus/marsi-2018-raportti.pdf. Accessed 7 October 2021.
Marsi (2020) Luonnonmarjojen ja -sienten kauppaantulomäärät vuonna 2020. [Trading volumes of wildberries and mushrooms in 2020]. Ruokavirasto 3/2021. https://www.ruokavirasto.fi/globalassets/viljelijat/tuet-ja-rahoitus/marsi-2020-raportti.pdf. Accessed 7 October 2021.
Miina J, Hotanen J-P, Salo K (2009) Modelling the abundance and temporal variation in the production of bilberry (Vaccinium myrtillus L.) in Finnish mineral soil forests. Silva Fenn 43: 577–593. https://doi.org/10.14214/sf.181.
Miina J, Pukkala T, Kurttila M (2016) Optimal multi-product management of stands producing timber and wild berries. Eur J For Res 135: 781–794. https://doi.org/10.1007/s10342-016-0972-9.
Miina J, Hallikainen V, Härkönen K, Merilä P, Packalen T, Rautio P, Salemaa M, Tonteri T, Tolvanen A (2020) Incorporating a model for ground lichens into multi-functional forest planning for boreal forests in Finland. For Ecol Manage 460, article id 117912. https://doi.org/10.1016/j.foreco.2020.117912.
Nielsen SE, Dennett JM, Bater CW (2020) Predicting occurrence, abundance, and fruiting of a cultural keystone species to inform landscape values and priority sites for habitat enhancements. Forests 11, article id 783. https://doi.org/10.3390/f11070783.
Packalen T, Korhonen KT, Salminen O (2017) Finland. In: Barreiro S, Schelhaas M-J, McRoberts RE, Kändler G (eds) Forest-inventory-based projection systems for wood and biomass availability. Managing Forest Ecosystems 29: 139–148. https://doi.org/10.1007/978-3-319-56201-8_12.
Peltola R, Hallikainen V, Tuulentie S, Naskali A, Manninen O, Similä J (2014) Social licence for the utilization of wild berries in the context of local traditional rights and the interests of the berry industry. Barents Studies 1: 24–49. http://urn.fi/URN:NBN:fi:ula-201410021424.
Raatikainen M, Rossi E, Huovinen J, Koskela M-L, Niemelä M, Raatikainen T (1984). The yields of the edible wild berries in central Finland. Silva Fenn 18: 199–219. https://doi.org/10.14214/sf.a15393.
Reinikainen A, Mäkipää R, Vanha-Majamaa I, Hotanen J-P (eds) (2000) Kasvit muuttuvassa metsäluonnossa. [Changes in the frequency and abundance of forest and mire plants in Finland since 1950]. Tammi, Jyväskylä. ISBN 951-31-1963-7.
Riksinventering av skog, Fältinstructions 2020 (2020) [National forest inventory, field instructions 2020]. Department of forest resource management, SLU, Umeå, Sweden. https://www.slu.se/globalassets/ew/org/centrb/rt/dokument/faltinst/20_ris_fin.pdf.
Riksskogstaxeringen (2020) [Swedish National forest inventory]. Department of forest resource management, SLU, Umeå, Sweden.
Ritchie JC (1955) Biological flora of the British Isles: Vaccinium vitis-idaea L. J Ecol 43: 701–708. https://doi.org/10.2307/2257030.
Ritchie JC (1956) Biological flora of the British Isles: Vaccinium myrtillus L. J Ecol 44: 291–299. https://doi.org/10.2307/2257181.
Salminen H, Lehtonen M, Hynynen J (2005) Reusing legacy FORTRAN in the MOTTI growth and yield simulator. Comput Electron Agr 49: 103–113. https://doi.org/10.1016/j.compag.2005.02.005.
Salo K (1999) Principles and design of a prognosis system for an annual forecast of non-wood forest products. In: Niskanen A, Demidova N (eds) Research approaches to support nonwood forest products sector development: case of Arkhangelsk region, Russia. EFI Proceedings 29: 35–44.
Sievänen T, Neuvonen M (eds) (2011) Outdoor recreation 2010. The Finnish Forest Research Institute, Working Papers 212. http://urn.fi/URN:ISBN:978-951-40-2331-6.
Silver EJ, Leahy JE, Weiskittel AR, Noblet CL, Kittredge DB (2015) An evidence-based review of timber harvesting behavior among private woodland owners. J For 113: 490–499. https://doi.org/10.5849/jof.14-089.
Skogsdata 2011 (2011) [Forest statistics 2011]. Official Statistics of Sweden. Swedish University of Agricultural Sciences (SLU), Umeå, Sweden. https://pub.epsilon.slu.se/8333/1/Skogsdata2011_webb.pdf.
Skogsdata 2020 (2020) [Forest statistics 2020]. Official Statistics of Sweden. Swedish University of Agricultural Sciences (SLU), Umeå, Sweden. https://www.slu.se/globalassets/ew/org/centrb/rt/dokument/skogsdata/skogsdata_2020_webb.pdf.
Snowdon P (1991) A ratio estimator for bias correction in logarithmic regressions. Can J For Res 21: 720–724. https://doi.org/10.1139/x91-101.
Storch I (1993) Habitat selection by capercaillie in summer and autumn: is bilberry important? Oecologia 95: 257–265. https://doi.org/10.1007/BF00323498.
Sveriges lantbruksuniversitet (SLU) (2019). Bärprognoser. [Berry prognosis]. Swedish University of Agricultural Sciences. https://www.slu.se/institutioner/skoglig-faltforskning/esfmiljoanalys/fenologi/barprognoser/. Accessed 7 October 2021.
Tahvanainen V, Miina J, Kurttila M (2019) Climatic and economic factors affecting the supply of wild edible mushrooms and berries in Finland. Forests 10, article id 385. https://doi.org/10.3390/f10050385.
Tomppo E, Heikkinen J, Henttonen HM, Ihalainen A, Katila M, Mäkelä H, Tuomainen T, Vainikainen N (2011) Designing and conducting a forest inventory – case: 9th National Forest Inventory of Finland. Springer, Dordrecht, Managing Forest Ecosystems 22: 17–67. https://doi.org/10.1007/978-94-007-1652-0_2.
Tonteri T, Hotanen J-P, Mäkipää R, Nousiainen H, Reinikainen A, Tamminen M (2005) Metsäkasvit kasvupaikoillaan – kasvupaikkatyypin, kasvillisuusvyöhykkeen, puuston kehitysluokan ja puulajin yhteys kasvilajien runsaussuhteisiin. [Forest plants in their site types]. The Finnish Forest Research Institute, Research Papers 946. http://urn.fi/URN:ISBN:951-40-1982-2.
Tonteri T, Salemaa M, Rautio P, Hallikainen V, Korpela L, Merilä P (2016) Forest management regulates temporal change in the cover of boreal plant species. For Ecol Manage 381: 115–124. https://doi.org/10.1016/j.foreco.2016.09.015.
Turtiainen M (2015). Modelling bilberry and cowberry yields in Finland: different approaches to develop models for forest planning calculations. Dissertationes Forestales 185. https://doi.org/10.14214/df.185.
Turtiainen M, Nuutinen T (2012) Evaluation of information on wild berry and mushroom markets in European countries. Small-scale For 11: 131–145. https://doi.org/10.1007/s11842-011-9173-z.
Turtiainen M, Salo K, Saastamoinen O (2005) Model-based estimates of regional and national bilberry and lingonberry yields on mineral soils in Finland. University of Joensuu, Faculty of Forestry. Research Notes 167. http://urn.fi/URN:ISBN:952-458-764-5.
Turtiainen M, Salo K, Saastamoinen O (2007) National and regional estimates of blueberry (Vaccinium myrtillus L.) and lingonberry (V. vitis-idaea L.) yields on peatlands in Finland. Suo 58: 87–98. http://www.suo.fi/article/9857.
Turtiainen M, Salo K, Saastamoinen O (2011) Variations of yield and utilisation of bilberries (Vaccinium myrtillus L.) and cowberries (V. vitis-idaea L.) in Finland. Silva Fenn 45: 237–251. https://doi.org/10.14214/sf.115.
Turtiainen M, Miina J, Salo K, Hotanen J-P (2013) Empirical prediction models for the coverage and yields of cowberry in Finland. Silva Fenn 47, article id 1005. http://dx.doi.org/10.14214/sf.1005.
Turtiainen M, Miina J, Salo K, Hotanen J-P (2016) Modelling the coverage and annual variation in bilberry yield in Finland. Silva Fenn 50, article id 1573. http://dx.doi.org/10.14214/sf.1573.
Venables WN, Ripley BD (2002) Modern applied statistics with S. 4th ed. Springer, New York. https://doi.org/10.1007/978-0-387-21706-2.
Wallenius TH (1999) Yield variations of some common wild berries in Finland in 1956–1996. Ann Bot Fenn 36: 299–314.
Wikström P, Edenius L, Elfving B, Eriksson LO, Lämås T, Sonesson J, Öhman K, Wallerman J, Waller C, Klintebäck F (2011) The Heureka forestry decision support system: an overview. Mathematical and Computational Forestry & Natural-Resource Sciences 3: 87–95.
Total of 61 references.
