Xiao Chen,
Deborah Page-Dumroese,
Ruiheng Lv,
Weiwei Wang,
Guolei Li,
Yong Liu 
Interaction of initial litter quality and thinning intensity on litter decomposition rate, nitrogen accumulation and release in a pine plantation
Chen X., Page-Dumroese D., Lv R., Wang W., Li G., Liu Y. (2014). Interaction of initial litter quality and thinning intensity on litter decomposition rate, nitrogen accumulation and release in a pine plantation. Silva Fennica vol. 48 no. 4 article id 1211. https://doi.org/10.14214/sf.1211
Highlights
- Litter quality and thinning showed an interaction on one year litter decomposition rates, N accumulation, and net N release
- N accumulated until the underlying critical acid-unhydrolyzable residue to nitrogen ratio (approximately 57–69) was met
- Increased N concentration in litter and thinning intensity induced rapid litter decomposition and N cycling in coniferous plantation with a slow decomposition rate.
Abstract
Thinning alters litter quality and microclimate under forests. Both of these two changes after thinning induce alterations of litter decomposition rates and nutrient cycling. However, a possible interaction between these two changes remains unclear. We placed two types of litter (LN, low N concentration litter; HN, high N concentration litter) in a Chinese pine (Pinus tabulaeformis Carrière) plantation under four thinning treatments to test the impacts of litter quality, thinning or their combination on decomposition rate and N cycling. In our study, N was accumulated to approach an underlying critical acid-unhydrolyzable residue to nitrogen ratio (approximately 57–69) in litter. Moreover, an interaction between litter quality and thinning on decomposition rates, N accumulation and net release did exist. On one hand, one year decomposition rate of LN was elevated after thinning while that of HN remained the same or even lower (under light thinning); N accumulation of LN declined with light thinning and was restored with the increase of thinning intensity whereas that of HN did not decline with thinning and increased under heavy thinning; Net N release from LN was only found in light and heavy thinning while that from HN was found in all treatments, moreover net N release from LN and HN were both elevated under heavy thinning. On the other hand, HN decomposed faster, accumulated less and released more N than LN did under all treatments. Generally, high N concentration in litter and high-intensity thinning can lead to rapid litter decomposition and N cycling in coniferous plantations.
Keywords
litter quality;
litter decomposition;
nitrogen cycling;
thinning intensity;
Pinus tabulaeformis
- Chen, Key Laboratory for Silviculture and Conservation of Ministry of Education, Beijing Forestry University, Beijing, 100083, China E-mail chenxiao_0123@126.com
- Page-Dumroese, U.S. Department of Agriculture, Forest Service, Rocky Mountain Research Station, 1221 South Main Street, Moscow, ID 83843, USA E-mail ddumroese@fs.fed.us
- Lv, College of Plant Science and Technology, Tarim University, Alar Xinjiang, 843300, China E-mail lvrh514723@126.com
- Wang, Key Laboratory for Silviculture and Conservation of Ministry of Education, Beijing Forestry University, Beijing, 100083, China E-mail fuyuerdejia@126.com
- Li, Key Laboratory for Silviculture and Conservation of Ministry of Education, Beijing Forestry University, Beijing, 100083, China E-mail glli226@163.com
-
Liu,
Key Laboratory for Silviculture and Conservation of Ministry of Education, Beijing Forestry University, Beijing, 100083, China
E-mail
lyong@bjfu.edu.cn
Received 13 June 2014 Accepted 5 September 2014 Published 22 October 2014
Views 162515
Available at https://doi.org/10.14214/sf.1211 | Download PDF

1 Introduction
Litter decomposition is an important component of ecosystem processes, such as soil formation or nutrient cycling (Taylor et al. 1991) and it is also a source of organic and inorganic nutrients for tree growth (Berg and McClaugherty 2008). Although litter decomposition is influenced by biotic and abiotic conditions, particularly decomposer organisms (Osono et al. 2003), soil moisture, and temperature (Robinson 2002; Piñeiro et al. 2010; Haynes et al. 2013), forest cover type is also important (Prescott 2002). In general, nutrient cycling rates in litter are higher beneath deciduous forests than under coniferous forests (Cole and Rapp 1980). Thus, conifer litter, especially in pure conifer plantations, decomposes slower than that from hardwood species (Jurgensen et al. 2006). Quantification of soil nutrient inputs through litterfall is important for understanding stand dynamics and the impact of management activities on nutrient cycling. This can be especially important in nutrient-poor ecosystems (Blanco et al. 2011).
Pinus tabulaeformis Carrière (Chinese pine) is endemic to northern China. Decomposition of litter in these forests is slow as a result of low mean annual temperature, precipitation (Berg et al. 1993; Parton et al. 2007) and nutrient quality (Smith and Bradford 2003; Cornwell et al. 2008), leading to relatively low forest productivity. Thinning has been shown to be an effective approach to increase both litter decomposition rates (Smith et al. 1997) and forest productivity (Ruano et al. 2013). On one hand, thinning alters leaf-litter nutrient concentrations, such as an increase or decrease of litter N concentration (Trofymow et al. 1991; Carlyle 1998). Previous studies have found that higher N concentration in litter will induce a greater rate of decomposition (Hoorens et al. 2010) and N release (Aponte et al. 2012). In addition, Osono and Takeda 2004 found that litter has a critical value of acid-unhydrolyzable residue to nitrogen ratio (AUR:N ratio), which is maintained by N accumulation or release. Changes in litter N concentration after thinning must affect the AUR:N ratio, then litter N immobilization and release patterns. On the other hand, thinning changes forest canopy coverage, then results in changes in microclimatic conditions, such as elevating soil temperature and moisture (Martin et al. 2001; Titus et al. 2006). These changes in microclimatic conditions after harvesting may, in turn, increase decomposition rates and nutrient cycling (Smethurst and Nambiar 1990; Prescott 2002; Osono et al. 2003). Therefore, litter quality and microclimate both play an important role in accelerating litter decomposition rates and nutrient cycling after thinning in coniferous plantations. However, a possible interaction between litter quality and microclimate (thinning effect excluding litter quality) on litter decomposition rate and nutrient cycling remains unclear. Quantitative and systematic research is needed to further our understanding of decomposition patterns of different initial litter qualities under different thinning intensities in coniferous plantations with naturally low decomposition rates.
In our study, we largely focus on N, which limits productivity of many temperate forests (Cole and Rapp 1980). Nitrogen concentration of litter collected from four different P. tabulaeformis plantation thinning intensities was measured. Subsequently, the litterbag method was used to examine N accumulation and release patterns of different initial N concentration litter under different thinning intensities. Our specific objectives were: (1) to compare N accumulation and release patterns of litter with the same initial N concentration in different thinning intensities; (2) to compare N accumulation and release patterns of litter with different initial N concentrations in the same thinning density; (3) to determine any interactions between thinning intensity and initial litter N concentration on litter N accumulation and release patterns. We predicted that there could be an interaction between thinning intensity and litter N concentration on decomposition rates and N cycling in P. tabulaeformis forests.
2 Material and methods
2.1 Study site and experimental design
The Pinus tabulaeformis plantation, established in 1978 at a density of 3770 seedlings ha–1, was located in the northern part of Yingpan village, Liubinbu township, Yanqing county (40°35´N, 116°16´E), Beijing and is in the warm temperate zone with semi-humid continental monsoon climate. The mean annual temperature was 8.8 °C and the mean temperature of the coldest (January) and warmest month (July) were –9.8 °C and 20.9 °C. The mean annual precipitation was 467 mm, of which 78.5% falls between June and September (growing season was April to September). Elevation, slope position, slope aspect and slope gradient of the site was 880–887 m, middle backslope, north, 16–18.5°, respectively. Parent material is Mesozoic intrusive and extrusive limestone (Huo 1989). The soil is a leached cinnamon soil with clay loam texture, and is similar to a Typic Haplustalf (Soil Survey Staff 2006). Profiles are approximately 60 cm deep with a 4–5 cm deep forest floor layer (all surface organic horizons). The dominant understory vegetation species were Quercus mongolica Fisch. ex Ledeb., Rhamnus davurica Pall., Corylus heterophylla Fisch. ex Trautv., Vitex negundo L. var. heterophylla (Franch.) Rehder, and Carex lanceolata Boott.
In 1996, the plantation underwent a pre-commercial thinning to 3300 trees ha–1. Subsequently, a second pre-commercial thinning was conducted in November 2001. At that time, we established four thinning densities on twelve 20 × 20 m plots (each thinning density on three plots): control (2700 trees ha–1), light (1925 trees ha–1), moderate (1325 trees ha–1), and heavy (1125 trees ha–1). Control density corresponded to the average natural stand density in 2001. Trees were hand-felled and the bole and branches removed immediately from each plot after thinning; each plot had similar soil, aspect, and slope and was dominated by P. tabulaeformis. In 2008, tree diameter at breast height (DBH), height, height under the first live branch, and tree canopy width for each thinning level were measured (Table 1).
| Table 1. Mean tree characteristics of each thinning treatment under P. tabulaeformis plantation at establishment: Control (number of trees left equals the average natural density after self-thinning; 2700 trees ha–1), light (1925 trees ha–1), moderate (1325 trees ha–1) and heavy thinning (1125 trees ha–1). | |||||
| Thinning intensity | DBH (cm) | Total tree height (m) | Height under first live branch (m) | Tree canopy width (m) | |
| EW a) | NS b) | ||||
| Control | 11.38 | 6.94 | 3.17 | 3.09 | 2.84 |
| Light | 12.18 | 7.69 | 3.38 | 3.16 | 3.15 |
| Moderate | 13.08 | 8.60 | 4.93 | 3.20 | 3.01 |
| Heavy | 11.75 | 6.81 | 3.18 | 3.00 | 3.75 |
| a) EW = average tree canopy width at east-west direction. b) NS = average tree canopy width at north-south direction. | |||||
2.2 Litter collection, layout, and sampling
In each plot, fresh needle litter (L layer; undecomposed material) was collected from five distinct plot areas (four corners and one center; 3 × 3 m for each sample), and composited into one sample after needle fall (November 2008). A total of 12 samples (four thinning levels × three replicates) were placed into twelve woven bags and taken to laboratory. Three subsamples were randomly selected from each composite litter sample and oven-dried at 70° for 72 hours before being ground through a 0.5 mm mesh and analyzed for total N content. Total litter N content was determined by Kjeldahl digestion method using H2O2 as the oxidant on a 0.2 g litter sample with 10 ml H2SO4 (Horwitz 1980) followed by titration on a UDK 152 distillation and titration unit (VELP Scientifica, Italy). The remaining litter samples from each plot were left unground.
Based on multiple comparison results of the litter N analyses from the four thinning treatments, we divided the litter into two N levels: low N litter (LN; litter collected from three plots from the control plots) with a mean initial N concentration of 1.64 ± 0.20 mg g–1 and high N litter (HN; litter collected from three moderately thinned plots) with a mean initial N concentration of 3.28 ± 0.40 mg g–1. After testing the litter to determine N levels, fifty grams of unground LN or HN were placed into 20 × 20 cm nylon mesh bags (mesh size 0.5 × 0.5 mm). A total of four hundred bags (two hundred bags for LN, two hundred for HN) were made. At placement, the fresh organic matter was removed from the soil surface to ensure the litter bag was in contact with the humus horizon and was returned to the top of the litter bag after placement. We placed fifty bags of each litter type in each of the four thinning treatments in November 2008, sampling thirty-six bags and leaving fourteen bags in reserve in case a litter bag was lost or damaged. Within each treatment plot litter bags were placed on the upper, lower, and mid-slope position. Three litter bags from each slope position for each litter type were sampled in each of the three replicated treatment plots in March, June, September, and November 2009. The data for each sample date and slope position were averaged for each thinning treatment. Litter was oven-dried at 70° for 72 hours, and ground through a 0.5 mm mesh. Total N content of the litter was determined by Kjeldahl digestion method as described above. Litter bag oven-dry mass was determined for each sample period (March, June, September, and November). The November 2009 sample period litter bag oven-dry mass was used to calculate one-year litter decomposition rates for each treatment and plot location.
2.3 Calculations and statistical analysis
Nitrogen accumulation (NA, mg g–1) and N net release (NNR, mg g–1) are calculated according to the following equations:
NA = A-B
NNR = B-C
where A (mg g–1) is the maximum value of litter N during the one year of decomposition, B (mg g–1) is the initial litter N concentration, and C (mg g–1) is the minimum value of N concentration in litter during the one year of decomposition.
Using SPSS 17.0 software, we compared one year decomposition rates of LN and HN under the four thinning intensities with a one-way analysis of variance (ANOVA). We compared the N critical value (NCV) between LN and HN with a t-test. We used a two-way ANOVA to test the effects of our independent variables (thinning intensity and initial litter N concentration and their interactions) on the dependent variables: one year litter decomposition rate (expressed as mass loss rate), N accumulation (NA), and N net release (NNR). When the effects of the dependent variables were significant, Duncan’s multiple range test at the 5% level was used to compare means.
3 Results
3.1 Thinning level and litter one-year decomposition rate
Initial litter N concentration and thinning intensity interacted (P = 0.002) to affect the one-year litter decomposition rate expressed as percent mass loss of the original 50-g sample (Table 2). Decomposition differences between thinning intensities varied depending on initial litter N concentration. After one year, LN litter decomposed significantly faster in the light, moderate, and heavy treatments than in the control treatment (Table 3). For the HN, however, the decomposition rate was significantly lower after light thinning than in the other treatments (Table 3). Overall, one-year litter decomposition rates were, on average, 15.3% higher in HN than LN under all thinning treatments.
| Table 2. Influence of the initial litter N concentration (low N and high N concentration in litter) and thinning intensities (Control, number of trees left equals the average natural density after self-thinning, 2700 trees ha–1; light, 1925 trees ha–1; moderate, 1325 trees ha–1; heavy thinning, 1125 trees ha–1) on litter decomposition rate (expressed as percentage mass loss of the original 50-g sample after one year), N accumulation value, and net release value after one year. | ||||||
| Sources of variation | Mass loss rate | N accumulation value | N net release value | |||
| Mean square | P | Mean square | P | Mean square | P | |
| Initial litter N concentration (I) | 71.595 | <0.001 | 0.039 | <0.001 | 0.037 | <0.001 |
| Thinning intensities (T) | 8.529 | 0.001 | 0.003 | 0.003 | 0.003 | <0.001 |
| I×T | 7.434 | 0.002 | 0.002 | 0.009 | 0.001 | <0.001 |
| Error | 0.925 | <0.001 | <0.001 | |||
| P = significance value. | ||||||
| Table 3. One year decomposition rate (expressed as percentage mass loss of the original 50-g sample after one year) of different initial N concentration litter (litter with low N concentration and litter with high N concentration) affected by the four thinning treatment intensities (Control, number of trees left equals the average natural density after self-thinning, 2700 trees ha–1; light, 1925 trees ha–1; moderate, 1325 trees ha–1; heavy thinning, 1125 trees ha–1). Within each litter type different letters in the same column indicate statistically significant differences according to Duncan’s multiple range test at the 0.05 level. | ||
| Thinning intensity | Mass loss rate (%) of LN a) | Mass loss rate (%) of HN b) |
| Control | 20.57 ± 1.56a | 26.39 ± 0.90b |
| Light | 22.74 ± 0.75b | 23.27 ± 0.72a |
| Moderate | 23.89 ± 0.87b | 27.10 ± 0.84b |
| Heavy | 22.87 ± 0.84b | 27.13 ± 0.97b |
| a) LN = litter with low N concentration. b) HN = litter with high N concentration. | ||
3.2 Accumulation-release patterns and critical value of N
In the control treatment, N concentration in both litter types increased in March and then declined. However, in the thinned treatments, N concentration in LN and HN elevated or stayed the same through the June sample date and then began to decline (Fig. 1a, 1b, 1c, and 1d). Initial litter N concentration did not affect the temporal patterns, but thinning increased the N accumulation time.
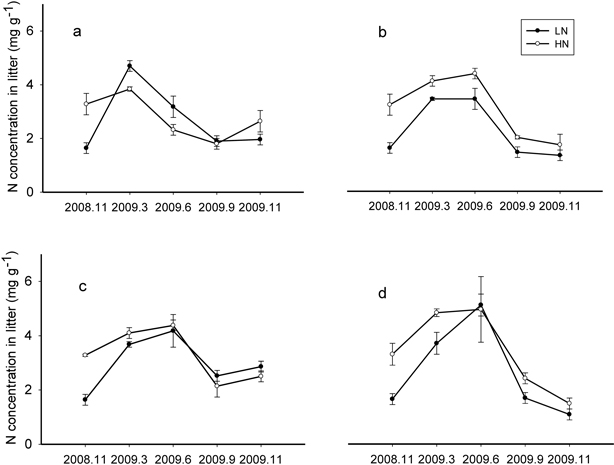
Fig. 1. N concentration changes over time of LN (litter with low N concentration) and HN (litter with high N concentration) decomposition under Control (a) (number of trees left equals the average natural density after self-thinning, 2700 trees ha–1), Light (b) (1925 trees ha–1), Moderate (c) (1325 trees ha–1) and Heavy (d) (1125 trees ha–1) thinning treatment during one year.
The end point of the N immobilization phase for each litter type was averaged and the standard deviation calculated; this critical value is the transition point from N immobilization to N release and was 4.36 ± 0.68 mg g–1 for LN and 4.40 ± 0.40 mg g–1 for HN. There was no significant critical value difference (P > 0.05) between LN and HN.
3.3 The accumulation and net release value of N
A significant interaction between initial litter N and thinning intensity was found for litter N accumulation (P = 0.009) (Table 2). Initial litter N concentration significantly affected N accumulation in all the treatments (Table 2). The LN exhibited a more pronounced N accumulation (also evidenced by the higher slope of N concentration lines in Fig. 1), whereas N accumulation in HN was smaller in magnitude (lower slope in Fig. 1). The average N accumulation of LN was 143.3% larger than that of HN. Thinning intensity affected N accumulation; however the influence was different between LN and HN (Fig. 2a). Nitrogen accumulation of LN declined with light thinning, and no difference was found among control, moderate and heavy thinning treatments. However, HN N accumulation was enhanced after heavy thinning, with no difference among other treatments (Fig. 2a).
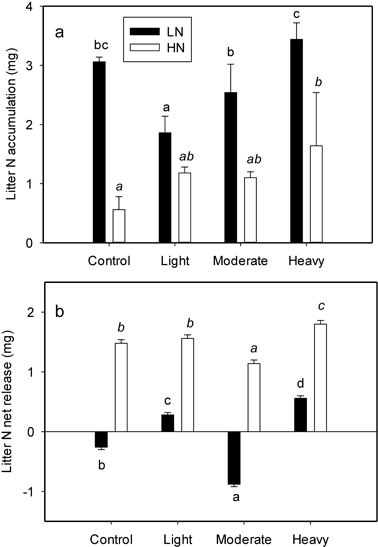
Fig. 2. N accumulation (a) and net release (b) value of per-g LN (litter with low N concentration) and HN (litter with high N concentration) as affected by four thinning treatments (Control, number of trees left equals the average natural density after self-thinning, 2700 trees ha–1; light, 1925 trees ha–1; moderate, 1325 trees ha–1; heavy thinning, 1125 trees ha–1). Within each litter type different letters indicate statistically significant differences according to Duncan’s multiple range test at the 0.05 level.
The N net release directly reflects N returned to the soil. Initial litter N and thinning intensity also interacted to effect litter N release (P < 0.001) (Table 2). Initial litter N concentration profoundly influenced litter N net release (Table 2), and there was a magnitude difference between LN and HN in all treatments. Higher N accumulation in LN was followed by either a continued accumulation or much smaller net release. However, net N release from HN was found in all treatments with a higher magnitude (Fig. 2b). The effect of thinning on N net release was different between LN and HN. The N net release for LN was only evident after light and heavy thinning; with the heavy thinning having the greatest value (Fig. 2b). However, for HN, N net release was detected in all four treatments with the minimum value in moderate thinning and maximum value in heavy thinning (Fig. 2b).
4 Discussion
The N concentration of needle litter measured in our study plots was relatively low (0.164% in LN, 0.328% in HN) as compared to other studies (~0.5–1%), indicating that these plots are N limited. Caution is required, therefore, when discussing N concentration of the HN litter relative to the N concentration in LN in our study. Under this condition, seven years after thinning, we found that litter N concentration and thinning interacted on litter decomposition rate. The LN decomposed faster after thinning, which may be caused by the higher air and soil temperature and greater humus layer and soil moisture (Smethurst and Nambiar 1990; Sinclair 1992).
Although we did not measure soil temperature and moisture in our study plots after thinning, previous studies have found that decreased canopy coverage after harvesting could increase soil temperature (Martin et al. 2001) and result in a wider fluctuation of humidity on the soil surface and is likely responsible for higher humus layer moisture (Osono et al. 2003; Titus et al. 2006). Decomposition rates of HN after thinning was not enhanced by the ameliorating microclimatic conditions. On the contrary, it was the same or lower in the light thinning treatment compared to the control. However, the decomposition rate of HN in all the treatments were larger than that of LN, even the minimum value in HN (light thinning, 23.27%) was almost equal to the maximum value in LN (heavy thinning, 23.89%). This indicates that in this N limited plantation, the increase of N concentration in litter is likely more important than the improvement of microclimate that resulted after thinning. Berg and Stååf (1980) and Berg (1984) reported that litter nutrient content controls decay rates only until about 20–35% of the mass lost, after that, decomposition rates are determined by cell wall constituents, particularly AUR, which is important to long-term decay rates of both hardwood leaves and conifer needles (Meentemeyer 1978; Edmonds 1984; Upadhyay and Singh 1989). In our study, the decomposition rate after one year was in the range of 20–27%, which increases our confidence in the results.
Nitrogen accumulation during decomposition has been shown to occur in temperate and boreal forests (Salamanca et al. 1998). Further, Enoki and Kawaguchi (2000) found that N concentrations of pine needle litter increased in decomposing litter and the accumulation value was not impacted by initial N concentrations. However in our study, initial N concentration in litter significantly affected N accumulation; with the LN accumulating more N than HN in all the treatments (Table 2, Fig. 2a). The underlying regulation may be that conifer and hardwood litter have a critical value of AUR:N ratio and that N accumulates when it is above a critical value (Osono and Takeda 2004). We calculated N critical values in P. tabulaeformis as: LN 4.36 ± 0.68 mg g–1 and HN 4.40 ± 0.40 g mg g–1. In addition, the AUR concentration of P. tabulaeformis was approximately 25–30%, according to a previous study on this site (Liu and Li 2008). Therefore, we extrapolate that the critical value of AUR:N ratio in P. tabulaeformis was approximately 57–69, which is similar to the value reported by Berg and Wessén (1984) for Pinus sylvestris L.
The critical value of LN and HN was not significantly different (p > 0.05), whereas the initial N concentration was significantly different (P < 0.01). Thus, to reach the similar critical value, more N needed to accumulate in LN than HN. It is worth noting that peak N concentration would occur earlier for litter with high rather than low N concentrations since less N would need to accumulate in the litter before the critical AUR:N ratio occurred. Potentially the sampling design (every three months) was not frequent enough to capture these differences.
Thinning has been reported to improve N and P immobilization in Pinus sylvestris stands (Blanco et al. 2011). However on our site, thinning and litter quality had an interaction with N accumulation, causing different accumulation patterns in LN and HN under different thinning intensities. Nitrogen accumulation of LN under light thinning was lower than under the control. With the increase of thinning intensity, N accumulation was significantly elevated and restored to the magnitude of control (Fig. 2). This indicated that something must diminish after thinning, and was restored with the increase of thinning intensity.
One postulated theory for our plots is that the microbial activity for N is mostly retained through microbial uptake during litter decomposition (Vitousek and Matson 1984; Hasegawa and Takeda 1996; Osono and Takeda 2001). The effect of microbial activity on N accumulation could also be altered by C availability (Hart et al. 1994; Bradley et al. 2000) and microclimatic conditions (Sinclair 1992; Aponte et al. 2010). After thinning, C availability on litter floor declined due to a decrease in litterfall which likely diminished microbial activity (Hart et al. 1994). With the increase of thinning intensity, microbial activity for N accumulation was improved by the amelioration of microclimatic conditions (Sinclair 1992; Aponte et al. 2010), particularly temperature and moisture on soil surface, which has a positive relationship with microbe activity (Bosatta and Stååf 1982; Osono et al. 2003).
Nitrogen accumulation of HN did not decline with thinning. This indicated that microbial activity on HN might not be affected by the decline of C availability, or microbial activity might be improved by the increase of N concentration in litter (Schimel and Weintraub 2003) which counteracted the decline of microbial activity by the decrease of C availability. However, microbial activity on HN was still influenced by the soil surface temperature and moisture, where heavy thinning had the largest N accumulation (Fig. 2a).
Nitrogen net release to some extent reflected N availability in soil and which is taken up by the residual trees (Prescott 2002). We noted an interaction between N concentration of litter (litter quality) and thinning intensity on litter N net release (Table 2). For LN, litter in control treatment did not have a net N release. The possible reason was that our plantation was N-limited and there was more litterfall (C source) in the control. Schimel and Weintraub (2003) developed a theoretical model that shows that by adding a pulse of C to an N limited system microbes present in the litter will waste C by respiration rather than use it to release nutrients. After light and heavy thinning, net N release occurred and was greater in heavy thinning. One reason was the decrease of litterfall (C availability), which would be predicted to increase availability of NH4+ (Hart et al. 1994).
The other reason was the higher soil temperature and moisture after thinning. Smethurst and Nambiar (1990) reported that an increase of soil temperature can contribute to higher N mineralization rates. Osono et al. (2003) demonstrated that water content in litter is corrected with microbial growth, hence nutrient release. For HN, the net N release occurred in each treatment and was greater in magnitude than that of LN (Fig. 2b). This is consistent with results reported by Aponte et al. (2012) that higher initial N concentration leads to more N release, and nearly coincides to the theoretical model developed by Schimel and Weintraub (2003) that adding N to an N limited system will increase microbial growth, hence to more litter N release (Osono et al. 2003). Nitrogen net release of HN after heavy thinning was greater and could be caused by the decrease of C availability and the improvement of microclimatic conditions. Therefore, in these N-limited plantations, as N is released from litter the improvement of N concentration in litter and microclimatic conditions (temperature and moisture) are the major factors inducing greater N release.
In this study, it is worth noting that N accumulation occurred out of the growing season while N net release occurred during the growing season (Fig. 1), indicating that season impacts N accumulation and net release. For N accumulation, the timing of litterbag placement might be the main reason. Litterbags were placed on the plots outside the normal range of dates for stand growth (November), and at that time, N concentration in litter was not great enough for microbial growth, therefore leading to the N accumulation. For N net release, a higher temperature and moisture during the growing season might be the main reason. In this climatic zone, there is a higher temperature and moisture during the growing season (warmest month, July; 78.5% of annual precipitation during June to September), which can lead to an increase in microbial growth (Bosatta and Stååf 1982; Osono et al. 2003) and subsequent N release.
5 Conclusions
In plantations with low fertility (low N in litter) and slow litter decomposition, litter qualities and thinning intensities did have an interaction on litter decomposition, nitrogen accumulation and net release, indicating that the effects of thinning on litter decomposition and nutrient cycling are not only attributed to changes in litter quality or climatic conditions, but also attributed to their interaction with each other. Our results also indicated that P. tabulaeformis has an underlying critical value of AUR:N ratio (approximately 57–69) and that N accumulates when it is above a critical value. In addition, N accumulation occurs out of the growing season while N net release occurs during the growing season, indicating that season may impact N accumulation and net release. Results from this research suggest that high N concentration in litter and high-intensity thinning can lead to rapid litter decomposition and N cycling in coniferous plantations.
Acknowledgements
Special thanks were given to Dr. R. Kasten Dumroese for his critical review. This work was supported by the National Natural Science Foundation of China (No. 30972353) and the Special Research Foundation of Doctor Discipline in University, Ministry of Education, China (No. 20090014110011).
References
Aponte C., Marañón T., García L.V. (2010). Microbial C, N and P in soils of Mediterranean oak forests: influence of season, canopy cover and soil depth. Biogeochemistry 101: 77–92. http://dx.doi.org/10.1007/s10533-010-9418-5.
Aponte C., García L.V., Marañón T. (2012). Tree species effect on litter decomposition and nutrient release in mediterranean oak forests changes over time. Ecosystems 15: 1204–1218. http://dx.doi.org/10.1007/s10021-012-9577-4.
Berg B. (1984). Decomposition of root litter and some factors regulating the process: long-term root litter decomposition in a Scots pine forest. Soil Biology and Biochemistry 16: 609–618. http://dx.doi.org/10.1016/0038-0717(84)90081-6.
Berg B., McClaugherty C. (2008). Plant litter: decomposition, humus formation, carbon sequestration. 2nd ed. Springer-Verlag, Heidelberg, Germany.
Berg B., Stååf H. (1980). Decomposition rate and chemical changes in decomposing needle litter of Scots pine. II Influence of chemical composition. In: Persson T. (ed.). Structure and function of northern coniferous forests. Ecological Bulletins 32: 373–390.
Berg B., Wessén B. (1984). Changes in organic-chemical components and ingrowth of fungal mycelium in decomposing birch leaf litter as compared to pine needles. Pedobiologia 26: 285–298.
Berg B., Berg M.P., Bottner P., Box E., Breymeyer A., Ca de Anta R., Couteaux M., Escudero A., Gallardo A., Kratz W., Madeira M., Mälkönen E., McClaugherty C., Meentemeyer V., Muñoz F., Piussi P., Remacle J., Vi de Santo A. (1993). Litter mass loss rates in pine forests of Europe and eastern United States: some relationships with climate and litter quality. Biogeochemistry 20: 127–159. http://dx.doi.org/10.1007/BF00000785.
Blanco J.A., Imbert J.B., Castillo F.J. (2011). Thinning affects Pinus sylvestris needle decomposition rates and chemistry differently depending on site conditions. Biogeochemistry 106: 397–414. http://dx.doi.org/10.1007/s10533-010-9518-2.
Bosatta E., Stååf H. (1982). The control of nitrogen turn-over in forest litters. Oikos 39: 143–151.
Bradley R.L., Titus B.D., Hogg K., Preston C., Prescott C.E., Kimmins J.P. (2000). Assessing the controls on soil mineral-N cycling rates in managed coastal western hemlock ecosystems of British Columbia. Journal of Sustainable Forestry 10: 213–219. http://dx.doi.org/10.1300/j091v10n03_02.
Carlyle J.C. (1998). Relationships between nitrogen uptake, leaf area, water status and growth in an 11-year-old Pinus radiata plantation in response to thinning, thinning residue, and nitrogen fertilizer. Forest Ecology and Management 108: 41–55. http://dx.doi.org/10.1016/S0378-1127(97)00333-2.
Cole D.W., Rapp M. (1980). Elemental cycling in forest ecosystems. In: Reichle D.E. (ed.). Dynamic properties of forest ecosystems. International Biological Programme 23. Cambridge University Press, Malta. p. 341–409.
Cornwell W.K., Cornelissen J.H.C., Amatangelo K., Dorrepaal E., Eviner V.T., Godoy O., Hobbie S.E., Hoorens B., Kurokawa H., Pérez-Harguindeguy N., Quested H.M., Santiago L.S., Wardle D.A., Wright I.J., Aerts R., Allison S.D., van Bodegom P., Brovkin V., Chatain A., Callaghan T.V., Díaz S., Garnier E., Gurvich D.E., Kazakou E., Klein J.A., Read J., Reich P.B., Soudzilovskaia N.A., Vaieretti M.V., Westoby M. (2008). Plant species traits are the predominant control on litter decomposition rates within biomes worldwide. Ecology Letters 11: 1065–1071. http://dx.doi.org/10.1111/j.1461-0248.2008.01219.x.
Edmonds R.L. (1984). Long-term decomposition and nutrient dynamics in Pacific silver fir needles in western Washington. Canadian Journal of Forest Research 14: 395–400. http://dx.doi.org/10.1139/x84-070.
Enoki T., Kawaguchi H. (2000). Initial nitrogen content and topographic moisture effects on the decomposition of pine needles. Ecological Research 15: 425–434. http://dx.doi.org/10.1046/j.1440-1703.2000.00363.x.
Haynes A.G., Schütz M., Buchmann N., Page-Dumroese D.S., Busse M.D., Risch A.C. (2013). Linkages between grazing history and herbivore exclusion on decomposition rates in mineral soils of subalpine grasslands. Plant and Soil. http://dx.doi.org/10.1007/s11104-013-1905-8.
Hart S.C., Nason G.E., Myrold D.D., Perry D.A. (1994). Dynamics of gross nitrogen transformations in an old-growth forest: the carbon connection. Ecology 75: 880–891. http://dx.doi.org/10.2307/1939413.
Hasegawa M., Takeda H. (1996). Carbon and nutrient dynamics in decomposing pine needle litter in relation to fungal and faunal abundances. Pedobiologia 40: 171–184.
Hoorens B., Coomes D., Aerts R. (2010). Neighbour identity hardly affects litter-mixture effects on decomposition rates of New Zealand forest species. Oecologia 162: 479–489. http://dx.doi.org/10.1007/s00442-009-1454-2.
Horwitz W. (1980). Official methods of analysis of the Association of Official Analytical Chemists. 13th ed. Association of Official Analytical Chemists, Washington, DC, USA.
Huo Y.Z. (1989). Beijing physical geography. Beijing Normal University Publishing Group, Beijing, China.
Jurgensen M., Ree D., Page-Dumroese D., Laks P., Collins A., Mroz G., Degórski M. (2006). Wood strength loss as a measure of decomposition in northern forest mineral soil. European Journal of Soil Biology 42: 23–31. http://dx.doi.org/10.1016/j.ejsobi.2005.09.001.
Liu Y., Li G.L. (2008). Decomposition characteristics affected by forest age in Pinus tabulaeformis plantations. Forest Research 21: 500–505. [In Chinese].
Martin W.L., Bradley R.L., Kimmins J.P. (2001). Post-clearcutting chronosequence in the B.C. coastal western hemlock zone: I. Changes in forest floor mass and N storage. Journal of Sustainable Forestry 14: 1–22. http://dx.doi.org/10.1300/J091v14n01_01.
Meentemeyer V. (1978). Macroclimate and lignin control of litter decomposition rates. Ecology 59: 465–472. http://dx.doi.org/10.2307/1936576.
Osono T., Takeda H. (2001). Organic chemical and nutrient dynamics in decomposing beech leaf litter in relation to fungal ingrowth and succession during three year decomposition processes in a cool temperate deciduous forest in Japan. Ecological Research 16: 649–670. http://dx.doi.org/10.1046/j.1440-1703.2001.00426.x.
Osono T., Takeda H. (2004). Accumulation and release of nitrogen and phosphorus in relation to lignin decomposition in leaf litter of 14 tree species. Ecological Research 19: 593–602. http://dx.doi.org/10.1111/j.1440-1703.2004.00675.x.
Osono T., Ono Y., Takeda H. (2003). Fungal ingrowth on forest floor and decomposing needle litter of Chamaecyparis obtusa in relation to resource availability and moisture condition. Soil Biology and Biochemistry 35 1423–1431. http://dx.doi.org/10.1016/S0038-0717(03)00236-0.
Parton W., Silver W.L., Burke I.C., Grassens L., Harmon M.E., Currie W.S., King J.Y., Adair E.C., Brandt L.A., Hart S.C., Fasth B. (2007). Global-scale similarities in nitrogen release patterns during long-term decomposition. Science 315: 361–364. http://dx.doi.org/10.1126/science.1134853.
Piñeiro G., Paruelo J.M., Oesterheld M., Jobbagy E.G. (2010). Pathways of grazing effects on soil organic carbon and nitrogen. Rangeland Ecology and Management 63: 109–119. http://dx.doi.org/10.2111/08-255.1.
Prescott C.E. (2002). The influence of the forest canopy on nutrient cycling. Tree Physiology 22: 1193–1200. http://dx.doi.org/10.1093/treephys/22.15-16.1193.
Robinson C. (2002). Control on decomposition and soil nitrogen availability at high latitudes. Plant and Soil 242: 65–81. http://dx.doi.org/10.1023/A:1019681606112.
Ruano I., Rodríguez-García E., Bravo F. (2013). Effects of pre-commercial thinning on growth and reproduction in post-fire regeneration of Pinus halepensis Mill. Annals of Forest Science 70: 357–366. http://dx.doi.org/10.1007/s13595-013-0271-2.
Salamanca E.F., Kaneko N., Katagiri S., Nagayama Y. (1998). Nutrient dynamics and lignocellulose degradation in decomposing Quercus serrata leaf litter. Ecological Research 13: 199–210. http://dx.doi.org/10.1046/j.1440-1703.1998.00258.x.
Schimel J.P. , Weintraub M.N. (2003). The implications of exoenzyme activity on microbial carbon and nitrogen limitation in soil: a theoretical model. Soil Biology and Biochemistry 35: 549–563. http://dx.doi.org/10.1016/S0038-0717(03)00015-4.
Sinclair T.R. (1992). Mineral nutrition and plant growth response to climate change. Journal of Experimental Botany 43: 1141–1146. http://dx.doi.org/10.1093/jxb/43.8.1141.
Smethurst P.J., Nambiar E.K.S. (1990). Effects of slash and litter management on fluxes of nitrogen and tree growth in a young Pinus radiata plantation. Canadian Journal of Forest Research 20: 1498–1507. http://dx.doi.org/10.1139/x90-198.
Smith V.C., Bradford M.A. (2003). Litter quality impacts on grassland litter decomposition are differently dependent on soil fauna across time. Applied Soil Ecology 24: 197–203. http://dx.doi.org/10.1016/S0929-1393(03)00094-5.
Smith D.M., Larson B.C., Kelty M.J., Ashton P.M.S. (1997). The practice of silviculture: applied forest ecology. 9th ed. John Wiley and Sons, New York, NY, USA.
Soil Survey Staff. (2006). Keys to soil taxonomy. 10th ed. USDA National Soil Conservation Service, Washington, DC, USA. p. 331–332.
Taylor B.R., Prescott C.E., Parsons W.J.F., Parkinson D. (1991). Substrate control of litter decomposition in four Rocky Mountain coniferous forests. Canadian Journal of Botany 69: 2242–2250. http://dx.doi.org/10.1139/b91-281.
Titus B.D., Prescott C.E., Maynard D.G., Mitchell A.K., Bradley R.L., Feller M.C., Beese W.J., Seely B.A., Benton R.A., Senyk J.P., Hawkins B.J., Koppenaal R. (2006). Post-harvest nitrogen cycling in clearcut and alternative silvicultural systems in a montane forest in coastal British Columbia. The Forestry Chronicle 82: 844–859. http://dx.doi.org/10.5558/tfc82844-6.
Trofymow J.A., Barclay H.J., McCullough K. (1991). Annual rates and elemental concentrations of litter fall in thinned and fertilized Douglas-fir. Canadian Journal of Forest Research 21: 1601–1615. http://dx.doi.org/10.1139/x91-223.
Upadhyay V.P., Singh J.S. (1989). Patterns of nutrient immobilization and release in decomposing forest litter in Central Himalaya, India. Journal of Ecology 77: 127–146. http://dx.doi.org/10.2307/2260921.
Vitousek P.M., Matson P.A. (1984). Mechanisms of nitrogen retention in forest ecosystems: a field experiment. Science 225: 51–52. http://dx.doi.org/10.1126/science.225.4657.51.
Total of 45 references
