Tomi Kaakkurivaara  ,
Nuutti Vuorimies,
Pauli Kolisoja,
Jori Uusitalo
,
Nuutti Vuorimies,
Pauli Kolisoja,
Jori Uusitalo
Applicability of portable tools in assessing the bearing capacity of forest roads
Kaakkurivaara T., Vuorimies N., Kolisoja P., Uusitalo J. (2015). Applicability of portable tools in assessing the bearing capacity of forest roads. Silva Fennica vol. 49 no. 2 article id 1239. https://doi.org/10.14214/sf.1239
Highlights
- The dynamic cone penetrometer (DCP) and light falling weight deflectometer (LFWD) are useful tools for measuring bearing capacity
- The measurement results are not same as with the falling weight deflectometer (FWD), but comparable.
Abstract
Forest roads provide access to logging sites and enable transportation of timber from forest to mills. Efficient forest management and forest industry are impossible without a proper forest road network. The bearing capacity of forest roads varies significantly by weather conditions and seasons since they are generally made of poor materials and the constructed layers may be mixed with subgrade. A bearing capacity assessment is valuable information when trafficability is uncertain and rutting is obvious. In this study, bearing capacity measurements were carried out using the light falling weight deflectometer (LFWD), the dynamic cone penetrometer (DCP) and the conventional falling weight deflectometer (FWD). The aim was to compare their measurement results in relation to road characteristics and moisture conditions. Data were collected from 35 test road sections in four consecutive springs and during one summer. The test road sections had measurement points both on the wheel path and the centre line. The data show logical correlations between measured quantities, and the study presents reliable regression models between measuring devices. The results indicate that light portable tools, the DCP and the LFWD, can in most cases be used instead of the expensive falling weight deflectometer on forest roads.
Keywords
stiffness;
light weight deflectometer;
dynamic cone penetrometer;
falling weight deflectometer;
elastic modulus
-
Kaakkurivaara,
Natural Resources Institute Finland, Green technology, Kaironiementie 15, FI-39700 Parkano, Finland
E-mail
tomi.kaakkurivaara@gmail.com
- Vuorimies, Tampere University of Technology, P.O.Box 600, FI-33101 Tampere, Finland E-mail nuutti.vuorimies@tut.fi
- Kolisoja, Tampere University of Technology, P.O.Box 600, FI-33101 Tampere, Finland E-mail pauli.kolisoja@tut.fi
- Uusitalo, Natural Resources Institute Finland, Green technology, Kaironiementie 15, FI-39700 Parkano, Finland E-mail jori.uusitalo@luke.fi
Received 19 August 2014 Accepted 13 February 2015 Published 21 April 2015
Views 188489
Available at https://doi.org/10.14214/sf.1239 | Download PDF

1 Introduction
Forest roads are the backbone of forestry. They provide access to logging sites and enable transportation of timber from forest to mills. Efficient forest management and forest industry are impossible without a proper forest road network (Uusitalo 2010). Forest roads are part of the low volume road (LVR) network. The ’low volume road’ definition covers also public roads with average daily traffic (ADT) of less than 400 vehicles. Other features of these roads are low design speed and corresponding geometry. Many LVRs around the world consist of a single lane with gravel or even native surfacing (Coghlan 1999).
Forest roads differ in many ways from public low volume roads. For instance, they are owned by private individuals or forest companies and their design specifications with respect to bearing capacity, etc. are less demanding than those of public low volume roads in general. Construction and maintenance costs must also be kept low because of the strict profitability demands of forestry. Thus, road construction costs should reflect the frequency and intensity of use. As a consequence of these cost constraints, forest roads are generally made of poor materials and the constructed layers may be mixed with each other or the subgrade. The amount of forest roads in Finland is about 130 000 kilometres (Statistics Finland). They were constructed mainly between 1960–1990. Freeze-thaw cycles and seasonal changes are the most important factors affecting road condition and bearing capacity in northern regions. Many forest roads in Finland have reached the age when major renovation operations are needed before timber haulage can take place. The requirements for forest roads have also changed since the time they were originally constructed. Timber haulage to mills has become a year-round operation due to the forest industry’s demand for fresh round wood from the forest to the mills also in springtime. Previously timber was stored at the roadside and at terminals in winter before the roads started thawing out in spring. Nowadays companies want to avoid tying capital in stock and reduce storage costs. Forest roads are vital for year-round procurement, and knowledge of road conditions is one of the key factors for ensuring it.
An adequate forest road network comprises main, area and branch roads. Branch roads constitute the bulk of the forest road network and provide access to logging units except during the spring and autumn seasons. Area roads are arterial roads within a fairly large forest tract which should be able to withstand timber transportations in autumn. Main roads are built for operations in extensive forest areas to collect the traffic from branch and area roads (Pulkki 2003; Uusitalo 2010).
Forest roads are generally constructed partly from materials available at the road construction site, and partly of materials transported from elsewhere. Textbooks and road construction instructions divide forest road structures in two major structural elements: subgrade and pavement. The subgrade is composed of in-situ material and forms the underlying structural layer of the road. The pavement is built on the top of the subgrade and can be subdivided into a surface layer, a base-course layer and a sub-base layer. The sub-base layer is used to separate the upper layers of the pavement from the subgrade and is usually composed of coarse-grained sand or gravel, which cuts the capillary rise of water from the subgrade into the pavement. The base-coarse layer is generally made of coarse gravel material or crushed rock. These materials that give the road structure most of its load carrying capacity is generally called construction aggregate or simply “aggregate”. The surface layer is composed of finer high-quality crushed gravel or crushed rock (aggregate) (Pulkki 2003; Uusitalo 2010).
Many forest roads, especially lower category branch roads, lack the classic four layer structure described above. They often have only three major layers: subgrade, embankment fill that consists of material dug from ditches, and an aggregate layer of construction material brought from elsewhere. The stiffness of a forest road, often referred to as bearing capacity, is a characteristic often used in assessing the usability of forest roads. Measured values of stiffness can be basically used for two different purposes. Firstly, stiffness measures can be used to determine whether the road is in need of repair or not. Secondly, measured stiffnesses can also be used to assess the daily trafficability of the road during the thawing process in the spring time, since the biggest problems in bearing capacity occur then.
Many devices have been used to measure the bearing capacity of a road. However, many of them are not frequently used in assessing the properties of forest road layers. Most devices used to measure the bearing capacity of forest roads express the measurement results in terms of elastic modulus. The loading methods of the devices can be divided into four categories: static or slowly moving loads, wave propagation, vibration or the impulse method (George 2003). The impulse method is the most frequently used method today. Static methods such as the plate loading test are theoretically sound but are not applicable to the LVRs since it poorly mimics the load caused by moving traffic. The most popular device for forest roads applying the principle of the impulse method is the falling weight deflectometer (FWD) which fairly successfully mimics the wheel load of a truck. The FWD is commonly used on paved low volume roads in Finland, and sometimes also on forest roads (Saarenketo and Aho 2005). The device is trailer-mounted and pulled by a van. The measurement procedure is sophisticated and computer aided. The results of the measurements can be used to backcalculate stiffnesses of the structural layers of the road. The FWD can also be applied in assessing accessibility of forest roads during thaw-weakened periods (Miller et al. 2011). The drawback of this equipment is that FWD measuring services are expensive and need to be ordered well in advance of actual need. Today, inexpensive devices that weigh less and are easier to use than the traditional FWD are available. These portable small-scale devices are generally called light falling weight deflectometers (LFWD). The Loadman, manufactured in Finland, is a well-known LFWD device. It was initially designed for bound and unbound pavements to assess their bearing capacity and level of compaction. Besides the FWD and LFWD, the dynamic cone penetrometer (DCP) has probably been used most on forest roads during the last 10–20 years. The DCP’s measuring method is different from that of the FWD and the LFWD. It has a cone tip that penetrates into the soil and assesses the strength of the soil based on conversion parameters derived from empirical tests.
There are not many referenced studies on the usability and mutual conformity of the bearing capacity measurement devices for forest roads. Klvac et al. (2010) made a study with the Loadman on forest soils but did not find it applicable for assessing their bearing capacity. Pulkki (1982) studied the usability of the Benkelman beam (the plate loading test), the FWD and the light seismic method. He found the light seismic method a very promising tool for assessing the bearing capacity of forest roads. O’Mahony et al. (2000) studied forest access roads built on peat soils with the Benkelman beam. They noticed that the thickness of the peat substratum affected the bearing capacity of flexible pavements. Kestler et al. (2007) showed that the LFWD measured seasonal stiffness variations reliably. Its results compared well with FWD-derived moduli in the case of low volume roads.
Some studies have also been made to link measurement results to forest road or gravel road conditions. Siekmeier et al. (2009) studied the impact of soil type and moisture content of granular and fine grained soils on the DCP and LFWD. They found significant correlation between moisture content, DCP penetration rate and LFWD-measured moduli. They also observed that grain size distribution had a significant influence on DCP penetration rate. Dai and Kremer (2005) showed the relationship between DCP measured modulus, moisture content and soil densities. Mohammadi et al. (2008) tested and proved in a laboratory that DCP values correlate with the density of sandy soil. Most of the studies assessing the usability of measuring devices have targeted highways, which usually have thick structural layers and a hot mix asphalt surface. Pidwerbesky’s (1997b) study found that the Loadman and FWD were effective devices for determining the properties of a compacted unbound granular material and indicating future flexible pavement performance with respect to rutting whereas the Glegg Hammer and the Nuclear Density Meter were insufficient in these respects. George (2003) showed correlation between the DCP and FWD in paved roads. George and Uddin (2000) found clear correlations between the DCP, FWD and moisture content when the subgrades of a highway quality road were classified into fine grained and coarse grained. These studies were made on highways built according to established specifications. Construction of forest roads is commonly very loosely regulated in contrast to highways. Consequently, more information on the suitability of various stiffness measurement devices for building forest roads is needed.
The aim of this research was to evaluate the applicability of portable measuring tools, the Loadman and the DCP, in assessing the bearing capacity of forest roads. The evaluation was based on comparison of the measurement results of the portable tools and the FWD. The study also tried to establish connections between road characteristics and bearing capacity values. The accuracy of the DCP and Loadman measurement results must be adequate in order that the devices can replace the FWD. A quick and reliable method for evaluating bearing capacity would be valuable in maintenance and repair operations. It is easier to draw a conclusion based on measured values than mere visual observations.
2 Materials and methods
2.1 Test roads and collection of field data
The data used in this study were collected in 2009–2012. The study area was located in the Parkano and Ylöjärvi municipalities in western Finland. Data of five separate measurement rounds over a four-year time period were collected. One measurement round was carried out in summer and four in spring during the thawing period. The phase of the thawing process was not always the same in spring. Spring thaw in southern and western Finland usually starts between late April and early May and typically lasts till the end of May or beginning of June.
The data were collected from 24 test road sections. Location is presented in Fig. 1. The test road sections were established on roads of Metsähallitus, which administers state-owned forests in Finland. Ten test road sections were part of forest roads constructed on mineral soil and fourteen test road sections were part of roads built on peatland. In ten locations the test road sections on peat and mineral soil were less than 1000 metres apart on the same road. The remaining four test road sections were located on peat soil without a nearby reference section. The test road sections were planned so that the conditions of each section were quite homogeneous in terms of drainage, structure, topography, etc. All test roads had originally been built between the years 1960–1980.
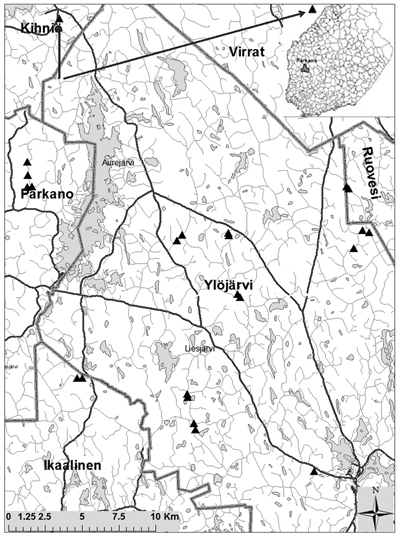
Fig. 1. Test road sections located nearby Parkano. Triangle symbols stand for location and lines stand for road. Two of test road sections located outside of map. A thin grey line indicates low volume road network.
Test road sections were 60 m long (Fig. 2) and comprised seven measurement points situated transversely and longitudinally along the road. The middle of each test section had three transverse measuring points (measuring points 3–5). Two measurement points were located in both directions from the middle of the test road section. Four of the seven measurement points were located on the wheel path and three on the centre line. Later, in the statistical analyses measurement points were divided into two classes: wheel path (WP) and centre line (CL) points. The measuring points were marked with poles at the road side. The DCP, Loadman and FWD (Fig. 3) were applied in measuring the stiffnesses of the test roads. The DCP and the Loadman tests were applied in all five measurement rounds while the FWD was used only in two and at a limited number of measurement points. One measurement round with the DCP and the Loadman took approximately four to five workdays from two persons. The FWD measurements were executed a couple of days before or after the Loadman and DCP measurements.
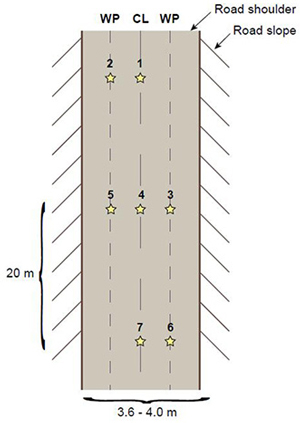
Fig. 2. Location of measurement points (star-symbol) along the test road section. Numbers 1–7 denote the measurement points, WP stands for wheel path and CL stands for centre line.
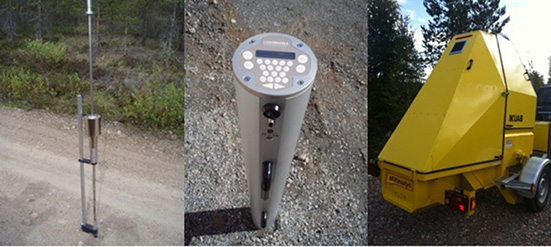
Fig. 3. Test devices, dynamic penetrometer (DCP), Loadman (LFWD) and falling weight deflectometer (FWD).
In summer 2009, a week before the second measurement round, a 2 metre wide cross-section was dug with an excavator from the surface to the bottom of the road structure. It was made as close to the centre line as possible, without disturbing the measurement points, yet enabling measurement of the thicknesses of the road’s structural layers, sampling for soil analyses and placement of ground water table level measurement tubes. The following layers could be detected in the cross section of the road structure: the aggregate layer, the embankment fill layer and the subgrade. The thickness of the aggregate and embankment fill layers was measured with a measuring tape. The thickness of the peat layer below these upper layers was measured with a 2 metre long peat thickness rod, and peat thickness more than 2 m was recorded as 2 m. In a couple of the test roads, it was impossible to distinguish between the aggregate and the embankment fill layers. In these cases the aggregate layer was regarded as 30 cm thick and the rest of the layer above the subgrade was regarded as embankment fill. This was done to allow calculating elastic modulus values for layers at various depths. Later in this study, the variables describing the thicknesses of the aggregate layer, the embankment fill layer and the subgrade (in case of a mineral subgrade) are called, ThicknessAggregate, ThicknessEmbankment and ThicknessSubgrade, respectively.
Almost half of the test road sections, four on mineral soils and seven on peat soils, were rehabilitated during the study – between the third and fourth measurement rounds. On the rehabilitated forest roads new materials or alternative rehabilitation methods were tested and compared to commonly used forest road aggregate (crushed rock or screened gravel). The new rehabilitation technologies used were geogrid, geotextile, blast furnace slag and logging residue bales. These methods were tested on eleven test sections. Four of them were built on frost susceptible mineral subsoil and seven on peatland subsoil. Repair operations were executed in summer 2010. New thicknesses of road layers were calculated for the rehabilitated roads to which aggregate had been added. The thickness of the additional aggregate layer, normally ten to twenty centimetres, was added to the original aggregate layer values. As a result, the data contains both road structures that have not been rehabilitated and ones that have been recently rehabilitated. Table 1 summarises the frequency of measurements of the study by test road, subgrade type, measurement round and whether the road was rehabilitated or not.
| Table 1. Summary of measuring devices is used in the study by test road, subgrade type and measurement round. The test roads rehabilitated during the study are shown on two consecutive rows with “a” denoting original road structure and “b” denoting rehabilitated road structure. “L” stands for the Loadman, “D” for the dynamic cone penetrometer and “F” for the falling weight deflectometer. | ||||||||
| Test road No. | Subgrade | Measurement round | ||||||
| Spring 2009 | Summer 2009 | Spring 2010 | Spring 2011 | Spring 2012 | Numbers of rounds | |||
| L, D | F | |||||||
| 41 | Mineral | L, D, F | L, D | L, D | L, D | L, D, F | 5 | 2 |
| 61 | Mineral | L, D, F | L, D | L, D | L, D | L, D, F | 5 | 2 |
| 71a | Mineral | L, D, F | L, D | L, D | 3 | 1 | ||
| 71b | L, D | L, D, F | 2 | 1 | ||||
| 111 | Mineral | L, D, F | L, D | L, D | L, D | L, D, F | 5 | 2 |
| 121 | Mineral | L, D, F | L, D | L, D | L, D | L, D, F | 5 | 2 |
| 131a | Mineral | L, D | 1 | |||||
| 131b | L, D | L, D, F | 2 | 1 | ||||
| 151 | Mineral | L, D, F | L, D | L, D | L, D | L, D, F | 5 | 2 |
| 211 | Mineral | L, D | L, D, F | 2 | 1 | |||
| 511a | Mineral | L, D, F | L, D | L, D | 3 | 1 | ||
| 511b | L, D | L, D, F | 2 | 1 | ||||
| 521a | Mineral | L, D, F | L, D | 2 | 1 | |||
| 521b | L, D | L, D, F | 2 | 1 | ||||
| Subtotal | 44 | 18 | ||||||
| 40 | Peat | L, D, F | L, D | L, D | L, D | L, D, F | 5 | 2 |
| 60a | Peat | L, D, F | L, D | L, D | 3 | 1 | ||
| 60b | L, D | L, D, F | 2 | 1 | ||||
| 70a | Peat | L, D, F | L, D | L, D | 3 | 1 | ||
| 70b | L, D | L, D, F | 2 | 1 | ||||
| 110a | Peat | L, D, F | L, D | L, D | 3 | 1 | ||
| 110b | L, D | L, D, F | 2 | 1 | ||||
| 120 | Peat | L, D, F | L, D | L, D | L, D | L, D, F | 5 | 2 |
| 140 | Peat | L, D | 1 | 0 | ||||
| 150 | Peat | L, D, F | L, D | L, D | L, D | L, D, F | 5 | 2 |
| 160 | Peat | L, D | 1 | 0 | ||||
| 200a | Peat | L, D | 1 | 0 | ||||
| 200b | L, D, F | 1 | 1 | |||||
| 210 | Peat | L, D | L, D, F | 2 | 1 | |||
| 250a | Peat | L, D, F | L, D | L, D | 3 | 1 | ||
| 250b | L, D | L, D, F | 2 | 1 | ||||
| 260 | Peat | L, D, F | L, D | L, D | L, D | L, D, F | 5 | 2 |
| 510a | Peat | L, D, F | L, D | L, D | 3 | 1 | ||
| 510b | L, D | L, D, F | 2 | 1 | ||||
| 520a | Peat | L, D | 1 | 0 | ||||
| 520b | L, D | L, D, F | 2 | 1 | ||||
| Subtotal | 54 | 21 | ||||||
| Total | 98 | 39 | ||||||
The quantity of water inside the road structure was monitored in two different ways. The level of the ground water table (GWT) was measured for every test road section using tubes installed in the road structures in summer 2009. A tube was typically installed in the road slope near the road shoulder. The level of the ground water table was compared to the road surface level. The volumetric water content (VWC) of the surface layer of the road was measured with a portable electronic soil moisture probe, TDR 300 (FieldScout Ltd.), using 72 mm long rods. The VWC readings were measured from three different locations inside the test road sections: the first location was between measuring points 1 (CL) and 2 (WP), the second was between 3 (WP) and 5 (WP) and the third between 6 (WP) and 7 (CL). Three different readings were taken from each location to calculate an average value meaning that altogether nine readings were taken from each test road section. The GWT and VWC measurements were carried out simultaneously with the DCP and Loadman devices. A malfunction of the TDR 300 prevented measurements during the last round.
2.2 Measuring devices
The DCP device used in the study was the K-100 Int manufactured by Kessler Soils Engineering Products, Inc. The principle of the measurement is as follows: an 8-kg mass is dropped onto an anvil from a height of about 575 mm. The anvil rests on top of a 16-mm-diameter steel rod with a cone tip. The diameter of the cone is 20 mm and the angle of the tip is 60 degrees. A vertical scale about one metre in length is attached next to the steel rod for measuring the vertical penetration of the rod. The steel rod penetrates into the ground as a consequence of the drops. The penetration from one drop or average penetration from several drops is called the DPI = the DCP Penetration Index (mm / blow). These DPI values can be documented by hand or automatically by a magnetic ruler. Measurement is continued until the maximum or desired depth is reached or the cone no longer penetrates (Hossain and Apeagyei 2010; ASTM 2005).
There is no direct theoretical relationship between the DPI and elastic modulus. However, DPI values can be converted to elastic modulus by empirical equations. First they are converted to California Bearing Ratio values (CBR) by one of many different equations. This study used Eq. 1 formulated by the U.S. Army Engineers Waterways Experimental Station (Webster et al. 1992):
![]()
where
CBR = California Bearing Ratio [%]
DPI = DCP Penetration Index [mm / blow].
Other researchers and professionals have also used this equation in their studies (Livneh et al. (1995); Siekmeier et al. 1999). Different equations have been compared in several studies during last two decades. Wu and Sargand (2007) reached to a conclusion that Eq. 1 is the best choice for convert cone penetration resistance to CBR.
The estimated CBR value can be converted to elastic modulus (E-modulus) by another empirical equation. Eq. 2, presented by the Transport and Road Research Laboratory in the United Kingdom, was used in this research
![]()
where
E = oil elastic modulus [MPa]
CBR = California Bearing Ratio [%].
Soil elastic modulus values, initially measured by DCP and then derived by these two equations (1 and 2), are hereafter referred to as EDCP. These empirical equations were transformed measurement results to comparable form. DCP doesn’t directly measure elastic modulus. Elastic modulus value includes also impact of the accuracy and correlation of testing device and surroundings. Since measuring with the DCP is rather laborious, the minimum number of blows was set to 32 per measurement point. The weight was dropped until the depth of 40 cm was achieved.
The LFWD used was the Loadman developed by AL-Engineering Ltd of Finland. A mass of 10 kg was dropped within the device from a height of 800 mm against a plate that had an accelerometer. Deflection was obtained by integrating acceleration. The diameter of the loading plate was 132 mm. The weight was first attached to the upper part of the device with an electromagnet and then released by pressing the drop button. During measurement, the Loadman must be in a vertical position and the loading plate in full contact with the underlying soil. The results of measurements are expressed in terms of maximum deflection (mm), elastic modulus (MPa) and compaction ratio. The compaction ratio is the ratio of subsequent measurements to the initial measurements at the same measuring point.
Internal electronics translate the acceleration into displacement, and a modulus value is calculated using the following equation using the known load (Pidwerbesky 1997a and 1997b):
![]()
where
∆ = deflection under the Loadman baseplate
p = vertical pressure on the base plate
a = radius of the base plate
Eq. 3 is widely used all around the world. Thus, it is no direct connection between the reflection and elastic modulus. It is based on empirical and well tested equation. In addition to Loadman also FWD is using same equation. The measurement results are displayed instantaneously on a liquid crystal display (LCD screen) and stored into the memory files of the device. The memory files can be transferred to PC via USB. The device can be easily reset by turning it upside down so that the weight locks in its original position. The manufacturer recommends taking various measurements from each measuring point. Gros (1993) recommended using the third measurement in the case of unbound pavements since the top surface of the road must be allowed to stabilise for more accurate results. This study used the elastic modulus determined on the basis of the third measurement. The E-modulus from the Loadman is denoted as ELFWD in this article.
A conventional FWD was the third device used to determine elastic modulus in this study (a Kuab FWD manufactured in Sweden)(Fig. 4). The operating principle of the measurement was the following. A dynamic impulse load was exerted on the road surface simulating a moving wheel load while the loading plate was in contact with the road surface. In this study, the falling weight was dropped from four different heights onto the loading plate. The load impact of the fourth drop was equal to a mass of 5000 kg normally used in calculations. The deflections were measured with seismometers placed at certain distances from the loading plate. The FWD creates deflection curves, which provide information about the road structures’ capacity to carry dynamic loads. The shape of the deflection bowl is a function of many variables including thickness and stiffness of the pavement layers and subgrade. Typically, the outer FWD sensors react more to subgrade behaviour and the inner sensors to that of upper layers (Miller et al. 2011).
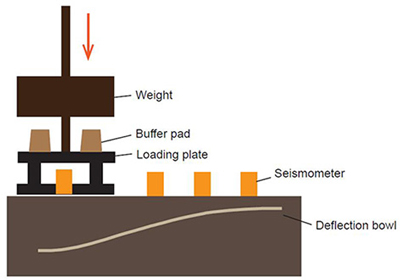
Fig. 4. Operating principle of falling weight deflectometer (Spoof and Petäjä 2000).
The elastic modulus from FWD tests is calculated with the same Eq. 3 used with the Loadman. Later in the text, EFWD indicates elastic modulus of the whole structure measured with the FWD. Surface deflection values obtained from FWD testing at various radial distances were used as index parameters. The Base Curvature Index (BCI) was calculated by subtracting deflection values 1200mm from the centre of the plate (D1200) from deflection values 900mm from the plate (D900). It is usually used to describe behaviour of the subgrade. Similarly, the Surface Curvature Index (SCI 200) is calculated by subtracting D200 values from D0 deflection indices, and SCI300 by subtracting D300 values from D0 deflection values. SCI200 and SCI300 are typically used to indicate properties of the base course layer. The other deflection values, D300–450 and D450–600, used in this study were calculated similarly as the differences between sensors D300, D450 and D600, respectively. These indices are intended to describe the stiffness of the structure at intermediate depth. The rule of thumb is that deflection values at certain distances from the plate can be used as indicators of the stiffness of the road layer at the corresponding distances from the plate in the vertical direction.
2.3 Laboratory analyses
Particle size distributions were determined from soil samples of the test road sections using the wet sieving and pipette methods. Samples were collected at the same time as ground water table measuring tubes were installed in the ground. One soil sample was taken from each layer of the road section. Since one or two layers above subsoil were investigated, and subsoil samples were not taken from road sections constructed on peat, one to three samples were collected from each test section. In deviation from the normal procedure of determining the particle size distribution of road aggregates, sieve sizes 0.63, 2, 6.3 and 20 mm were used. Organic content of the samples was determined for grain sizes less than 2 mm using the burning method.
Each plotted grain size distribution curve was compared to the design grading curves of the Finnish Transport Agency (Finra 2005), which are used to estimate E-moduli in the Odemark bearing capacity design method of roads. Accordingly, theoretical E-values derived from grain size distribution were determined for each sample. Frost susceptibility of the samples was also estimated according to the design grading curves of Finnish guidelines (Finra 1993) which are also recommended by ISSMFE (1989) for soil aggregates. If the grain size distribution of a sample was not analogous to the design grading curves, and the sample was frost susceptible, smaller estimated E-modulus was used as the DCP, LFWD and FWD measurements were mainly done in spring. High organic content of a sample could also be a reason for reducing the E-modulus of a sample. The lowest used modulus was 20 MPa and the highest 200 MPa. Later in the text, variable Aggregate EGSD, Embankment fill EGSD and Subgrade EGSD refer to E-moduli estimations based on grain size distributions of the aggregate layer, embankment fill layer and subgrade layer, respectively.
3 Results
3.1 Road structures
Mean values and variation of thicknesses of soil layers and E-moduli estimations based on grain size distributions are presented in Table 2. The mean EGSD values were 9 MPa higher for an aggregate layer and 17 MPa higher for an embankment fill layer on peat subgrade than those on a mineral soil subgrade. Thickness of the aggregate layer was about the same with both subgrade types whereas embankment fills were on average 14 cm thicker on peat than on mineral soil subgrade.
| Table 2. Mean, minimum and maximum thicknesses and grain size distributions (GSD) of road structural layers. | ||||||
| Thickness of aggregate layer, cm | Thickness of embankment fill, cm | Thickness of peat, cm | Aggregate layer EGSD, MPa | Embankment fill EGSD, MPa | Subgrade EGSD, MPa | |
| Mineral | ||||||
| Mean | 24 | 37 | 138 | 49 | 31 | |
| N | 8 | 8 | 8 | 8 | 8 | |
| Min | 6 | 11 | 50 | 15 | 15 | |
| Max | 32 | 55 | 200 | 70 | 50 | |
| Peat | ||||||
| Mean | 23 | 51 | 145 | 147 | 66 | |
| N | 10 | 13 | 5 | 10 | 11 | |
| Min | 13 | 11 | 70 | 15 | 15 | |
| Max | 43 | 86 | 185 | 200 | 200 | |
3.2 Water content
Table 3 presents detailed information about VWC and GWT levels of each test road section. The GWT varied between 22 and 217 cm from the road surface. In general, it was closer to the surface with a peat subgrade than with a mineral subgrade. The mean VWC was approximately 13% in each measuring round. The highest average value of a measuring round was 18% in spring 2010. Mean VWCs with peat subgrades were similar to those with mineral subgrades.
| Table 3. Mean volumetric water content (VWC) and ground water table (GWT) by test road section and time of measurement round. N stands for number of measurements by VWC device. | ||||||||||||
| Test road N:o | Subgrade | Spring 2009 | Spring 2009 | Spring 2010 | Spring 2011 | Spring 2012 | ||||||
| VWC | VWC | VWC | GWT | VWC | GWT | GWT | ||||||
| Mean (std. dev.) | N | Mean (std. dev.) | N | Mean (std. dev.) | N | Mean (std. dev.) | N | |||||
| 41 | Mineral | 6 (0) | 3 | 11 (0) | 3 | 15 (0) | 3 | 65 | 9 (1) | 3 | 75 | 55 |
| 61 | Mineral | 9 (1) | 3 | 6 (1) | 3 | 22 (4) | 3 | 178 | 179 | 181 | ||
| 71a | Mineral | 16 (2) | 3 | 14 (2) | 3 | 18 (2) | 3 | 124 | ||||
| 71b | Mineral | 130 | 120 | |||||||||
| 111 | Mineral | 17 (2) | 3 | 13 (3) | 19 (3) | 3 | 93 | 93 | 82 | |||
| 121 | Mineral | 13 (2) | 3 | 7 (3) | 3 | 13 (2) | 3 | 67 | 11 (0) | 3 | 71 | |
| 131a | Mineral | 22 (09 | 3 | |||||||||
| 131b | Mineral | 17 (1) | 3 | 103 | 60 | |||||||
| 151 | Mineral | 12 (2) | 3 | 12 (2) | 3 | 18 (1) | 3 | 92 | 17 (1) | 3 | 67 | 66 |
| 211 | Mineral | |||||||||||
| 511a | Mineral | 16 (6) | 3 | 13 (3) | 3 | 16 (2) | 3 | 222 | ||||
| 511b | Mineral | 5 (0) | 3 | 136 | ||||||||
| 521a | Mineral | 21 (2) | 3 | 110 | ||||||||
| 521b | Mineral | 8 (2) | 3 | 107 | ||||||||
| 40 | Peat | 7 (1) | 3 | 12 (1) | 3 | 13 (2) | 3 | 72 | 15 (0) | 3 | 73 | 65 |
| 60a | Peat | 12 (0) | 3 | 8 (1) | 3 | 22 | ||||||
| 60b | Peat | 58 | ||||||||||
| 70a | Peat | 10 (3) | 3 | 16 (4) | 3 | 18 (2) | 3 | |||||
| 70b | Peat | 82 | 72 | |||||||||
| 110a | Peat | 16 (2) | 3 | 13 (2) | 3 | 17 (3) | 3 | 60 | ||||
| 110b | Peat | 11 (2) | 3 | 53 | 46 | |||||||
| 120 | Peat | 16 (0) | 3 | 11 (1) | 3 | 18 (2) | 3 | 73 | 11 (0) | 3 | 73 | |
| 140 | Peat | 21 (1) | 3 | |||||||||
| 150 | Peat | 12 (2) | 3 | 16 (3) | 3 | 15 (2) | 3 | 71 | 7 (2) | 3 | 72 | 64 |
| 160 | Peat | |||||||||||
| 200a | Peat | |||||||||||
| 200b | Peat | 48 | ||||||||||
| 210 | Peat | 102 | 94 | |||||||||
| 250a | Peat | 3 (0) | 3 | 6 (1) | 3 | 22 (4) | 3 | 57 | ||||
| 250b | Peat | 65 | 82 | |||||||||
| 260 | Peat | 6 (1) | 3 | 8 (2) | 3 | 16 (1) | 3 | 57 | 44 | |||
| 510a | Peat | 14 (4) | 3 | 13 (3) | 3 | 21 (2) | 3 | 56 | ||||
| 510b | Peat | 6 (0) | 3 | 217 | 42 | |||||||
| 520a | Peat | 22 (1) | 3 | |||||||||
| 520b | Peat | 14 (1) | 3 | 48 | 32 | |||||||
3.3 Stiffnesses of road structures
Tables 4 and 5 present the mean stiffnesses measured with the Loadman (ELFWD), DCP (EDCP) and FWD (EFWD) classified by measurement point location (WP or CL) and measurement round for test road sections on mineral subgrade and peatland, respectively. There were no notable differences between ELFWD values either on the centre line or the wheel path in the case of mineral and peat subgrades. Instead, EDCP values were slightly higher both on the centre line and the wheel path on peat subgrades compared to mineral subgrades. ELFWD values were about two times higher on the wheel path than the centre line for both subgrade types. EDCP values were also clearly higher on the wheel path than the centre line on peat subgrades. Another significant finding was that EDCP values varied relatively less than ELFWD values between the years.
| Table 4. Means (and standard deviations) of stiffnesses at all measurement points measured with the Loadman (ELFWD), dynamic cone penetrometer (EDCP) and falling weight deflectometer (EFWD) classified by measurement classes wheel path (WP) and centre line (CL) and measurement round of test road sections over a mineral subgrade. | ||||||||||||
| Mineral | WP | CL | ||||||||||
| ELFWD, Mpa | EDCP, MPa | EFWD, MPa | ELFWD, MPa | EDCP, MPa | EFWD, MPa | |||||||
| Mean (std. dev.) | N | Mean (std. dev.) | N | Mean (std. dev.) | N | Mean (std. dev.) | N | Mean (std. dev.) | N | Mean (std. dev.) | N | |
| Spring 2009 | 97 (28) | 32 | 132 (27) | 28 | 56 (22) | 8 | 45 (12) | 23 | 86 (27) | 21 | ||
| Spring 2010 | 63 (23) | 38 | 106 (28) | 30 | 35 (10) | 27 | 81 (15) | 21 | ||||
| Spring 2011 | 66 (25) | 42 | 124 (45) | 42 | 35 (11) | 30 | 76 (15) | 30 | ||||
| Spring 2012 | 54 (21) | 41 | 101 (24) | 42 | 49 (16) | 19 | 32 (12) | 30 | 79 (20) | 30 | 28 (9) | 10 |
| Average | 70 (24) | 116 (31) | 53 (19) | 37 (11) | 81 (19) | 26 | 28 (9) | |||||
| Summer 2009 | 113 (31) | 28 | 159 (50) | 28 | 57 (22) | 21 | 94 (33) | 21 | ||||
| Table 5. Means (and standard deviations) of stiffnesses at all measurement points measured with the Loadman (ELFWD) and dynamic cone penetrometer (EDCP) classified by measurement classes wheel path (WP) and centre line (CL) and measurement round of roads over a peat subgrade. | ||||||||||||
| Peat | WP | CL | ||||||||||
| ELFWD, MPa | EDCP, MPa | EFWD, MPa | ELFWD, MPa | EDCP, MPa | EFWD, MPa | |||||||
| Mean (std. dev.) | N | Mean (std. dev.) | N | Mean (std. dev.) | N | Mean (std. dev.) | N | Mean (std. dev.) | N | Mean (std. dev.) | N | |
| Spring 2009 | 103 (24) | 36 | 144 (19) | 34 | 47 (25) | 10 | 49 (17) | 26 | 94 (36) | 27 | ||
| Spring 2010 | 63 (18) | 52 | 122 (28) | 45 | 43 (21) | 39 | 92 (21) | 36 | ||||
| Spring 2011 | 85 (21) | 44 | 146 (43) | 36 | 40 (14) | 33 | 95 (33) | 27 | ||||
| Spring 2012 | 65 (25) | 48 | 127 (34) | 48 | 46 (19) | 24 | 34 (14) | 36 | 91 (28) | 35 | 29 (11) | 12 |
| Average | 79 (22) | 135 (31) | 47 (22) | 42 (17) | 93 (30) | 29 (11) | ||||||
| Summer 2009 | 113 (24) | 36 | 173 (38) | 36 | 55 (23) | 27 | 109 (40) | 27 | ||||
3.4 Correlations
Correlation coefficients between stiffnesses measured with the LFWD (ELFWD), DCP (EDCP) and FWD (EFWD) are given separately for test road sections with a mineral subgrade (Table 6a) and a peat subgrade (Table 6b). Correlations between EDCP and ELFWD were strong on the wheel path and moderate on at the centre line on both soil types. The highest correlations were found on wheel paths over a mineral subgrade. ELFWD and EFWD correlated moderately on the wheel path with both subgrade types; correlation was particularly strong on centre lines over peat subgrades. Moderate correlation between the values of EDCP and EFWD was observed on wheel paths over mineral subgrades. Correlations between VWC and ELFWD as well as VWC and EDCP were moderate or weak with both subgrade types. No correlation was found between EFWD and VWC and is therefore not presented in Table 6. Correlations were statistically significant except between EDCP and EFWD on centre lines and wheel paths over peat subgrades as well as between EDCP and VWC of peat subgrades.
| Table 6a. Correlation coefficients between stiffnesses measured with the Loadman (ELFWD), dynamic cone penetrometer (EDCP) and falling weight deflectometer (EFWD) classified by measurement classes wheel path (WP) and centre line (CL) on test roads over a mineral subgrade. P-values and the number of observations are given in the rows below the coefficient. Values in bold indicate that the calculated correlation is statistically significant (P-value < 0.05). | ||||||
| Mineral | WP | CL | ||||
| EDCP | EFWD | EDCP | EFWD | VWC | ||
| WP | ELFWD | 0.707 | 0.572 | |||
| 0.000 | 0.002 | |||||
| 169 | 26 | |||||
| EDCP | 0.559 | |||||
| 0.003 | ||||||
| 26 | ||||||
| CL | ELFWD | 0.458 | 0.635 | –0.412 | ||
| 0.000 | 0.049 | 0.000 | ||||
| 123 | 10 | 90 | ||||
| EDCP | 0.599 | –0.291 | ||||
| 0.067 | 0.007 | |||||
| 10 | 84 | |||||
| Table 6b. Correlation coefficients between stiffnesses measured with the Loadman (ELFWD), dynamic cone penetrometer (EDCP) and falling weight deflectometer (EFWD) classified by measurement classes wheel path (WP) and centre line (CL) on test roads over a peat subgrade. P-values and the number of observations are given in the rows below the coefficient. Values in bold indicate that the calculated correlation is statistically significant (P-value < 0.05). | ||||||
| Peat | WP | CL | ||||
| EDCP | EFWD | EDCP | EFWD | VWC | ||
| WP | ELFWD | 0.591 | 0.441 | |||
| 0.000 | 0.010 | |||||
| 199 | 33 | |||||
| EDCP | 0.307 | |||||
| 0.082 | ||||||
| 33 | ||||||
| CL | ELFWD | 0.462 | 0.912 | –0.267 | ||
| 0.000 | 0.000 | 0.000 | ||||
| 274 | 12 | 191 | ||||
| EDCP | 0.349 | –0.400 | ||||
| 0.266 | 0.063 | |||||
| 12 | 180 | |||||
Correlation coefficients between stiffnesses measured with the LFWD (ELFWD), DCP (EDCP) and deflection bowl indices are given separately for test road sections on a mineral subgrade (Table 7a) and a peat subgrade (Table 7b). Correlations between SCI200 and ELFWD and SCI200 and EDCP were strong or moderate on the wheel path over both peat and mineral subgrades. On the other hand, there was no correlation between SCI200 and ELFWD and SCI200 and EDCP on centre lines. Strong correlations between SCI 300 and ELFWD and SCI300 and EDCP were observed on wheel paths over mineral subgrades while moderate correlations were found on wheel paths over peat subgrades. SCI300 had strong correlation with ELFWD and EDCP 0–300 on centre lines over peat subgrades. SCI300 had strong correlations with EDCP, EDCP 0–300 and EDCP 300- over mineral subgrades. D450–600 has strong correlations with EDCP and EDCP 0–300 on centre lines over mineral subgrades.
| Table 7a. Correlation coefficients between stiffnesses measured with the Loadman (ELFWD), dynamic cone penetrometer (EDCP), dynamic cone penetrometer measurement from surface layer (EDCP 0–300) and surface deflection values of falling weight deflectometer at various radial distances classified by wheel path (WP) and centre line (CL) on the mineral subgrade. P-values and the number of observations are given in the rows below the coefficient. Values in bold indicate that the calculated correlation is statistically significant (P-value < 0.05). | |||||||||
| Mineral | WP | CL | |||||||
| SCI 200 | SCI 300 | D 300–450 | D 450–600 | SCI 200 | SCI 300 | D 300–450 | D 450–600 | ||
| WP | ELFWD | –0.574 | –0.636 | –0.371 | –0.179 | ||||
| 0.002 | 0.000 | 0.062 | 0.381 | ||||||
| 26 | 26 | 26 | 26 | ||||||
| EDCP | –0.624 | –0.670 | –0.337 | –0.222 | |||||
| 0.001 | 0.000 | 0.093 | 0.276 | ||||||
| 26 | 26 | 26 | 26 | ||||||
| CL | ELFWD | 0.046 | –0.324 | –0.402 | –0.592 | ||||
| 0.900 | 0.361 | 0.250 | 0.072 | ||||||
| 10 | 10 | 10 | 10 | ||||||
| EDCP | –0.136 | –0.708 | –0.341 | –0.633 | |||||
| 0.708 | 0.022 | 0.335 | 0.049 | ||||||
| 10 | 10 | 10 | 10 | ||||||
| EDCP 0–300 | –0.048 | –0.755 | –0.481 | –0.640 | |||||
| 0.896 | 0.012 | 0.159 | 0.046 | ||||||
| 10 | 10 | 10 | 10 | ||||||
| EDCP 300- | –0.188 | –0.734 | –0.245 | –0.260 | |||||
| 0.603 | 0.016 | 0.495 | 0.469 | ||||||
| 10 | 10 | 10 | 10 | ||||||
| Table 7b. Correlation coefficients between stiffnesses measured with the Loadman (ELFWD), dynamic cone penetrometer (EDCP), dynamic cone penetrometer measurement from surface layer (EDCP 0–300) and surface deflection values of falling weight deflectometer at various radial distances classified by wheel path (WP) and centre line (CL) on the peat subgrade. P-values and the number of observations are given in the rows below the coefficient. Values in bold indicate that the calculated correlation is statistically significant (P-value < 0.05). | |||||||||
| Peat | WP | CL | |||||||
| SCI 200 | SCI 300 | D 300–450 | D 450–600 | SCI 200 | SCI 300 | D 300–450 | D 450–600 | ||
| WP | ELFWD | –0.503 | –0.470 | –0.183 | –0.095 | ||||
| 0.003 | 0.006 | 0.307 | 0.599 | ||||||
| 32 | 33 | 33 | 33 | ||||||
| EDCP | –0.403 | –0.503 | 0.057 | 0.013 | |||||
| 0.022 | 0.003 | 0.752 | 0.942 | ||||||
| 32 | 33 | 33 | 33 | ||||||
| CL | ELFWD | –0.173 | –0.636 | –0.554 | –0.375 | ||||
| 0.590 | 0.026 | 0.062 | 0.230 | ||||||
| 12 | 12 | 12 | 12 | ||||||
| EDCP | 0.366 | –0.391 | –0.564 | –0.230 | |||||
| 0.242 | 0.209 | 0.056 | 0.471 | ||||||
| 12 | 12 | 12 | 12 | ||||||
| EDCP 0–300 | 0.042 | –0.590 | –0.114 | –0.163 | |||||
| 0.896 | 0.043 | 0.725 | 0.612 | ||||||
| 12 | 12 | 12 | 12 | ||||||
| EDCP 300- | 0.200 | –0.030 | 0.019 | 0.070 | |||||
| 0.534 | 0.926 | 0.829 | 0.829 | ||||||
| 11 | 12 | 12 | 12 | ||||||
The correlation coefficient between stiffness measured with the LFWD (ELFWD), DCP (EDCP), FWD (EFWD) and the grain size distribution derived E-modulus values are given separately for test roads on a mineral subgrade (Table 8a) and a peat subgrade (Table 8b). In the case of mineral subgrades, at least a moderate positive relationship of statistical significance was observed between ELFWD and EGSD of the aggregate layer as well as between EDCP and EGSD of the subgrade layer on the centre line. In the case of mineral subgrade, a strong negative relationship of statistical significance was observed between ELFWD and EGSD of the embankment fill layer as well as between EDCP and EGSD of the embankment fill layer on the wheel path, which is peculiar. In the case of peat subgrade, even a moderate positive relationship of statistical significance was only observed when EGSD of the embankment fill layer was compared to EDCP or ELFWD. Calculated EFWD correlations were not statistically significant.
| Table 8a. Correlation coefficients between stiffnesses measured with the Loadman, dynamic cone penetrometer and Falling weight Deflectometer and corresponding stiffnesses derived from soil samples from the mineral subgrade. EGSD refer to elastic modulus estimations based on grain size distributions. WP stands for wheel path and CL stands for centre line. P-values and the number of observations are given in the rows below the coefficient. Values in bold indicate that the calculated correlation is statistically significant (P-value < 0.05) or strong (>0.400). | |||||||
| Mineral | WP | CL | |||||
| ELFWD | EDCP | EFWD | ELFWD | EDCP | EFWD | ||
| WP | Aggregate EGSD | 0.351 | 0.199 | 0.367 | |||
| 0.049 | 0.275 | 0.179 | |||||
| 32 | 32 | 15 | |||||
| Embankment fill EGSD | –0.413 | –0.558 | –0.300 | ||||
| 0.014 | 0.000 | 0.241 | |||||
| 35 | 36 | 17 | |||||
| Subgrade EGSD | 0.019 | –0.112 | 0.354 | ||||
| 0.923 | 0.570 | 0.215 | |||||
| 27 | 28 | 14 | |||||
| CL | Aggregate EGSD | 0.415 | –0.212 | –0.196 | |||
| 0.044 | 0.320 | 0.642 | |||||
| 24 | 24 | 8 | |||||
| Embankment fill EGSD | –0.479 | –0.107 | –0.101 | ||||
| 0.012 | 0.596 | 0.797 | |||||
| 27 | 27 | 9 | |||||
| Subgrade EGSD | 0.201 | 0.449 | 0.652 | ||||
| 0.382 | 0.041 | 0.113 | |||||
| 21 | 21 | 7 | |||||
| Table 8b. Correlation coefficients between stiffnesses measured with the Loadman, dynamic cone penetrometer and Falling weight Deflectometer and corresponding stiffnesses derived from soil samples from the peat subgrade. EGSD refer to Elastic modulus estimations based on grain size distributions. WP stands for wheel path and CL stands for centre line. P-values and the number of observations are given in the rows below the coefficient. Values in bold indicate that the calculated correlation is statistically significant (P-value < 0.05) or strong (>0.400). | |||||||
| Peat | WP | CL | |||||
| ELFWD | EDCP | EFWD | ELFWD | EDCP | EFWD | ||
| WP | Aggregate EGSD | 0.248 | 0.172 | 0.101 | |||
| 0.123 | 0.288 | 0.673 | |||||
| 40 | 40 | 20 | |||||
| Embankment fill EGSD | 0.321 | 0.537 | 0.147 | ||||
| 0.033 | 0.000 | 0.514 | |||||
| 44 | 44 | 22 | |||||
| CL | Aggregate EGSD | 0.091 | 0.214 | 0.026 | |||
| 0.632 | 0.256 | 0.943 | |||||
| 30 | 30 | 10 | |||||
| Embankment fill EGSD | 0.346 | 0.561 | 0.417 | ||||
| 0.048 | 0.001 | 0.202 | |||||
| 33 | 32 | 11 | |||||
Tables 9a and 9b present correlations between deflection bowl indices measured using the FWD and grain size distribution derived stiffnesses. In the case of the aggregate layer, EGSD did not have any correlation of statistical significance with the deflection bowl parameters, except for D450–600 on the centre line over a peat subgrade. Correlations were not detected between EGSD of the subgrade layer and deflection bowl parameters measured from wheel paths over a mineral subgrade, but D300–450 and D450–600 indices on the centre line gave correlations of 0.68 and 0.75 with p-values 0.089 and 0.05 for EGSD of the subgrade layer. The embankment fill EGSD over a peat subgrade had a moderate correlation with SCI200 and SCI300 on the wheel path and strong correlation with SCI300 on the centre line. On centre lines over mineral subgrades, strong correlations were observed between the embankment fill EGSD and SCI200 and D300–450 but not with other deflection indices.
| Table 9a. Correlation coefficients between deflection bowl indices measured by the falling weight deflectometer and Elastic modulus of grain size distribution derived stiffnesses of mineral subgrade. WP stands for wheel path and CL stands for centre line. P-values and the number of observations are given in the rows below the coefficient. Values in bold indicate that the calculated correlation is statistically significant (P-value < 0.05). | |||||||||
| Mineral | WP | CL | |||||||
| SCI 200 | SCI 300 | D 300–450 | D 450–600 | SCI 200 | SCI 300 | D 300–450 | D 450–600 | ||
| WP | Aggregate EGSD | 0.004 | 0.028 | –0.045 | –0.011 | ||||
| 0.986 | 0.898 | 0.840 | 0.960 | ||||||
| 23 | 23 | 23 | 23 | ||||||
| Embankment fill EGSD | 0.332 | 0.249 | 0.172 | –0.300 | |||||
| 0.121 | 0.251 | 0.432 | 0.164 | ||||||
| 23 | 23 | 23 | 23 | ||||||
| Subgrade EGSD | –0.038 | –0.098 | –0.175 | –0.277 | |||||
| 0.874 | 0.679 | 0.460 | 0.238 | ||||||
| 20 | 20 | 20 | 20 | ||||||
| CL | Aggregate EGSD | 0.206 | –0.072 | 0.443 | 0.436 | ||||
| 0.625 | 0.866 | 0.271 | 0.280 | ||||||
| 8 | 8 | 8 | 8 | ||||||
| Embankment fill EGSD | –0.912 | –0.013 | –0.769 | –0.067 | |||||
| 0.002 | 0.975 | 0.026 | 0.875 | ||||||
| 8 | 8 | 8 | 8 | ||||||
| Subgrade EGSD | –0.567 | 0.106 | –0.683 | –0.748 | |||||
| 0.184 | 0.820 | 0.091 | 0.053 | ||||||
| 7 | 7 | 7 | 7 | ||||||
| Table 9b. Correlation coefficients between deflection bowl indices measured by the falling weight deflectometer and Elastic modulus of grain size distribution derived stiffnesses of peat subgrade. WP stands for wheel path and CL stands for centre line. P-values and the number of observations are given in the rows below the coefficient. Values in bold indicate that the calculated correlation is statistically significant (P-value < 0.05) | |||||||||
| Peat | WP | CL | |||||||
| SCI 200 | SCI 300 | D 300–450 | D 450–600 | SCI 200 | SCI 300 | D 300–450 | D 450–600 | ||
| WP | Aggregate EGSD | –0.314 | –0.323 | –0.055 | –0.092 | ||||
| 0.098 | 0.081 | 0.772 | 0.629 | ||||||
| 29 | 30 | 30 | 30 | ||||||
| Embankment fill EGSD | –0.474 | –0.400 | 0.181 | 0.206 | |||||
| 0.007 | 0.024 | 0.322 | 0.258 | ||||||
| 31 | 32 | 32 | 32 | ||||||
| CL | Aggregate EGSD | 0.181 | –0.089 | –0.292 | –0.646 | ||||
| 0.617 | 0.806 | 0.413 | 0.043 | ||||||
| 10 | 10 | 10 | 10 | ||||||
| Embankment fill EGSD | –0.246 | –0.804 | –0.187 | –0.133 | |||||
| 0.465 | 0.003 | 0.581 | 0.696 | ||||||
| 11 | 11 | 11 | 11 | ||||||
3.5 Comparison of measuring devices
Correlations between EFWD, ELFWD and EDCP are illustrated in Figs. 5, 6 and 7 in order to provide a better insight into the covariation of these variables. The relationship between the FWD and portable tools was weakest with low EFWD values (Figs. 5 and 6), especially with a peat subgrade. There is a clear linear relationship between the portable tools and the FWD although both used portable tools generally give higher stiffness estimates than the FWD.
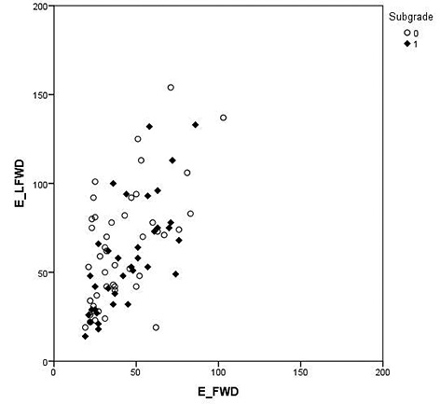
Fig. 5. Comparison of the Loadman (LFWD) and falling weight deflectometer (FWD) results classified by subgrade type: peat (0) and mineral (1). The Elastic modulus for Loadman and falling weight deflectometer are called ELFWD and EFWD, respectively.
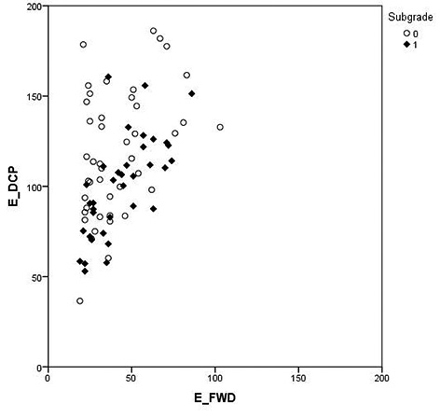
Fig. 6. Comparison of the dynamic cone penetrometer (DCP) and falling weight deflectometer (FWD) results classified by subgrade type: peat (0) and mineral (1). The elastic modulus for DCP and FWD are called EDCP and EFWD, respectively.
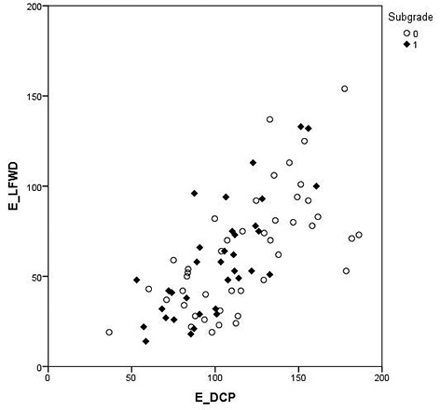
Fig. 7. Comparison of the Loadman (LFWD) and dynamic cone penetrometer (DCP) results classified by subgrade type: peat (0) and mineral (1). The Elastic modulus for Loadman and DCP are called ELFWD and EDCP, respectively.
Regression models for predicting the E-moduli of the FWD (EFWD) measured with portable tools in the case of peat soils are presented in Table 10. Models 1 and 3 are simple univariate regression models having only ELFWD or EDCP as an explanatory variable whereas models 2 and 4 include also the thickness of the aggregate layer (thicknessAggregate) as an explanatory variable. ThicknessAggregate has a significant impact on the goodness of regression models (Table 10).
| Table 10. Regression model predicted Elastic modulus for the falling weight deflectometer (EFWD) from Loadman (ELFWD) and dynamic cone penetrometer (EDCP) of roads built on peat subgrade soils. N = 44. SE stands for standard error. | ||||||||
| Model | 1 | 2 | 3 | 4 | ||||
| Parameter | Estimate (SE) | Sig. | Estimate (SE) | Sig. | Estimate (SE) | Sig. | Estimate (SE) | Sig. |
| Intercept | 18.9 (5.5) | 0.001 | 41.5 (9.2) | <0.001 | 11.9 (9.9) | 0.236 | 20.1 (16.3) | 0.231 |
| ELFWD | 0.352 (0.077) | <0.001 | 0.369 (0.084) | <0.001 | ||||
| EDCP | 0.248 (0.080) | 0.003 | 0.397 (0.123) | 0.004 | ||||
| ThicknessAggregate | –0.969 (0.266) | 0.001 | –1.12 (0.304) | 0.001 | ||||
| R2 | 0.327 | 0.596 | 0.183 | 0.487 | ||||
Regression models for predicting EFWD of a mineral subgrade are shown in Table 11. In mineral soils, ThicknessAggregate had no significant impact on the goodness of the models. The regression model for ELFWD of a mineral soil is rather similar to the one for ELFWD of a peat soil in terms of intercept and slope. However, the coefficient of determination of the regression model for ELFWD of a mineral subgrade (r2 = 0.508) is nearly two times higher than that of the regression model for a peat subgrade (r2 = 0.327). On the other hand, the regression models for predicting EFWD based on EDCP of peat and mineral soils are different. The regression model for predicting EFWD based on EDCP of peat soil provides a positive y-intercept, while that for mineral soil provides in practice the value 0. Regression models were also created to predict E-moduli for the LFWD (ELFWD) as a function of the DCP for both subgrade types (Table 12). The regression model for mineral subgrade soil provides a better coefficient of determination than the one for peat subgrade soil.
| Table 11. Regression models predicting Elastic modulus for the FWD (EFWD) from Loadman (ELFWD) and DCP (EDCP) of roads built on mineral subgrade soils. N = 35. SE stands for standard error. | ||||
| Model | 1 | 2 | ||
| Parameter | Estimate (SE) | Sig. | Estimate (SE) | Sig. |
| Intercept | 19.5 (4.8) | <0.001 | –0.7 (8.5) | 0.931 |
| ELFWD | 0.432 (0.073) | <0.001 | ||
| EDCP | 0.443 (0.082) | <0.001 | ||
| R2 | 0.508 | 0.596 | ||
| Table 12. Regression models predicting Elastic modulus for the Loadman (ELFWD) based on DCP measurements (EDCP) on roads built on peat and mineral subgrade soils. N = 35. SE stands for standard error. | ||||
| Model | Peat | Mineral | ||
| Parameter | Estimate (SE) | Sig. | Estimate (SE) | Sig. |
| Intercept | –10.8 (13.2) | 0.417 | –30.6 (13.8) | 0.033 |
| EDCP | 0.629 (0.107) | <0.001 | 0.878 (0.131) | <0.001 |
| R2 | 0.444 | 0.575 | ||
4 Discussion
The field studies were carried out during four consecutive springs (2009–2012) and during one summer period (2009). Measurements indicated the variation between the springs and pointed out the difference between spring and summertime. The measurements were carried out during a short time period within each measurement round which means that the material does not show the influence of the spring thaw progress on the stiffness at individual measurement points. It is, however, very likely that the test roads sections were at the time of measurement in different phases of spring thaw. Moreover, the means of the stiffnesses varied between springs. It can therefore be concluded that our measurements include extensive variation of bearing capacity during the spring thaw process of typical Finnish forest roads.
All the measurements were based on the use of a falling weight and the soil’s reaction to its impact. Although the principles of the measurement tools varied to some extent, elastic modulus values could be derived from each measurement result. The devices gave different results even though the measurements were carried out at the same measuring point. Each measuring device had its own method of measuring bearing capacity and especially their measuring influence depth varied resulting in the different measurement results. Penetration depth of the DCP was relative low particularly on wheel paths. In the interpretation of the results, it has to be taken into consideration that the DCP conversion equations have been made for subgrades and relative homogeneous soils which are not typical forest road construction materials. The embankment fill materials of this study consisted generally of soil materials from the surrounding area such as soil dug out while making ditches. That may affect the accuracy of the conversion equations. The correlation and regression analyses displayed a significant interrelationship between these devices.
The research results revealed that the subgrade type (peat or mineral soil) had a significant impact on the bearing capacity values. In general, bearing capacity measured with the portable tools was higher for a peat subgrade than a mineral subgrade. Our tests revealed that the quality of road materials in terms of grain size distribution of the aggregate and embankment fill layers was better in the case of peat subgrades. Thickness of the aggregate layer was about the same with both subgrade types. On the other hand, thickness of the embankment fill layer was clearly higher on peat. The results indicate that the thicker embankment fill layer and better quality of road materials are the likely reason for higher bearing capacity values of a peat subgrade.
Bearing capacities were measured both on wheel paths and centre lines. They were higher on wheel paths than the centre line. This result was logical due to the thicker and better compacted layers under wheel paths, especially of soils that thawed out. Bearing capacities were clearly lower in spring than in summer. There was also variation between springs: the data show that spring 2009 was dryer than others. EDCP values varied more widely than ELFWD values in each measuring round, but they varied less than ELFWD values between measuring rounds. The principle of the Loadman and the DCP are different: the Loadman measures upper parts of the road profile, while the DCP measures the whole road structure to the penetration depth of the cone.
Siekmeier (1999) found weak correlation between the DCP and the elastic deformation modulus measurement results with the Loadman, and that both portable tools were able to detect variation in stiffness. In this study, strong correlations were detected on the wheel path and moderate correlations on the centre line between DCP and LFWD. Deflection bowl indices of the FWD indicating stiffnesses of the topmost layers (SCI200 and SCI300) correlated with ELFWD and EDCP. The correlation coefficients were of the same level as between ELFWD and EFWD and EDCP and EFWD. As expected, deflection bowl indices of the FWD indicating stiffnesses of the lower layers (D300–450 and D450–600) did not correlate with ELFWD and EDCP on the wheel path. Segmentation of DCP results into two categories – upper part of DCP (EDCP 0–300) and lower part of DCP (EDCP 300-) – was not useful. In both of the above-mentioned cases the number of observations was limited and correlations were contradictory, which can lead to misinterpretations. Moreover, no correlation was detected between DCP or DCP300- and stiffnesses of deeper layers (D 300–450 or D 450–600).
The reliability of measuring devices depends on the structure of the road. According to Steinert et al. (2005), the Loadman derived composite moduli were compared to subbase moduli as based on the FWD for asphalt surfaced test sites. In their study, the Loadman produced coefficient of determination was 0.245. In Pidwerbesky’s study (1997a), the coefficient of determination between the Loadman and the FWD was 0.513 for an asphalt surfaced road. In this study, the coefficients of determination between the Loadman and the FWD were 0.327 for peat subgrades and 0.508 for mineral subgrades (Tables 10 and 11). Clear correlations were discovered between the Loadman and the SCI200 and SCI300 on the wheel path, but not with the Loadman and the indices for stiffnesses of deeper layers derived with the FWD. That is due to the Loadman’s measuring principle: it cannot measure deeper soil layers. Miller et al. (2007) found that the Loadman can measure only to a depth of about 20 cm from the surface. It seems that the Loadman is quite unreliable if deeper layers need to be studied. The same applies to the DCP when penetration depth is not deep enough. The few stiffness values derived from grain size distributions correlated with the results of the Loadman (8a and 8b). The determining factor seems to be the grain size distribution of the embankment fill layer rather than the aggregate layer. This may be due to a thin layer of aggregate and a heterogeneous layer structure.
Low EFWD values correspond to the very high range of E values derived from portable tools (Figs. 5 and 6). Embankment fills, and especially the subgrade, contained mainly poor materials which usually reduces EFWD values. ELWFD results depend mainly on thickness and quality of the upper layer, while FWD values are influenced by thickness and quality of all constructed layers and the subgrade. Deflection bowl indices measured by the FWD correlated with grain size distributions derived from stiffnesses of the embankment layer. Grain size distribution derived stiffness of aggregate layers did not correlate with deflection bowl indices predicting the stiffnesses of the topmost layers of the road profile (SCI200, SCI300). That was most likely due to the relatively thin aggregate layer.
As expected, volumetric water content had an influence on the bearing capacity values measured with the portable tools. However, the correlation was significant only on the centre line. Our test arrangements for detecting the water content of the road were rather limited. Only the VWC of the surface layer of the road was measured. In general, the GWT levels were relatively low – only on a few road sections was the GWT near ground surface. Therefore, no correlations were found between bearing capacity and GWT. Measurement of the VWC values of different layers of the road profiles would probably have given us more information on the relationship between bearing capacity and VWC and the relationships between the used measurement tools. The measured VWC has a bigger impact on ELFWD than EDCP values because their measurements concentrate on the upper part of the road.
Regression analyses indicated that a fairly reliable statistical model can be created for the portable tools and the FWD. In the case of mineral soils, univariate regression models that include only E-moduli values measured with portable tools can well predict E-moduli values for the FWD. In the case of a peat subgrade, the thickness of the aggregate layer must also be included in the regression models in order to achieve the same level of R2 as in the case of a mineral subgrade. It should be noted that when the bearing capacity of the actual peat subgrade is very low or non-existent, overall bearing capacity derives from the upper part of the road structure. Regression models between the DCP and Loadman provide the same level of determination of coefficient as portable tools and the FWD model. That implies that portable tools are applicable in determining bearing capacity and comparable to the conventional falling weight deflectometer.
The results indicate that the Loadman and DCP can in many circumstances be used as fairly reliable tools in assessing the stiffness of the road structure instead of the FWD. However, both the Loadman and the DCP have certain strengths and weaknesses that need to be taken into account in assessing the applicability of the tools. The Loadman is a reasonably reliable tool in measuring stiffnesses of the road surface layer. Thus, it can be used to estimate trafficability during the thawing process. On the other hand, the DCP is more suitable for defining thawing depths. The portable tools can be applied in planning timber haulage in order to avoid rutting of roads, particularly when transporting over a low volume road network during the thawing season. The measurement results can be used to prevent damage to the roads and to minimise the costs of rehabilitation. In the above described situation it is flexible, faster and cheaper to use portable tools than the FWD. In summer, portable tools can be also be used to analyse the rehabilitation needs of different sections of the forest road network. Summer time measurements can determine which roads are passable only in winter, which can also be used in dry summer conditions, and which can even be used in spring. If there is no need to know specific details of the road structure or subgrade, and information is needed mainly about the upper part of a road, the Loadman is suitable for assessing its trafficability. The DCP is suitable for assessing rehabilitation need. It can determine the stiffnesses of different layers and subgrade types and thicknesses of layers. Measurements with the DCP take more time than with the Loadman, and require higher expertise from the operator in using the results to improve stiffness. The DCP also provides more information about the reasons behind poor stiffness such as a thin layer of aggregate or poor quality of subgrade. In the above described situations, the cheap and easy-to-use portable tools are reasonably reliable substitutes for the FWD when making decisions about trafficability, maintenance and rehabilitation of forest roads.
Acknowledgements
The work described in this paper is part of ended research coordinated by Luke (Natural Resources Institute Finland) to test the suitability and cost-effectiveness of new road rehabilitation methods and techniques for improving trafficability of the Finnish low volume road network. The bulk of the funding for the research is provided by EU’s European Agricultural Fund for Rural Development: Europe investing in rural areas.
References
ASTM (2005). Standard test method for use of the Dynamic Cone Penetrometer in shallow pavement applications. ASTM D6951–03. American Society for Testing and Materials, West Conshohocken, PA, USA.
Chen D.-H., Lin D.-F., Liau P.-H., Bilyeu J. (2005). A correlation between Dynamic Cone Penetrometer values and pavement layer moduli. Geotechnical Testing Journal 28(1): 42–49.
Coghlan G. (1999). Opportunities for low-volume roads. Transportation in the Millennium: state of art and future directions. Transportation Research Board, National Research Council, TR News 205. p. 1–7.
Dai S., Kremer C. (2005). Improvement and validation of Mn/DOT DCP specifications for aggregate base materials and select granular test. Final Report 2005–32. Minnesota Department of Transportation. p. 1–50.
Finnish Statistical Yearbook of Forestry. (2013). Finnish Forest Research Institute. 449 p. [In Finnish].
Finra (1993). Yleiset perusteet. Tierakennustöiden yleiset laatuvaatimukset ja työselitykset. Kehittämiskeskus, Tielaitos, Helsinki. 46 p. [In Finnish].
Finra (2005). Tietoa tiensuunnitteluun nro 71D. Tie- ja geotekniikka, Tiehallinto. 13 p. [In Finnish].
George K.P. (2003). Falling Weight Deflectometer for estimating subgrade resilient moduli. Final report. Department of Civil Engineering, University of Mississippi. 113 p.
George K.P., Uddin W. (2000). Subgrade characterization for highway pavement design. Final report. Department of Civil Engineering, University of Mississippi. 143 p.
Gros C. (1993). Use of portable falling weight deflectometer; “Loadman”. University of Oulu, Publication of Road and Transport Laboratory 20.
Hossain S., Apeagyei A. (2010). Evaluation of the Lightweight Deflectometer for in-situ determination of pavement layer moduli. Virginia Transport Research Council Research Report, Final Report VTRC 10-R6. 35 p.
Loadman (2014). http://www.al-engineering.fi/fi/loadman.html. [Cited 22 April 2014].
Kestler M., Berg R., Steinert B., Hanek G., Truebe M., Humprey D. (2007). Determining when to place and remove spring load restrictions on low-cost roads. Transportation Research Record: Journal of the Transportation Research Board 1989: 219–229. http://dx.doi.org/10.3141/1989-67.
Kestler M., Berg R., Miller H., Steinert B., Eaton R., Larson G., Haddock J. (2011). Keeping springtime low-volume road damage to a minimum,Transportation Research Record: Journal of the Transportation Research Board 2205(3): 155–164. http://dx.doi.org/10.3141/2205-20.
Klvac R., Vrana R., Jirousek R. (2010). Possibilites of using the portable falling weight deflectometer to measure the bearing capacity and compaction of forest soils. Journal of Forest Science 56(3):130–136.
Livneh M., Ishai I., Livneh N. (1995). Effect of vertical confinement on Dynamic Cone Penetrometer strength values in pavement and subgrade evaluations. Transportation Research Record 1473: 1–8.
Miller P., Rinehart R., Mooney M. (2007). Measurement of static and dynamic soil stress and strain using in-ground instrumentation. In: Proc. Dynamic Response and Soil Properties, Geo-Denver 2007, February 18-21, 2007. p. 1–10. http://dx.doi.org/10.1061/40904(223)13.
Miller H., Kestler M., Amatrudo M., Eaton R., Hall A. (2011). Comparison of test sections of low-volume roadways reconstructed with conventional techniques and full-depth reclamation. Transportation Research Record: Journal of the Transportation Research Board 2204: 206–214. http://dx.doi.org/10.3141/2204-26.
Mohammadi S., Nikoudel M., Rahimi H., Khamehchiyan M. (2008). Application of the Dynamic Cone Penetrometer (DCP) for determination of the engineering parameters of sandy soils. Engineering Geology 101: 195–203. http://dx.doi.org/10.1016/j.enggeo.2008.05.006.
O’Mahony M., Ueberschaer A., Owende P., Ward S. (2000). Bearing capacity of forest access roads built on peat soils. Journal of Terramechanics 37: 127–138. http://dx.doi.org/10.1016/S0022-4898(00)00003-3.
Pidwerbesky B. (1997a). Predicting rutting in unbound granular basecourses from Loadman and other in-situ non-destructive tests. Road & Transport Research 6(3): 16–25.
Pidwerbesky B. (1997b). Evaluation of non-destructive in-situ tests for unbound granular pavements. IPENZ Transactions 24(1): 12–17.
Pulkki R. (1982). The development of an economical method for measuring the bearing capacity of forest roads. University of Helsinki, Department of Logging and Utilization of Forest products, Research Notes 42. 85 p.
Pulkki R. (2003). Minimizing negative environmental impacts of forest harvesting operations. Chapter 15. In: Burton P., Messier C., Smith D., Adamowicz W. (eds.). Towards sustainable management of the boreal forest. NCR Research Press, Ottawa, Ontario, Canada. p. 581–608.
Saarenketo T., Aho S. (2005). Managing spring thaw weakening on low volume roads. Roadex II Northern Periphery. 129 p.
Siekmeier J., Young D., Beberg D. (1999). Comparison of the Dynamic Cone Penetrometer with other tests during subgrade and granular base characterization in Minnesota. In: Tayabji S., Lukanen E. (eds.). Nondestructive testing of pavements and backcalculation of moduli: third volume. ASTM 1375. American Society for Testing and Materials, West Conshohocken, PA. p. 175–188.
Siekmeier J., Pinta C., Merth S., Jensen J., Davich P., Camargo F., Beyer M. (2009). Using the Dynamic Cone Penetrometer and Light Weight Deflectometer for construction quality assurance. Minnesota Department of Transportation, MN/RC 2009-12. 50 p.
Spoof H., Petäjä S. (2000). Pudotuspainelaitemittaus (PPL-mittaus). Tien pohja- ja päällysrakenteet tutkimusohjelma 1994–2001. Tiehallinto. 15 p. [In Finnish].
Steinert B., Humphrey D., Kestler M. (2005). Portable Falling Weight Deflectometer study. Report NETCR52. Department of Civil and Environmental Engineering, University of Maine. 277 p.
Uusitalo J. (2010). Introduction to forest operations and technology. JVP Forest Systems Oy, Finland. 287 p.
Webster S., Brown R., Porter J. (1994). Force projection site evaluation using the Electric Cone Penetrometer and the Dynamic Cone Penetrometer. U.S. Waterways Experimental Station, Technical Report GL-94-17. 44 p.
Webster S., Grau R., Williams P. (1992). Description and application of Dual Mass Dynamic Cone Penetrometer. U.S. Army Engineer Waterways Experiment Station, Instruction Report GL-92-3. 26 p.
Wu S., Sargand S. (2007) Use of dynamic cone penetrometer in subgrade and base acceptance, final report. Ohio Research Institute for Transportation and the Environment, Ohio University. 111 p
Total of 33 references
