Jonas Koala  ,
Louis Sawadogo,
Patrice Savadogo,
Ermias Aynekulu,
Janne Heiskanen,
Mohammed Saïd
,
Louis Sawadogo,
Patrice Savadogo,
Ermias Aynekulu,
Janne Heiskanen,
Mohammed Saïd
Allometric equations for below-ground biomass of four key woody species in West African savanna-woodlands
Koala J., Sawadogo L., Savadogo P., Aynekulu E., Heiskanen J., Saïd M. (2017). Allometric equations for below-ground biomass of four key woody species in West African savanna-woodlands. Silva Fennica vol. 51 no. 3 article id 1631. https://doi.org/10.14214/sf.1631
Highlights
- Species-specific equations for belowground biomass (BGB) predicted biomass with less bias than generic equations
- All the generic equations underestimated BGB
- For accurate estimation of BGB in savanna-woodlands, species-specific equations are needed for more species.
Abstract
Accurate estimates of both above-ground biomass (AGB) and below-ground biomass (BGB) are essential for estimating carbon (C) balances at various geographical scales and formulating effective climate change mitigation programs. However, estimating BGB is challenging, particularly for forest ecosystems, so robust allometric equations are needed. To obtain such equations for savanna-woodlands of the West African north sudanian zone, we selected four common native woody species (Anogeissus leiocarpa (DC.) Guill. & Perr., Detarium microcarpum Guill. & Perr., Piliostigma thonningii (Schumach.) Milne-Redh. and Vitellaria paradoxa C.F. Gaertn.). At two sites in Burkina Faso, we determined the BGB of 30 trees of each of these species by excavation, and measured various above-ground dimensional variables. The root:shoot ratio varied widely among the species, from 0.1 to 3.4. Depending on the species, allometric equations based on stem basal area at 20 cm height, basal area at breast height and tree height explained 50–95% of the variation in BGB. The best generic equation we obtained, based on basal area at 20 cm, explained 60% of the variation in BGB across the species. Three previously published generic allometric equations underestimated BGB by 8 to 63%. The presented equations should significantly improve the accuracy of BGB estimates in savanna-woodlands and help avoid costly needs to excavate root systems.
Keywords
root;
shoot ratio;
Burkina Faso;
biomass estimation;
species-specific equation;
root excavation
-
Koala,
Centre National de Recherche Scientifique et Technologique (CNRST), Institut de l’Environnement et de Recherches Agricoles (INERA), Département Productions Forestières, 03 BP 7047, Ouagadougou 03, Burkina Faso
E-mail
ezeyamb@yahoo.fr
- Sawadogo, Centre National de Recherche Scientifique et Technologique (CNRST), Institut de l’Environnement et de Recherches Agricoles (INERA), Département Productions Forestières, 03 BP 7047, Ouagadougou 03, Burkina Faso E-mail sawadogo_ls@hotmail.com
- Savadogo, World Agroforestry Centre & International Crop Research Institute for the Semi-Arid Tropics (ICRAF-ICRISAT), West and Central Africa Region-Sahel Node, BP 12404, Niamey, Niger E-mail savadogo.patrice@gmail.com
- Aynekulu, World Agroforestry Centre (ICRAF), United Nations Avenue, P.O. Box 30677-00100, Nairobi, Kenya E-mail e.betemariam@cgiar.org
- Heiskanen, University of Helsinki, Department of Geosciences and Geography, P.O. Box 68, FI-00014 University of Helsinki, Finland E-mail janne.heiskanen@helsinki.fi
- Saïd, International Livestock Research Institute (ILRI). P.O. Box 30709, Nairobi, Kenya E-mail m.said@cgiar.org
Received 28 April 2016 Accepted 5 May 2017 Published 22 May 2017
Views 170259
Available at https://doi.org/10.14214/sf.1631 | Download PDF

1 Introduction
Efforts to mitigate climate change under the Kyoto protocol have focused on carbon (C) sequestration in terrestrial ecosystems to counter increases in atmospheric levels of CO2 (Kumar and Nair 2011). One of the main sources of carbon dioxide (CO2) emissions affecting the global climate is degradation of tropical forests (Houghton et al. 1999; Fearnside 2000; Ciais et al. 2011). This degradation has both natural causes, such as large-scale forest fires, pests and disease outbreaks, and anthropogenic drivers, such as fuelwood harvesting, overgrazing, wildfire and conversion of forest to agricultural land (Houghton 2004; Ciais et al. 2011). Thus, to formulate effective mitigation programs, accurate estimates of amounts of C stored (and being gained or lost) in tropical forest ecosystems are required (Brown 2002; Fehrmann and Kleinn 2006).
The total C stock in any terrestrial ecosystem is the sum in living biomass, dead biomass and soil. In forests, living biomass mainly consists of below-ground parts (largely roots and associated organs) and above-ground parts (largely stems, branches, twigs and leaves) of trees. Clearly, to estimate C stocks and robustly assess the roles of forest ecosystems in regional and global C cycles, estimates of both above-ground biomass (AGB) and below ground biomass (BGB) are needed (Zianis 2008). Such estimates can be obtained using either destructive or non-destructive methods (Lu et al. 2005; Zianis 2008; Vieilledent et al. 2012). The former are most reliable, but clearly cannot be used to estimate C stocks at large geographical scales (Henry et al. 2011; Melson et al. 2011).
Non-destructive methods involves use of allometric equations to estimate both below- and above-ground biomass of trees using measured dimensional variables, such as stem diameter. They are more suitable for large-scale estimation of forest C stocks, and may be based on either single or several tree traits, e.g. diameter at breast height (DBH), height (H), crown size (Chave et al. 2005; Petersson and Ståhl 2006; Zianis 2008; Sawadogo et al. 2010; Kuyah et al. 2012a) and circumference (Lufafa et al. 2008; Hasen-Yusuf et al. 2013). Tree allometry depends on both genetic and environmental factors, such as soil, climate, disturbance regime, successional status and topographic conditions (Ketterings et al. 2001; Litton and Kauffman 2008). Consequently, theoretical models that only include a few ecological variables and empirical models that have been calibrated at particular sites are unlikely to yield accurate estimates of biomass at other sites (Vieilledent et al. 2012). Thus, a major current limitation is that very few published allometric equations cover conditions in West African savanna woodlands (Sawadogo et al. 2010; Henry et al. 2011).
Another current limitation is that more attention has generally been paid to estimation of AGB than BGB (e.g., Zianis 2008), although BGB accounts for substantial proportions of total biomass (Niklas and Enquist 2002), ranging from 10 to 90%, depending on vegetation type (Cairns et al. 1997; Mokany et al. 2006; Hairiah et al. 2010) and agro-ecological conditions (Grieu and Aussenac 1988). For instance, trees in the semi-arid savanna-woodlands of West Africa have deep rooting systems, hence the below-ground fraction may contain more than 50% of the woody biomass (Grieu and Aussenac 1988; Logbo et al. 2011). Thus, robust estimation of BGB is clearly essential for determining regional C balances and C allocation patterns. However, little is known about BGB of savanna-woodlands.
The aim of the study presented here was to address limitations outlined above by meeting the following goals. First, to determine BGB fractions of four key tree species in West African savanna-woodland by destructive sampling. Second, to construct accurate species-specific allometric equations for estimating BGB of those species. Third, to construct generic allometric equations and assess both their accuracy and the applicability of other generic equations for estimating the BGB of the studied species.
2 Material and methods
2.1 Study area
The study was conducted in Tiogo and Laba state-managed forests in Burkina Faso (Fig. 1), located between 11°40´N and 12°13´N, and 2°42´W and 2°50´W. The mean altitudes of the sites were 261 and 282 m above sea level, respectively. The study area has a unimodal rainy season which lasts from May to October. At Laba and Tiogo the mean annual rainfall was 917 ± 151 and 837 ± 151 mm, and there were 62 ± 16 and 61 ± 12 rainy days annually, respectively, during the period 1992–2014, while at both sites mean daily minimum and maximum temperatures are 16 °C and 32 °C in January (the coldest month) and 26 °C and 40 °C in April (the hottest month), respectively.
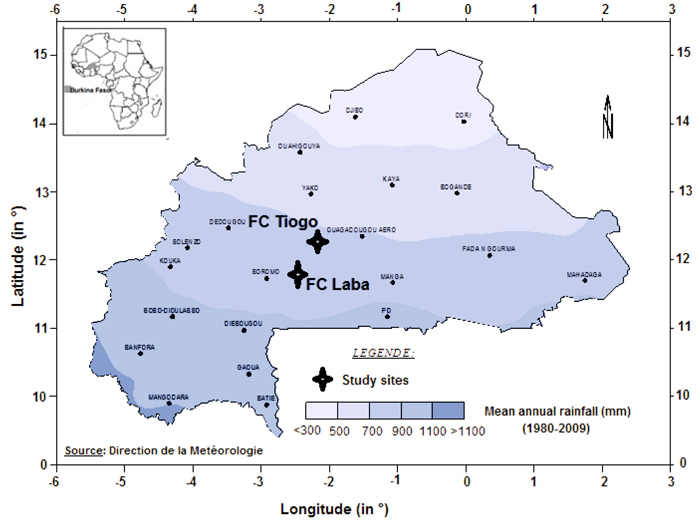
Fig. 1. Location of Laba and Tiogo forests in isohyet map of Burkina Faso.
The vegetation at both sites consists mainly of woodland and bushland savanna with a grass layer dominated by the annual grasses Andropogon pseudapricus Stapf and Loudetia togoensis (Pilg.) C.E. Hubb., together with perennial grasses such as Andropogon gayanus Kunth. The main forbs are Cochlospermum planchonii Hook. f. ex Planch., Borreria spp. and Wissadula amplissima (L.) R.E. Fr.. The main tree species in terms of basal area are Entada Africana Guill. & Perr., Lannea acida A. Rich., Anogeissus leiocarpa (DC.) Guill. & Perr., Vitellaria paradoxa C.F. Gaertn, Detarium microcarpum Guill. & Perr., Combretum micranthum G. Don and Acacia macrostachya Reich (Sawadogo et al. 2002).
The dominant soil type according to FAO soil classification is Lixisol (Driessen et al. 2001). However, the soil depth and texture differ between the study sites. Tiogo forest has silty-clay soils with deep profiles (> 100 cm), whereas Laba forest has shallow (< 50 cm) silty-sandy soils. In both forests, as in all managed savanna-woodlands in Burkina Faso and West Africa generally, current policies for sustainability focus on woody vegetation and entail regulation of grazing, setting early fires and selective tree cutting of 50% of the basal area over a 20-year rotation (Bellefontaine et al. 2000). However, these interventions often negatively affect the level of AGB (Sawadogo et al. 2002; Zida et al. 2008; Dayamba et al. 2011) and hence BGB.
2.2 Tree species
For this study, we selected four key tree species – (Anogeissus leiocarpa (DC.) Guill. & Perr., Detarium microcarpum Guill. & Perr., Piliostigma thonningii (Schumach.) Milne-Redh. and Vitellaria paradoxa C.F. Gaertn.) – which are present in similar habitats at both study sites. V. paradoxa is a protected species, A. leiocarpa and D. microcarpum are mainly used for timber and fuelwood, while P. thonningii is mostly used for household fuelwood and provision of non-wood products. These tree species were selected partly because they are among the most important for production of fuelwood and socio-economically valued non-wood products (fruits, leaves and bark) for therapeutic use, human or animal consumption and sale in local markets. Furthermore, all of these species are common in four major forest types of the savanna ecosystem (gallery forest, dense woodland, open woodland and fallow) (Savadogo et al. 2007) and regenerate well when exposed to disturbances, such as early fire, moderate grazing and selective cutting (Zida et al. 2008).
2.3 Data collection
Individual trees (100 in total) were sampled (Table 1) during the rainy season in June 2012 when their leaf area was maximal. The sampled trees included 30 (15 at each site) of each species (A. leiocarpa, D. microcarpum and P. thonningii) and 10 for V. paradoxa (protected species). Sampling was made so that plants from each of the three size classes based on stem circumference at breast height (C1.3) were represented: saplings (C1.3 < 10 cm) (18 trees), timber or fuelwood (C1.3 = 10–25 cm) (55 trees) and seed trees (C1.3 ˃ 25 cm) (28 trees) (Sawadogo 2009).
| Table 1. Descriptive statistics (mean ± standard deviation, minimum and maximum) of the studied tree species: circumference 0.2 m above ground level (C0.2), circumference 1.30 m above ground level (C1.3) and height (H). | ||||||||||
| C0.2 (cm) | C1.3 (cm) | H (cm) | ||||||||
| N | Mean ± Sd | Min. | Max. | Mean ± Sd | Min. | Max. | Mean ±vSd | Min. | Max. | |
| Anogeissus leiocarpa | 30 | 27.5±2.7 | 8 | 61 | 18.1±1.8 | 5 | 41 | 573±50 | 247 | 1110 |
| Detarium microcarpum | 30 | 37.6±3.5 | 12 | 86 | 25.7±3.1 | 7 | 75 | 455±30 | 195 | 800 |
| Piliostigma thonningii | 30 | 26.5±1.7 | 12 | 40 | 15.7±1.4 | 6 | 30 | 334±18 | 171 | 540 |
| Vitellaria paradoxa | 10 | 29.0±9.1 | 14 | 40 | 19.5±8.5 | 8 | 34 | 426±100 | 150 | 650 |
| All species | 100 | 31.9±1.6 | 8 | 86 | 21.6±1.4 | 5 | 75 | 456±19 | 150 | 1110 |
2.4 Estimation of above-ground biomass
The stem circumference at 0.2 m height above ground (C0.2) and C1.3 of all sampled trees were measured using a measuring tape, and their height (H) was measured using a clinometer. For trees with forks at heights < 1.3 m, we measured all the stems and computed C1.3 using the following formula:
![]()
where Ci1.3 is the circumference at breast height of stem i. The AGB of each tree was then estimated indirectly using specific allometric equations for A. leiocarpa, D. microcarpum and P. thonningii (Sawadogo et al. 2010) and ln (AGB) = –3.05 + 2.66 ln(DBH) (R2 = 0.99; SE = 0.11) for V. paradoxa (Koala et al. 2014, unpublished data).
2.5 Estimation of below-ground biomass
We used two destructive methods to estimate the BGB (stump + coarse roots) of each of the sampled trees, described and discussed in detail by Henry et al. (2011), Konopka et al. (2011) and Melson et al. (2011). When examining the non-protected species (A. leiocarpa, D. microcarpum and P. thonningii), all the coarse roots with diameter upper than 5 mm were completely uncovered, excavated, and traced outwards from the stump to ensure that no detected roots were wrongly assigned to a sampled tree. Threshold of 5 mm had no ecophysiological meaning yet it gives only size of roots to be traced easily and a relatively small underestimation for root mass.
In both cases, soil particles attached to the roots were cleaned using a brush and fresh mass of the sampled biomass was measured immediately in the field with a balance (precision 0.1 g). Then, we sampled 2 discs of root components per tree from both ends and mid-points of the roots for dry mass determination. The samples were stored in plastic bags and transported to the laboratory, where they were oven-dried at 105 °C for 48 hours to remove moisture. Finally, the fresh to oven-dry mass ratios were calculated and used to convert the total fresh mass of each biomass component recorded in the field into dry mass.
After estimating AGB and BGB as described above, we calculated the root:shoot ratio (RS) for each tree by simply dividing the AGB values by corresponding BGB values. Tukey’s test was used to test for significant differences in RS among the four species at the 95% probability level (p < 0.05).
2.6 Biomass model development
Statistical analysis was performed in XLSTAT software (version 14.3.07, Addinsoft, 2007). As in many previous studies (Konopka et al. 2011; Blujdea et al. 2012; Kuyah et al. 2012b), the power function was used for modeling relationships between the measured stem attributes and BGB:
![]()
where Y, a, b and x are the dependent variable, scaling coefficient, scaling exponent and explanatory variable, respectively. We considered the following explanatory variables: basal area at 0.2 m and 1.3 m height from the ground (respectively BA0.2 and BA1.3), height (H), BA0.2 × H and BA1.3 × H. In order to estimate model parameters a and b, we tested the following non-linear regression functions:
![]()
![]()
![]()
![]()
![]()
where a and b are the scaling coefficient and exponent estimated by non-linear regression analysis, and ԑ is the random error.
Next, the best models were selected as follows. First, we eliminated non-significant models (p > 0.05) and those with coefficients of determination (R2) < 0.5. We then selected those with maximal R2 values, with minimal standard error (SE), as the ‘best’ model for each species.
Finally, we assessed local effects on biomass allocation in the focal system by comparing equations developed in this study with previously published equations constructed for estimating BGB in dry tropical forest areas (Cairns et al. 1997; Mokany et al. 2006; Kuyah et al. 2012b). For comparison, the best general allometric equation obtained in this study and the published equations were applied to the same data. Then, bias in the landscape-level BGB was calculated for each model using the following formula:
![]()
Furthermore, pairwise Tukey’s test was applied to test if errors produced by each equation were significant when predicting BGB of the studied species.
3 Results
Generally, BGB was significantly related to stem parameters (BA and H) and all the tested equations were highly significant (p < 0.001) for all species (Table 2). The model parameters were also highly significant (p < 0.001) for all the selected models. The values of R2 ranged from 0.50 to 0.95, depending on the explanatory variables and species. Equations based on a single tree attribute predicted BGB accurately for all the species except P. thonningii, for which both circumference and H were required. Scaling exponents (b) of the models based on a single predictor ranged from 0.7 to 2.6 depending on the predictor and species. According to the calculated bias parameters, A. leiocarpa model provided the best fit to the empirical data.
| Table 2. The allometric equations for the below-ground biomass (BGB) (kg) of the focal species based on indicated explanatory variables: basal area at 0.2 m above ground level (BA0.2), basal area (m2) at 1.3 m above ground level (BA1.3) and height (H) (cm). SE = Standard error. Bolded rows represent parameters of best specific models. | ||||||||
| Variable | a | SEa | b | SEb | R2 | SE | p-value | |
| Anogeissus leiocarpa | BA0.2 | 150.6 | 69.4 | 0.82 | 0.08 | 0.82 | 0.40 | <0.0001 |
| BA0.2×H | 17.8 | 4.2 | 0.61 | 0.06 | 0.84 | 0.37 | <0.0001 | |
| BA1.3 | 225.4 | 125.7 | 0.77 | 0.09 | 0.78 | 0.44 | <0.0001 | |
| BA1.3×H | 25.9 | 7.9 | 0.58 | 0.06 | 0.81 | 0.41 | <0.0001 | |
| H | 0.1 | 0.03 | 1.87 | 0.24 | 0.72 | 0.49 | <0.0001 | |
| Detarium microcarpum | BA0.2 | 414.9 | 296.2 | 0.72 | 0.14 | 0.54 | 0.67 | <0.0001 |
| BA0.2×H | 75.9 | 30.7 | 0.52 | 0.10 | 0.54 | 0.68 | <0.0001 | |
| BA1.3 | 628.7 | 518.3 | 0.68 | 0.14 | 0.52 | 0.69 | <0.0001 | |
| BA1.3×H | 108.9 | 53.0 | 0.50 | 0.10 | 0.52 | 0.69 | <0.0001 | |
| Piliostigma thonningii | BA0.2 | 532.9 | 414.3 | 0.91 | 0.14 | 0.64 | 0.60 | <0.0001 |
| BA0.2×H | 94.1 | 46.7 | 0.74 | 0.11 | 0.66 | 0.58 | <0.0001 | |
| BA1.3 | 519.6 | 456.4 | 0.75 | 0.13 | 0.58 | 0.64 | <0.0001 | |
| BA1.3×H | 112.8 | 67.2 | 0.63 | 0.10 | 0.60 | 0.63 | <0.0001 | |
| Vitellaria paradoxa | BA0.2 | 38057.0 | 27231.4 | 1.72 | 0.14 | 0.95 | 0.33 | <0.0001 |
| BA0.2×H | 483.1 | 236.9 | 1.20 | 0.13 | 0.92 | 0.43 | <0.0001 | |
| BA1.3 | 5759.0 | 6001.4 | 1.15 | 0.17 | 0.85 | 0.58 | <0.0001 | |
| BA1.3×H | 385.6 | 230.8 | 0.91 | 0.12 | 0.87 | 0.53 | <0.0001 | |
| H | 0.1 | 0.2 | 2.62 | 0.81 | 0.57 | 0.99 | <0.0001 | |
| All species | BA0.2 | 912.2 | 462.3 | 1.01 | 0.09 | 0.59 | 0.82 | <0.0001 |
| BA0.2×H | 67.2 | 21.9 | 0.70 | 0.08 | 0.50 | 0.90 | <0.0001 | |
| BA1.3 | 1084.9 | 603.0 | 0.88 | 0.09 | 0.56 | 0.85 | <0.0001 | |
BA0.2 (Eq. 3) was the best predictors for BGB of V. paradoxa and D. microcarpum. It explained 72% of the variation in BGB of D. microcarpum (Fig. 2b), while it explained 95% of the variation in BGB of V. paradoxa, with 5% bias. Combining basal area and H (BA0.2 × H or BA1.3 × H) as a single predictor provided the best models for A. leiocarpa (R2 = 0.84, SE = 0.37) and P. thonningii (R2 = 0.66, SE = 0.58) (Table 2). The best general model for the four species, based on BA0.2 (Eq. 3), explained 95% of BGB of the four species, but was inevitably less accurate than the best species-specific models because it had large SE (0.82) (Fig. 2).
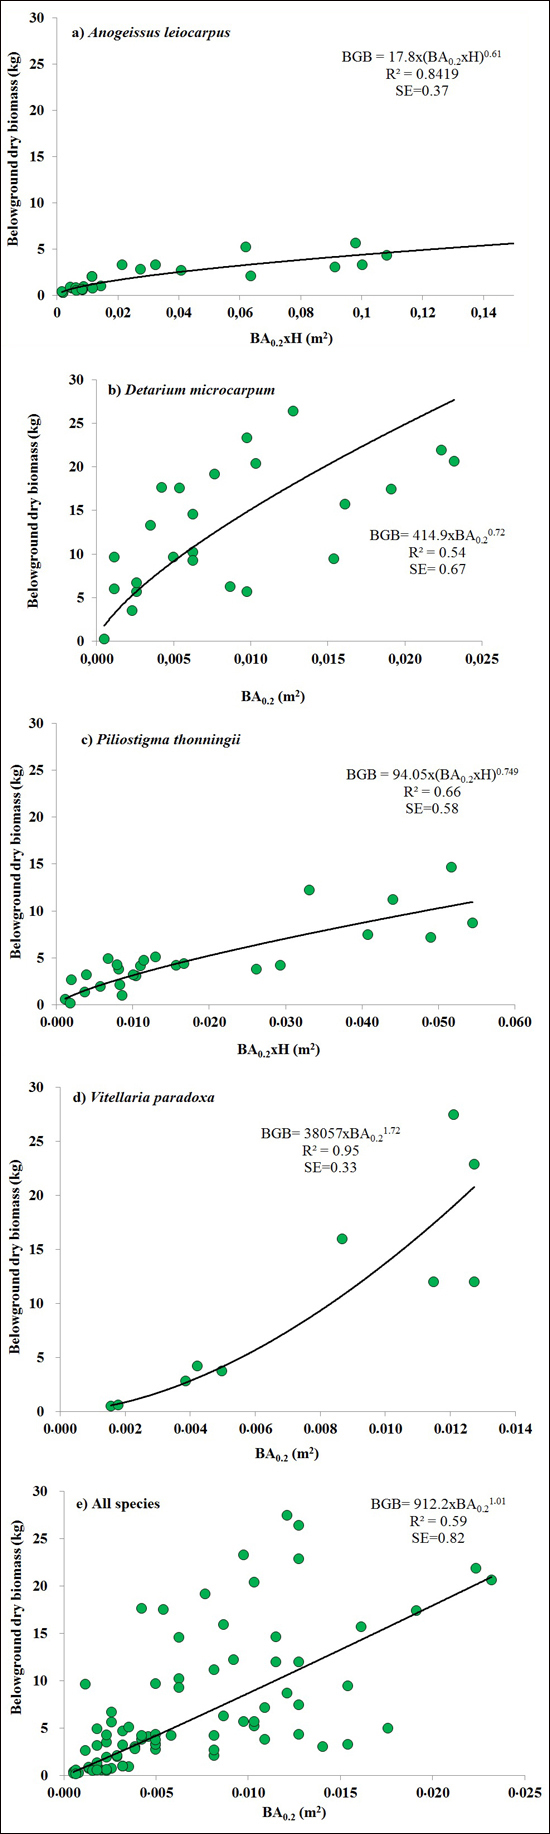
Fig. 2. The best equations for predicting belowground biomass (BGB) based on basal area at 0.2 m above ground level (BA0.2) and it combination with height (H) (BA0.2 × H) for: a) Anogeissus leiocarpa, (b) Detarium microcarpum, (c) Piliostigma thonningii, (d) Vitellaria paradoxa and (e) all species.
As shown in Table 3, the root: shoot ratio (RS) of the 100 excavated trees ranged from 0.1 to 3.4, and differed substantially among the study species (p < 0.001): V. paradoxa and A. leicarpa had much lower ratios (0.3 and 0.6, respectively) than D. microcarpum and P. thonningii (2.9 and 2.5, respectively).
| Table 3. Means and 95% confidence intervals (CI 95%) of below-ground biomass (BGB), above-ground biomass (AGB) and root:shoot ratio (RS) of the sampled tree species. | ||||||
| BGB (kg) | ABG (kg) | RS | ||||
| Mean | CI 95% | Mean | CI 95% | Mean | CI 95% | |
| Anogeissus leiocarpa | 3.0 a | 6.4–12.5 | 4.4 a | 32.2–41.1 | 0.6 a | 0.1–1.0 |
| Detarium microcarpum | 26.9 c | 17.3–36.6 | 7.4 a | 29.9–44.8 | 2.9 b | 2.5–3.4 |
| Piliostigma thonningii | 5.8 ab | 3.8–15.4 | 2.2 a | 35.1–39.5 | 2.5 b | 2.0–3.0 |
| Vitellaria paradoxa | 22.7 bc | 13.3–32.2 | 97.3 b | 60.7–134.0 | 0.3 a | 0.1–0.8 |
| Mean values with the same letters in the same column are not significantly different (p < 0.05) | ||||||
The selected published equations of Kuyah at al. (2012b) (BGB = 0.048 × DBH2.303), Mokany et al. (2006) (BGB = 0.27 × AGB) and Cairns et al. (1997) (BGB = –1.085 + 0.9256 × ln(ABG) underestimated BGB values of the four species, as shown by the data points for all of the individual trees in Fig. 3. The mean error ranged from –8% to –63%, depending on the equation and circumference class (Fig. 4e). When considering different species separately, the discrepancies between predicted and measured BGB were higher, and varied among both species and circumference classes (Fig. 4). The errors were larger and more negative for D. microcarpum and P. thonningii than for the other species.
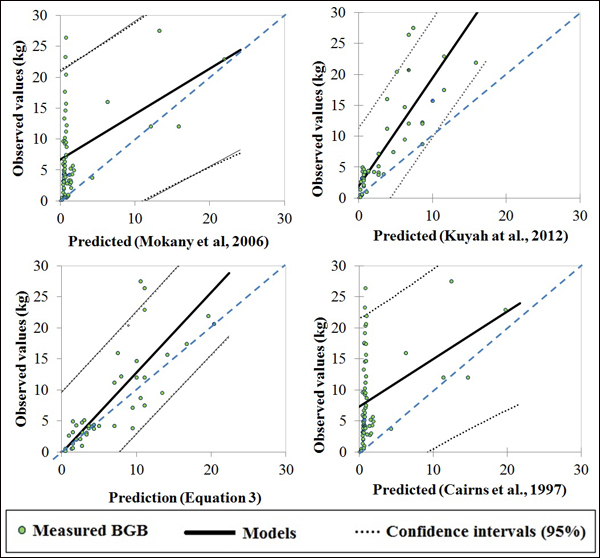
Fig. 3. Plots of measured and predicted values of published models and Eq. 3 of this study.
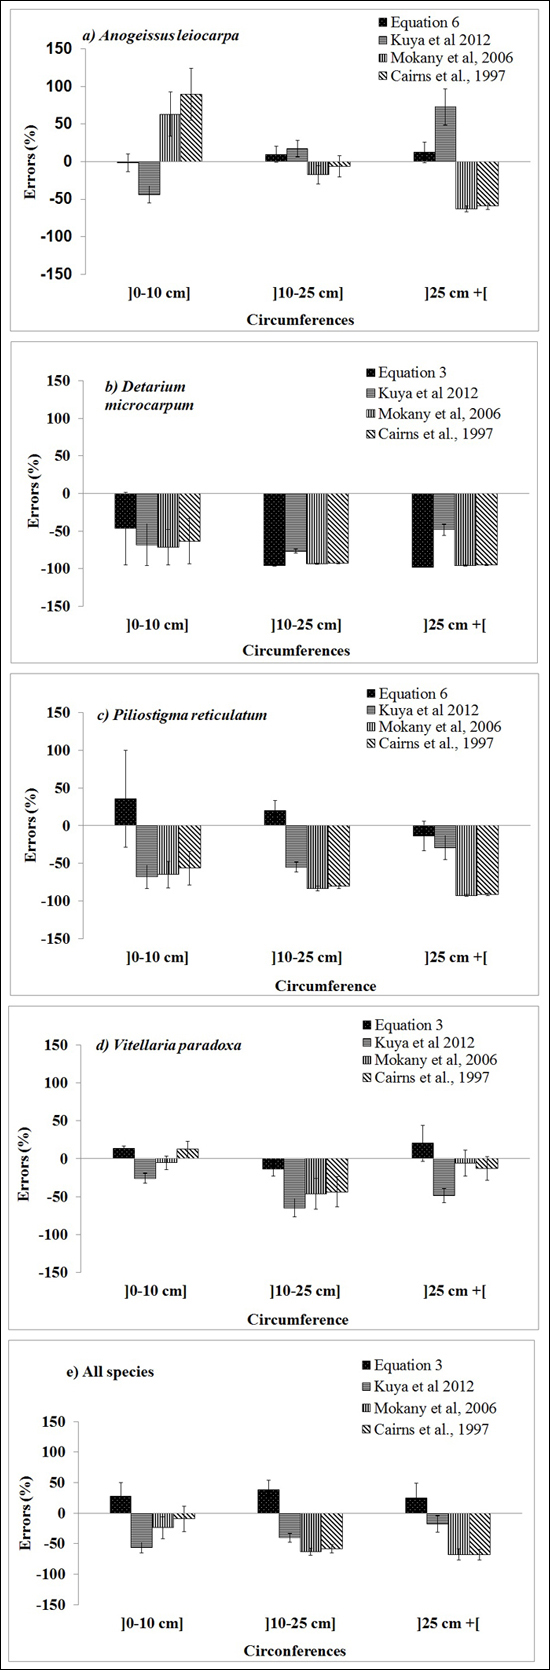
Fig. 4. Mean errors (%) for the best below-ground biomass equations for the three diameter classes of the four focal species obtained in this study (Table 3), and presented by Kuyah at al. (2012) (BGB = 0.048 × DBH2.303), Mokany et al. (2006) (BGB = 0.27 × AGB) and Cairns et al. (1997) (BGB = –1.085 + 0.9256 × ln(ABG)).
4 Discussion
Our results indicate that the power equation and predictors based on stem basal area (BA0.2 and BA1.3) and H are useful for predicting BGB of the four studied species in savanna-woodlands of Burkina Faso. The specific below-ground biomass equations we established for A. leiocarpa, D. microcarpum, P. thonningii and V. paradoxa were all highly significant (p < 0.001). However, they are likely to be most applicable at sites that closely resemble the study area (Jenkins et al. 2003).
The best models fitted in this study had R2 values between 0.50 and 0.95, with standard errors between 0.33 and 0.90. The model fits are comparable to those of Lufafa et al. (2009) who obtained R2 values between 0.66 and 0.83 for two other savanna woodland species (Guiera senegalensis J.F. Gmel. and Piliostigma reticulatum (DC.) Hochst). However, the model fits are poor in comparison to those of temperate species (Wang 2006; Peichl and Arain 2007; Konopka et al. 2011).
The scaling exponent of the power function (b), which can be interpreted in terms of the relationship between BGB and the stem parameters (Enquist et al. 1998), differed among models for individual species based on the same predictors. This could be due to differences among the species in either genetic characteristics or ecophysiological responses to the habitats (Wang 2006), and reduced the fit of the model for pooled data.
Many variables have proved useful for predicting BGB, such as DBH (Petersson and Ståhl 2006; Konopka et al. 2011; Blujdea et al. 2012), crown size (Lufafa et al. 2009; Kuyah et al. 2012b) and diameter at stem base (Wang 2006; Peichl and Arain 2007; Blujdea et al. 2012; ). In this study, we obtained good model fit using BA0.2, BA1.3 and H. A major advantage of these factors is that they are variable that are biologically meaningful trait since they expressed well water-conducting area scales within a plant for optimum conductivity (Enquist and Niklas 2002). However, it would be more convenient to deduct it directly from the circumference instead of diameter of savanna tree species, as they rarely have cylindrical trunks. Also circumferences are commonly measured in forest inventories and plant community surveys. Stem basal area at 0.2 m height (BA0.2) proved to be a good predictor of BGB for all four species, and for the general model. In forests managed for fuelwood production, present in many parts of Burkina Faso and other West African countries, models based on BA0.2 could be widely applied because it can be measured even when trees have already been cut. Height (H) alone proved to be a poor predictor of BGB, in accordance with previous findings (Jenkins et al. 2003; Peichl and Arain 2007), but in combination with circumference it improved the fit of models for two species (A. leiocarpa and P. thonningii). Similar improvements have been obtained by combining H with DBH for AGB predictions (Cienciala et al. 2006; Kaonga and Bayliss-Smith 2009). However, the importance of H for BGB prediction appears to depend on the species, which must be taken into account in data collection. This may explain why Hofstad (2005) found that it was unnecessary to measure H for biomass estimation in southeast Africa.
The range of RS across the studied species (0.1–3.4) is similar to the range reported for shrublands (0.335–4.250) by Mokany et al. (2006), but substantially wider than the range for species harvested at moister sites than our study area (0.12–1.11) reported by Kuyah et al. (2012b). This is hardly surprising, as numerous factors influence RS, including (among others) climate, vegetation type (Cairns et al. 1997) and regeneration strategy of the species (Mokany et al. 2006). Notably, the ability of D. microcarpum and P. thonningii to regenerate via suckers may at least partially explain their high RS ratios.
According to our results, previous BGB equations (Cairns et al. 1997; Mokany et al. 2006; Kuyah et al. 2012b) underestimate the biomass of savanna woodland. This suggests that root:shoot ratios of species are sensitive to environmental conditions, and models constructed for specific climatic and vegetation conditions are needed to estimate accurately BGB in West African savanna-woodlands.
Finally, we used more samples per species (30 trees per species) than Konopka et al. (2011) and Wang (2006) (5–25), but fewer than Cairns et al. (1997) and Kuyah et al. (2012b). However, regardless of such comparisons, clearly the equations developed in this study (and predictions based upon them) could be improved by sampling more trees per species in future surveys.
5 Conclusion
Species-specific and general allometric equations for BGB were developed for four common woody species of savanna-woodlands (Anogeissus leiocarpa, Detarium microcarpum, Piliostigma thonningii and Vitellaria paradoxa) based on BA0.2, BA1.3, H (singly or in combination). The species-specific models provided good fits to the empirical data, and better fits than the general equations, highlighting the importance of species-specific equations for accurate biomass estimates. Three previously published generic allometric equations all underestimated BGB in comparison to field measurements. The proposed equations can be used for estimating BGB and C stocks in managed and selectively cut savanna-woodlands in West Africa. The findings should also be useful for quantifying the roles of savanna-woodland in mitigating climate change.
Acknowledgements
We would like to acknowledge funding from ILRI/BMZ through the financial support of the Federal Ministry for Economic Cooperation and Development, Germany and CILSS-Carbon project. Support was also provided by Robert S. McNamara Fellowships program of the World Bank and CGIAR Research Program on Drylands (CRP 1.1). We thank Meda Modeste and workers from Laba and Tiogo for their invaluable assistance in carrying out roots sampling. Anonymous reviewers are highly appreciated for their constructive comments.
References
Addinsoft (2007). Xlstat. https://www.xlstat.com.
Baskerville G.L. (1972). Use of logarithmic regression in the estimation of plant biomass. Canadian Journal of Forestry 2(1): 49–53. https://doi.org/10.1139/x72-009.
Basuki T.M., van Laake P.E., Skidmore A.K., Hussin Y.A. (2009). Allometric equations for estimating the above-ground biomass in tropical lowland Dipterocarp forests. Forest Ecology and Management 257(8): 1684–1694. https://doi.org/10.1016/j.foreco.2009.01.027.
Bationo B.A., Ouedraogo S.J., Alexandre D.-Y., Guinko S. (2001). Statut hydrique de quatre espèces ligneuses soudaniennes dans la forêt de Nazinon, Burkina Faso Babou. Sécheresse 12: 87– 94.
Bellefontaine R., Gaston A., Petrucci Y. (2000). Management of natural forests of dry tropical zones. Food and Agriculture Organization of the United Nations (FAO), Rome.
Blujdea V.N.B., Pilli R., Dutca I., Ciuvat L., Abrudan I.V. (2012). Allometric biomass equations for young broadleaved trees in plantations in Romania. Forest Ecology and Management 264: 172–184. https://doi.org/10.1016/j.foreco.2011.09.042.
Brown S. (2002). Measuring carbon in forests: current status and future challenges. Environmental Pollution 116(3): 363–372. https://doi.org/10.1016/S0269-7491(01)00212-3.
Cairns M.A., Brown S., Helmer E.H., Baumgardner G.A. (1997). Root biomass allocation in the world’s upland forests. Oecologia 111(1): 1–11. https://doi.org/10.1007/s004420050201.
Chave J., Andalo C., Brown S., Cairns M.A., Chambers J.Q., Eamus D., Fölster H., Fromard F., Higuchi N., Kira T., Lescure J.-P., Nelson B.W., Ogawa H., Puig H., Riéra B., Yamakura T. (2005). Tree allometry and improved estimation of carbon stocks and balance in tropical forests. Oecologia 145(1): 87–99. https://doi.org/10.1007/s00442-005-0100-x.
Ciais P., Bombelli A., Williams M., Piao S.L., Chave J., Ryan C.M., Henry M., Brender P., Valentini R. (2011). The carbon balance of Africa: synthesis of recent research studies. Philosophical Transactions of the Royal Society 369(1943): 2038–2057. https://doi.org/10.1098/rsta.2010.0328.
Cienciala E., Černý M., Tatarinov F., Apltauer J., Exnerová Z. (2006). Biomass functions applicable to Scots pine. Trees 20(4): 483–495. https://doi.org/10.1007/s00468-006-0064-4.
Dayamba S.D., Savadogo P., Sawadogo L., Zida D., Tiveau D., Oden P.C. (2011). Dominant species’ resprout biomass dynamics after cutting in the sudanian savanna-woodlands of West Africa: long term effects of annual early fire and grazing. Annals of Forest Science 68(3): 555–564. https://doi.org/10.1007/s13595-011-0055-5.
Driessen P., Deckers J., Spaargaren O. (2001). Lecture notes on the major soils of the world. FAO World Soil Resources Reports-94. Food and agriculture organization of the United Nations, Rome.
Enquist B.J., Brown J.H., West G.B. (1998). Allometric scaling of plant energetics and population density. Nature 395: 163–165. https://doi.org/10.1038/25977.
Enquist B.J., Niklas K.J. (2002) Global allocation rules for patterns of biomass partitioning in seed plants. Science 295(5559): 1517–1520. https://doi.org/10.1126/science.1066360.
Fearnside P.M. (2000). Global warming and tropical land use change: greenhouse gas emissions from biomass burning, decomposition and soils in forest conversion, shifting cultivation and secondary vegetation. Climatic Change 46(1): 115–158. https://doi.org/10.1023/A:1005569915357.
Fehrmann L., Kleinn C. (2006). General considerations about the use of allometric equations for biomass estimation on the example of Norway spruce in central Europe. Forest Ecology and Management 236(2–3): 412–421. https://doi.org/10.1016/j.foreco.2006.09.026.
Grieu P., Aussenac G. (1988). Croissance et développement du système racinaire de semis de trois espèces de conifères: Pseudotsuga menziesii, Pseudotsuga macrocarpa et Cedrus atlantica. Annales des Sciences Forestières 45(2): 117–124. https://doi.org/10.1051/forest:19880202.
Hairiah K., Dewi S., Agus F., Velarde S., Ekadinata A., Rahayu S., van Noordwijk M. (2010). Measuring carbon stocks across land use systems. World agroforestry centre, SEA Regional Office, Bogor, Indonesia. 155 p.
Hasen-Yusuf M., Treydte A.C., Abule E., Sauerborn J. (2013). Predicting aboveground biomass of woody encroacher species in semi-arid rangelands, Ethiopia. Journal of Arid Environments 96: 64–72. https://doi.org/10.1016/j.jaridenv.2013.04.007.
Henry M., Picard N., Trotta C., Manlay R.J., Valentini R., Bernoux M., Saint-andré L. (2011). Estimating tree biomass of sub-Saharan arican forests : a review of available allometric equations. Silva Fennica 45(3B): 477–569. https://doi.org/10.14214/sf.38.
Hofstad O. (2005). Review of biomass and volume functions for individual trees and shrubs in southeast Africa. Journal of Tropical Forest Science 17(1): 151–162.
Houghton R.A. (1999). The annual net flux of carbon to the atmosphere from changes in land use 1850–1990. Tellus 51(B): 298–313.
Houghton R.A. (2004). Tropical deforestation as a source of greenhouse gas emissions. In: Moutinho P., Schwartzman S. (eds.). Tropical deforestation and climate change. Amazon Institute for Environmental Research, Brazil. p. 13–21.
Jenkins J.C., Chojnacky D.C., Heath L.S., Birdsey R.A. (2003). Comprehensive database of diameter-based biomass regressions for North American tree species. General Technical Report NE-319. USDA Forest Service, Northeastern Research Station, PA, U.S. 45 p.
Kaonga M.L., Bayliss-Smith T.P. (2009). Allometric models for estimation of aboveground carbon stocks in improved fallows in eastern Zambia. Agroforestry System 78(3): 217–232. https://doi.org/10.1007/s10457-009-9253-7.
Ketterings Q.M., Coe R., van Noordwijk M., Ambagau’ Y., Palm C.A. (2001) Reducing uncertainty in the use of allometric biomass equations for predicting above-ground tree biomass in mixed secondary forests. Forest Ecology and Management 146(1–3): 199–209. https://doi.org/10.1016/S0378-1127(00)00460-6.
Koala J. (2009). Physiological responses of some woody species to North-South climate gradient of Burkina Faso. Master thesis, University of Ouagadougou.
Konopka B., Pajtik J., Seben V., Lukac M. (2011). Belowground biomass functions and expansion factors in high elevation Norway spruce. Forestry 84(1): 41–48. https://doi.org/10.1093/forestry/cpq042.
Kumar B.M., Nair P.K.R. (2011). Carbon sequestration potential of agroforestry systems: opportunities and challenges. Advances in Agroforestry 8, Springer science+Business Media B.V. https://doi.org/10.1007/978-94-007-1630-8.
Kuyah S., Dietz J., Muthuri C., Jamnadass R., Mwangi P. (2012a). Allometric equations for estimating biomass in agricultural landscapes: I. Aboveground biomass. Agriculture, Ecosystems and Environment 158: 216–224. https://doi.org/10.1016/j.agee.2012.05.011.
Kuyah S., Dietz J., Muthuri C., Jamnadass R., Mwangi P., Coe R., Neufeldt H. (2012b). Allometric equations for estimating biomass in agricultural landscapes: II. Belowground biomass. Agriculture, Ecosystems and Environment 158: 225–234. https://doi.org/10.1016/j.agee.2012.05.010.
Ky-dembele C., Tigabu M., Bayala J., Savadogo P., Boussim I.J., Odén P.C. (2010). Clonal propagation of Detarium microcarpum from root cuttings. Silva Fennica 44(5): 775–786. https://doi.org/10.14214/sf.452.
Litton C.M., Kauffman J.B. (2008). Allometric models for predicting aboveground biomass in two widespread woody plants in Hawaii. Biotropica 40(3): 313–320. https://doi.org/10.1111/j.1744-7429.2007.00383.x.
Logbo J., Bada F., Gnancadja L.S., Ameglio T., Akpo E. (2011). Estimation de la biomasse racinaire en fonction de la teneur en eau du sol chez les espèces sahéliennes: cas d ’ Acacia tortilis (Forsk.) Hayne ssp. raddiana (Savi) Brenand et de Balanites aegyptiaca (L) Del, en station et en milieu naturel. International Journal of Biological and Chimical Sciences 5(1): 94–110. https://doi.org/10.4314/ijbcs.v5i1.68090.
Lu D., Batistella M., Moran E. (2005). Satellite estimation of aboveground biomass and impacts of forest stand structure. Photogrammetric Engineering & Remote Sensing. 71(8): 967–974. https://doi.org/10.14358/PERS.71.8.967.
Lufafa A., Diédhiou I., Samba S.A.N., Séné M., Khouma M., Kizito F., Dick R.P., Dossa E., Noller J.S. (2008). Carbon stocks and patterns in native shrub communities of Senegal’s Peanut Basin. Geoderma 146(1–2): 75–82. https://doi.org/10.1016/j.geoderma.2008.05.024.
Lufafa A., Diédhiou I., Ndiaye N.A.S., Séné M., Kizito F., Dick R.P., Noller J.S. (2009). Allometric relationships and peak-season community biomass stocks of native shrubs in Senegal’s Peanut Basin. Journal of Arid Environments 73(3): 260–266. https://doi.org/10.1016/j.jaridenv.2008.09.020.
Melson S.L., Harmon M.E., Fried J.S., Domingo J.B. (2011). Estimates of live-tree carbon stores in the Pacific Northwest are sensitive to model selection. Carbon Balance and Management 6(2): 1–16. https://doi.org/10.1186/1750-0680-6-2.
Mokany K., Raison R.J., Prokushkin A.S. (2006). Critical analysis of root: shoot ratios in terrestrial biomes. Global Change Biology 12(1): 84–96. https://doi.org/10.1111/j.1365-2486.2005.001043.x.
Niklas K.J., Enquist B.J. (2002) Canonical rules for plant organ biomass partitioning and annual allocation. American Journal of Botany 89(5): 812–819. https://doi.org/10.3732/ajb.89.5.812.
Peichl M., Arain M.A. (2007). Allometry and partitioning of above- and belowground tree biomass in an age-sequence of white pine forests. Forest Ecology and Management 253(1–3): 68–80. https://doi.org/10.1016/j.foreco.2007.07.003.
Petersson H., Ståhl G. (2006). Functions for below-ground biomass of Pinus sylvestris, Picea abies, Betula pendula and Betula pubescens in Sweden. Scandinavian Journal of Forest Research 21(S7): 84–93. https://doi.org/10.1080/14004080500486864.
Picard N., Henry M. (2012). Manual for building tree volume and biomass allometric equations. CIRAD et FAO, Montpellier.
Savadogo P., Tigabu M., Sawadogo L., Odén P.C. (2007). Woody species composition, structure and diversity of vegetation patches of a Sudanian savanna in Burkina Faso. Bois et Forêts des Tropiques 294: 5–20.
Sawadogo L. (2009). Influence of anthropogenic factors on state forest (Laba and Tiogo) vegetation dynamics in the Sudanian region of Burkina Faso. Doctorate thesis, University of Ouagadougou.
Sawadogo L., Nygård R., Pallo F. (2002). Effects of livestock and prescribed fire on coppice growth after selective cutting of Sudanian savannah in Burkina Faso. Annals of Forest Science 59(2): 185–195. https://doi.org/10.1051/forest:2002005.
Sawadogo L., Savadogo P., Tiveau D., Dayamba S.D., Zida D., Nouvellet Y., Oden P.C., Guinko S. (2010). Allométrique prediction of above-ground biomass of eleven woody tree species in the Sudanian savanna-woodland of West Africa. Journal of Forest Research 21(4): 475–481. https://doi.org/10.1007/s11676-010-0101-4.
Vieilledent G., VAudry R., Andriamanohisoa S., Rakotonarivo O.S., Randrianasolo H.Z., Razafindrabe H.N., Rakotoarivony C.B., Ebeling J., Rasamoelina M. (2012). A universal approach to estimate biomass and carbon stock in tropical forests using generic allometric models. Ecological Applications 22(2): 572–583. https://doi.org/10.1890/11-0039.1.
Wang C. (2006). Biomass allometric equations for 10 co-occurring tree species in Chinese temperate forests. Forest Ecology and Management 222(1–3): 9–16. https://doi.org/10.1016/j.foreco.2005.10.074.
Zianis D. (2008). Predicting mean aboveground forest biomass and its associated variance. Forest Ecology and Management 256(6): 1400–1407. https://doi.org/10.1016/j.foreco.2008.07.002.
Zida D., Tigabu M., Sawadogo L., Tiveau D., Oden P.C. (2008). Long-term effects of prescribed early fire , grazing and selective tree cutting on seedling populations in the Sudanian savanna of Burkina Faso. African Journal of Ecology 47(1): 97–108. https://doi.org/10.1111/j.1365-2028.2008.01011.x.
Total of 52 references.
