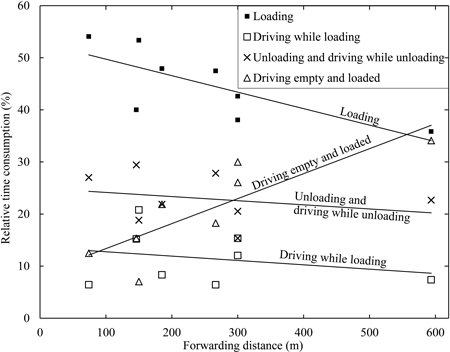
Fig. 1. The relative distribution of the forwarder’s productive machine (PM) time after fully mechanized cut-to-length (CTL) thinning operations versus forwarding distance (single way). Relationship lines are derived by regression analysis of data from Kellogg and Bettinger (1994); McNeel and Rutherford (1994); Hunt (1995); Sambo (1999); Bulley (1999); Gullberg (1995), motor-manual CTL thinning and Bruunett Mini 687F; Meek and Simard (2000), Valmet 646; Poikela and Alanne (2002), both late thinning and final felling. For the first five references, forwarding distances were calculated as the mean of driving empty and driving loaded distances.
| Table 1. Data on log concentration and the number of assortments in studies of mechanized CTL, which have reported total and forwarded log concentration as well as the number assortments at harvesting site and in loads. View in new window/tab. |
| Table 2. Treatments included in the study (i.e. factor combinations) and their resulting levels of forwarded log concentration and distances driven between the first and the last loaded pile in a load. Each treatment was repeated three times, resulting in 24 observed loads in total. | |||
| Factors | Forwarded log concentration (m3ob (100 m)–1) | Distance driven between the first and the last loaded pile in a load (m) | |
| Total log concentration (m3ob (100 m)–1) | Number of assortments in a load | ||
| 6.4 | 1 | 1.3 | 625 |
| 3 | 3.8 | 209 | |
| 5 | 6.4 | 125 | |
| 19.2 | 1 | 3.8 | 209 |
| 2 | 7.7 | 104 | |
| 3 | 11.5 | 70 | |
| 32.0 | 1 | 6.4 | 125 |
| 3 | 19.2 | 42 | |
| m3ob (100 m)–1 = solid m3 over bark per 100 m of the strip-road | |||
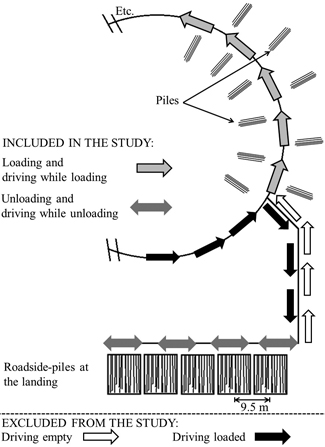
Fig. 2. The standardized circular test path defined by an imaginary log distribution. Each pile and roadside-pile contained only one of the five assortments.
| Table 3. Levels of significance (p-values) and level of explained variance (R2 adjusted values) obtained from the analysis of variance (ANOVA) of the main effects on the work elements’ time consumption and on the loading and unloading components. α is the number of assortments in a load, β is total log concentration on the strip-road and (αβ) is the fixed interaction effect. | |||||
| Dependent variable | p-value | R2 (adj) (%) | Number of observations (n) | ||
| α | β | (αβ) | |||
| Time consumption for work elements (PMmin (m3ob)–1) | |||||
| Work elements pooled | 0.006 | <0.001 | <0.001 | 89.8 | 18 |
| Loading | <0.001 | 0.393 | 0.985 | 63.5 | 18 |
| Driving while loading | <0.001 | <0.001 | <0.001 | 99.8 | 18 |
| Unloading | <0.001 | 0.629 | 0.596 | 81.9 | 18 |
| Driving while unloading | <0.001 | 0.538 | 0.538 | 88.6 | 18 |
| Loading components | |||||
| Time consumption for a loading stop (PMmin) | <0.001 | <0.001 | <0.001 | 67.5 | 378 |
| Time consumption for distance driven between the first and the last loaded pile in a load (PMmin m–1) | 0.182 | 0.132 | 0.074 | 32.9 | 18 |
| Time consumption for a loading crane cycle (PMmin) | <0.001 | 0.076 | 0.721 | 11.5 | 526 |
| Number of loading stops per load | <0.001 | <0.001 | <0.001 | 96.9 | 18 |
| Number of loaded piles per stop | <0.001 | <0.001 | <0.001 | 69.2 | 378 |
| Number of crane cycles per loading stop | <0.001 | <0.001 | <0.001 | 73.0 | 378 |
| Number of loaded piles per crane cycle | 0.054 | <0.001 | 0.028 | 6.9 | 526 |
| Unloading components | |||||
| Time consumption for an unloading stop (PMmin) | 0.016 | 0.917 | 0.878 | 5.0 | 52 |
| Time consumption for an unloading crane cycle (PMmin) | <0.001 | 0.767 | 0.470 | 15.1 | 200 |
| Number of unloading stops per load | <0.001 | 0.344 | 0.344 | 94.8 | 18 |
| Number of unloading crane cycles per load | <0.001 | 0.926 | 0.168 | 85.3 | 18 |
| Number of unloading crane cycles per stop | <0.001 | 0.659 | 0.735 | 71.6 | 52 |
| Significant values (p < 0.05) in bold. | |||||
| Table 4. Time consumption (mean and standard deviation (SD), PMmin (m3ob)–1) for work elements by total log concentration and the number of assortments in a load. | |||||||||
| Work element | Total log concentration (m3ob (100 m)–1) | Number of assortments in a load | |||||||
| Balanced two-way ANOVA | Supplements for one-way ANOVA | ||||||||
| 1 | 3 | 2 | 5 | ||||||
| Mean | SD | Mean | SD | Mean | SD | Mean | SD | ||
| Work elements pooled | 6.4 | 3.19A,a | 0.17 | 2.90A,b | 0.02 | 3.60c | 0.09 | ||
| 19.2 | 1.97BC,a | 0.06 | 2.38B,a | 0.33 | 1.95a | 0.13 | |||
| 32.0 | 1.69C | 0.11 | 2.39B | 0.16 | |||||
| Loading | No effect | 0.94a | 0.08 | 1.13b | 0.06 | 1.04ab | 0.01 | 1.40c | 0.10 |
| Driving while loading | 6.4 | 1.86A,a | 0.05 | 0.72B,b | 0.02 | 0.46c | 0.03 | ||
| 19.2 | 0.72B,a | 0.01 | 0.26D,b | 0.02 | 0.36c | 0.01 | |||
| 32.0 | 0.41C | 0.03 | 0.13E | 0.01 | |||||
| Unloading | No effect | 0.34a | 0.03 | 0.89b | 0.17 | 0.47a | 0.07 | 1.43c | 0.20 |
| Driving while unloading | No effect | 0a | 0 | 0.16b | 0.04 | 0.07ab | 0.05 | 0.31c | 0.11 |
| Different superscript uppercase letters within work elements pooled and driving while loading indicate significant differences (p < 0.05) between the six combinations of total log concentration and 1 and 3 assortments (Two-way ANOVA with Tukey test). When there was no effect from total log concentration (see Table 3), data within 1 and 3 assortments were pooled (i.e. means based on 9 loads instead of 3). Different superscript lowercase letters within rows indicate significant differences (p < 0.05) (One-way ANOVA with Tukey test). | |||||||||
| Table 5. Observations (mean and SD) for loading components by total log concentration and the number of assortments in a load. View in new window/tab. |
| Table 6. Comparisons at equal forwarded log concentrations: the main effect of number of assortments in a load α and the covariate forwarded log concentration on the strip-road γ (m3ob (100 m)–1). View in new window/tab. |
| Table 7. Observations (mean and SD) for unloading components by the number of assortments in a load. View in new window/tab. |
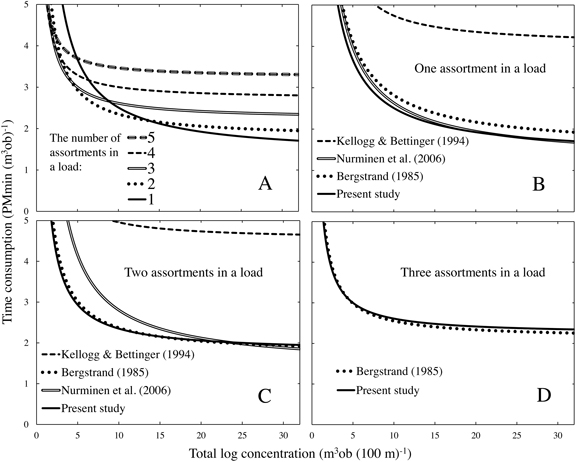
Fig. 3. Panel A: total time consumption in this study for the work elements loading, driving while loading, unloading and driving while unloading. Panels B–D: the total time consumption in this study compared with published studies for 1, 2 and 3 assortment loads. Driving while loading velocity 38.5 m min–1 was used in models by Bergstrand (1985) and Nurminen et al. (2006). The model for 2 saw log assortments was taken from Nurminen et al. (2006). The load-size 8 m3ob was used in the model created by Kellogg and Bettinger (1994). The pile-size 0.26 m3ob and the model for a large-sized forwarder were taken from Bergstrand (1985), with the proportion of difficult piles set as null. In each panel (A–D), the total number of assortments at a harvesting site is five.
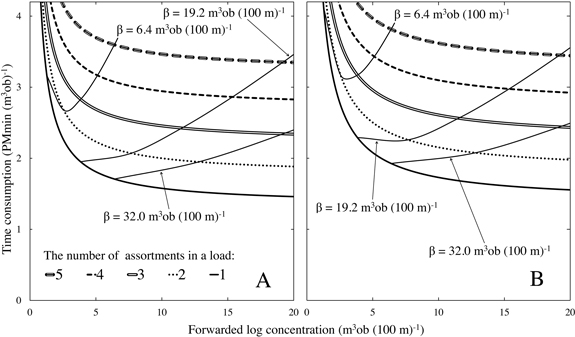
Fig. 4. Total time consumption for loading, driving while loading, unloading and driving while unloading as a function of forwarded log concentration m3ob (100 m)–1 and dependent on the number of assortments in a load (i.e. load type). Additional curves (β) indicate the total time consumption as functions of total log concentrations applied in this study. Data in panel A is based directly on the models presented in the result section. In panel B, the time consumption for driving while loading is increased by 50% to simulate 33.3% slower mean velocity. β curves are based on the assumption that five equally large assortments constitute the total log concentration. Increasing number of equally large assortments at a harvesting site would move β curves to the left, while decreasing their number would have the opposite effect.