Antonio Villasante  ,
Cristina Fernandez
,
Cristina Fernandez
Measurement errors in the use of smartphones as low-cost forestry hypsometers
Villasante A., Fernandez C. (2014). Measurement errors in the use of smartphones as low-cost forestry hypsometers. Silva Fennica vol. 48 no. 5 article id 1114. https://doi.org/10.14214/sf.1114
Highlights
- We analysed two smartphones (HTC Desire and Samsung Galaxy Note) to determine the errors in the height measurements
- The calibration included with the Android applications is insufficient
- After appropriate calibration, the smartphone errors are similar to other forest hypsometers (Blume Leiss and Vertex).
Abstract
Various applications currently available for Android allow the estimation of tree heights by using the 3D accelerometer on smartphones. Some make the estimation using the image on the screen, while in others, by pointing with the edges of the terminal. The present study establishes the measurement errors obtained with HTC Desire and Samsung Galaxy Note compared to those from Blume Leiss and Vertex IV. Six series of 12 measurements each were made with each hypsometer (for heights of 6 m, 8 m, 10 m and 12 m). A Kruskall Wallis test is applied to the relative errors to determine whether there are significant differences between the devices. The results indicate that the errors of the uncalibrated smartphones significantly exceed those of traditional forestry apparatus. However, calibration is a very easy procedure that can be done by means of a linear regression line between real angles (obtained with a Digital Angle Finder or with a series of measurements taken independently of the experiment), and the angles of the accelerometer. With this adjustment, the smartphones achieve adequate quality levels although the bias was not totally eliminated. The relative errors when pointing with the edges of the terminal show no significant differences compared to Blume Leiss. Applications that use the screen image give better results (no significant differences were detected with Vertex). There is currently no application that offers calibration of the linear regression slope, which is an essential requirement for ensuring the accuracy of height measurements obtained with smartphones.
Keywords
forest inventory;
calibration;
accelerometers;
forestry tools;
relative error
-
Villasante,
Agroforestry Departament, Universitat de Lleida, Av. Rovira Roure 177, 25198 Lleida, Spain
 http://orcid.org/0000-0002-7549-7424
E-mail
avillasante@eagrof.udl.cat
http://orcid.org/0000-0002-7549-7424
E-mail
avillasante@eagrof.udl.cat
- Fernandez, Agroforestry Departament, Universitat de Lleida, Av. Rovira Roure 177, 25198 Lleida, Spain E-mail cfernandez@eagrof.udl.cat
Received 18 February 2014 Accepted 31 October 2014 Published 4 December 2014
Views 82594
Available at https://doi.org/10.14214/sf.1114 | Download PDF

1 Introduction
The main variables provided by forest inventories are diameter at breast height and height. These data are used both for National Forest Inventories and in research projects into ecology and forest management in order to obtain volumes, size of the structure and amount of biomass (Kitahara et al. 2010).
Recently a series of smartphone applications have appeared on the market which enable the measurement of tree heights. These measurements are based on the data provided by the 3D accelerometer, which indicates the inclination of the device with regard to three axes. The present work follows the nomenclature used in Lee and Cho (2011), with three orthogonal axes that intersect in the centre of the device, parallel to the shorter edge of the screen (axis X), to the longer edge of the screen (axis Y), and perpendicular to the screen (axis Z).
There are two kinds of applications that use the smartphone as a hypsometer. One kind uses the image projected on the screen by the camera lens. These applications calculate the height based on rotations around the Y axis if the screen is placed in landscape format, or around the X axis if placed in portrait mode. This is the case of Smart Tools in its Height mode (Smart Tools co. 2012) and Measure Height (Deskis OU 2012). The other kind is aimed at the tree using the lines on the smartphone case, and measures the rotations around the Z axis. Smart Tools in Slope mode (Smart Tools co. 2012) and aHypsometer Lite (Taakkumn 2012) are applications of this type.
A different type of estimation of tree heights with smartphones can be made from images taken with a camera and subsequently processed to correct the obliquity (Zhang and Huang 2009; Han 2013).
There are very few studies on the accuracy of the tree height data obtained with smartphones. Itoh et al. (2010) analysed the accuracy of the iPhone by comparing the heights obtained with TruPulse 200 with the heights obtained with a laser telemeter. In this case the application used is based on the rotation of the Z axis when aiming with the upper edge of the iPhone.
To establish the quality of the measurements in forest inventories, the most commonly used criteria are those of the Forest Inventory and Analysis program (FIA) of the USDA Forest Service (Pollard et al. 2006), which contains a list of maximum permitted errors for the different tree (total height, diameter at breast height, crown diameter, etc.) and forest stand variables. These quality criteria for forest measurements have been used in various studies (Roesch 2002; Pollard et al. 2006; Kitahara et al. 2009; Kitahara et al. 2010). There are other quality criteria used in national inventories, but their application is limited to a more localised scope.
Given the current proliferation in the use of high-performance smartphones, it is well worth assessing their potential as tools for forest measurement. The aim of the present study is to establish the accuracy of smartphones as low-cost hypsometers in the measurement of tree heights at previously measured distances, in comparison with two of the most widely-used tools in the forestry sector, Blume-Leiss and Vertex.
2 Material and methods
2.1 Hypsometers used
The reference forestry hypsometers were a Blume-Leiss BL-8 and a Vertex IV (Haglof). In both cases, as with the measurements taken with the smartphones, the measurements were done by the same experienced staff (two measurers) in order to avoid problems associated to inexperience (Kitahara et al. 2009; Kitahara et al. 2010) or to repetitions made by different operators (Skovsgaard et al. 1998). In all cases, the hypsometers were used without the support of a tripod.
Height measurements in smartphones are made using data collected by the built-in internal 3D accelerometer. This sensor detects changes in linear acceleration along three axes and makes it possible to determine the inclination of the terminal (this is the sensor used by applications that automatically rotate the screen). Some smartphones also incorporate a gyroscope that allows detection of the angular velocity along three axes.
The smartphone terminals analysed were a Desire (HTC Desire, Bravo) and a Note (Samsung Galaxy Note, GT-N7000). The features of their sensors were obtained by means of the Elixir 2 application (Barta 2012).
HTC Desire has a three-axis accelerometer BMA 150 (Bosch Sensortec GmbH) with a resolution of 0.153 m·s–2. It does not have a gyroscope.
Samsung Galaxy Note has a three-axis accelerometer K3DH (STMicroelectronics) with a resolution of 0.0383 m·s–2, and a K3G gyroscope (STMicroelectronics) with a resolution of 3.05·10–4 rad·s–1.
If the quality of the smartphone measurements is acceptable, the distance measurements for actual use can be made with a measuring tape (€10) or a laser telemeter (€100). In either case, the cost is lower than with traditional hypsometers (€700 for Blume Leiss or €1500 for Vertex).
2.2 Applications used
The Smart Tools software (version 1.5.0) was used in both terminals, since with the same application it is possible to take the measurements on the lengthways screen using the Height tool (with rotations on the Y axis), or on the edges of the smartphone case using the Slope tool (Z axis). The edge used to aim the Slope tool was the side of the screen, due to the fact that the edge of the HTC Desire case has a slightly curved design, and its lines are not so clear.
Prior to taking the measurements, the smartphone was calibrated following the application’s instructions. Current applications only enable correction of zero error, which is obtained by placing the smartphone on a perfectly level surface and setting the reading to 00 (the zero intercept is fixed). The calibration value was maintained throughout the tests.
2.3 Experiment
The measurers received several prior training sessions with the smartphones until they were able to repeat the measurements obtained. The experiment involved taking measurements on a building marked with targets at 4 heights, 6 m, 8 m, 10 m and 12 m. Each one was measured from a distance of 10 m, 15 m and 20 m (determined previously with a measuring tape). We selected the Department of Agroforestry Engineering building (our building job), and made marks up to the maximum height that could be reliably measured with a measuring tape (12 metres). We also took measurements at the base of the target (to determine total height) and at the observer’s eye level (to control levelling). Six repetitions were taken on different days, with a different angle of sunlight, cloud cover, wind, etc. The height and distance measurements were made with a measuring tape to verify the hypsometer readings.
In order to determine whether the measurements obtained with the smartphones had admissible errors, we followed the criteria used in the Forest Inventory and Analysis program (FIA). According with FIA criterion, the limit for the “height” variable is established at a minimum of 90% of the measurements obtained for individual trees with an error of less than 10% (Pollard et al. 2006).
2.4 Calibration
During the previous tests, a systematic error was detected in the smartphone measurements, due to a deficient internal transformation between the data from the accelerometer and the angle values (Fig. 1). This deficiency was present in both smartphones, and in both cases the measurements underestimate the true values. The linearity was found to be maintained, and this could therefore be corrected using linear regression. To avoid making the fit based on the data from the experiment, independent series were carried out for the calibration.
The calibration of the Slope tool was done by placing the lower edge of the case smartphone on a previously levelled Nedo Winkeltronic 600mm Digital Angle Finder (resolution: 0.1°, accuracy: ± 0.1°). Four repetitions were made (following the criterion used by Kitahara et al. 2010), measuring the angles 0°, 20°, 25°, 30°, 35°, 40°, 45°, 50°, 55° and 60° in each repetition. Between each repetition, the smartphone was rotated 360° around each of its three axes. The linear regression slope and the value of the coefficient of determination R2 were obtained from the data on the angles measured with the smartphone, and the angles measured with the Digital Angle Finder.
The calibration of the Height tool was done on the heights and distances in the experiment, and the measurements were taken in four repetitions (following the criterion used by Kitahara et al. 2010) made on a different day from the experiment. Between each repetition, the smartphone was rotated 360° around each of its three axes. In this case, the height measurements obtained needed to be previously transformed into angle values. The linear regression slope was drawn and the coefficient of determination R2 was derived from these angles and the real angles measured with a tape measure.
2.5 Statistical analysis
The statistical analysis of the measurements was made using the statistical package R. For each hypsometer, the mean, median, standard deviation and the 95% confidence interval was calculated for the relative errors (Eq. 1) and for the modulus of the relative errors (Eq. 2) of the six repetitions. The value of the root-mean-square error (RMSE, Eq. 3) was also calculated for the relative errors.

![]()
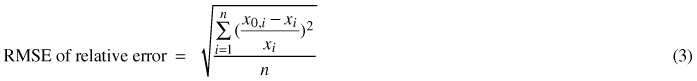
x0, x0,i = height obtained with hypsometer
x, xi = height obtained with tape measure
n = 72
Before proceeding to contrast the populations, the Shapiro Wilk test was applied to analyse the normality of the data, and Bartlett’s test was used to test their homoscedasticity. Wherever the requirements for the use of the analysis of variance were not met, the nonparametric Kruskal Wallis test was used to contrast the data. In this case, the multiple comparison test after Kruskal-Wallis was done with the “kruskalmc” tool in the “pgirmess” package, with a p-value of 0.05.
3 Results
Fig. 1 shows the results of the experiment without correction. The greater accuracy of the traditional forestry hypsometers can clearly be seen. The two smartphones reveal serious deficiencies due to their underestimation of the data, regardless of whether they calculate the heights using the Y axis (Height tool) or the Z axis (Slope tool). The greater height measurements can be seen to have more significant errors.
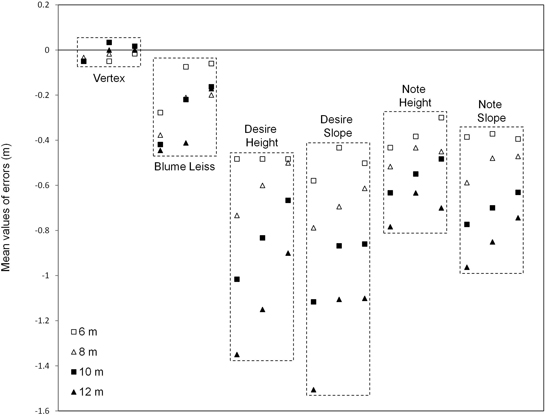
Fig. 1. Mean values of errors (6 repetitions) before calibration, for each hypsometer and height (6 m, 8 m, 10 m and 12 m). Desire = HTC Desire; Note = Samsung Galaxy Note; Height = Tool Height (Smart Tools); Slope = Tool Slope (Smart Tools). The data on the left for each hypsometer (dashed box) correspond to a distance of 10 m; those in the centre to 15 m; and those on the right to 20 m.
Table 1 and Table 2 show the total results obtained in the experiment. As in Fig. 1, Table 1 confirms that the two smartphones, regardless of the method used to take the measurements, reveal greater errors prior to calibration than the traditional forestry tools. A bias can also be seen in the 95% confidence intervals for the relative errors (Table 2). These intervals are significantly displaced towards negative values in the uncalibrated smartphones. The case of HTC Desire is particularly serious, as it does not even meet the minimum requirements of the Forest Inventory and Analysis program of the USDA Forest Service (FIA). The high errors obtained in the uncalibrated smartphones are confirmed by statistical analysis. The nonparametric Kruskall Wallis test was used (which gave a p-value of < 2.2·10–16) due to the heteroscedasticity indicated by Bartlett’s test. The results of the multiple comparison test between devices is shown in Fig. 2. The smartphone errors are significantly higher than those of the forestry hypsometers, regardless of the terminal model or the axis used.
| Table 1. Modulus of the relative errors of the height measurements of the hypsometers (with and without calibration of the smartphones). | ||||||||
| Hypsometer | Cal. | n | Mean (%) | Median (%) | SD (%) | 95% CI (%) | nFIA | %FIA |
| Vertex | 72 | 0.80 | 0.83 | 0.86 | 0.60, 1.00 | 72 | 100 | |
| Blume Leiss | 72 | 2.96 | 2.96 | 1.66 | 2.58, 3.35 | 72 | 100 | |
| Desire, Height | N | 72 | 8.38 | 8.33 | 1.77 | 7.94, 8.83 | 62 | 86.1 <> |
| Desire, Slope | N | 72 | 9.24 | 9.09 | 1.99 | 8.68, 9.79 | 51 | 70.8 <> |
| Note, Height | N | 72 | 5.87 | 6.00 | 1.26 | 5.57, 6.16 | 72 | 100 |
| Note, Slope | N | 72 | 6.73 | 6.66 | 1.13 | 6.47, 7.00 | 72 | 100 |
| Desire, Height | Y | 72 | 1.38 | 1.27 | 0.98 | 1.15, 1.61 | 72 | 100 |
| Desire, Slope | Y | 72 | 3.14 | 3.22 | 1.74 | 2.73, 3.55 | 71 | 98.6 |
| Note, Height | Y | 72 | 1.18 | 1.01 | 1.00 | 0.95, 1.41 | 72 | 100 |
| Note, Slope | Y | 72 | 2.41 | 2.36 | 1.03 | 2.17, 2.65 | 72 | 100 |
| Cal. = calibrated (N = no; Y = yes); n = number of height measurements; SD = standard deviation; 95% CI = confidence interval at the 95% confidence level; nFIA = number of measurements that fulfil the FIA criterion; %FIA = percentage of measurements that fulfil the FIA criterion. <> = Does not fulfil the FIA quality criterion. | ||||||||
| Table 2. Relative errors of the height measurements of the hypsometers (with and without calibration of the smartphones). | |||||||
| Hypsometer | Cal. | n | Mean (%) | Median (%) | SD (%) | 95% CI (%) | RMSE |
| Vertex | 72 | –0.25 | 0.00 | 1.15 | –0.52, 0.02 | 0.0117 | |
| Blume Leiss | 72 | –2.78 | –2.81 | 1.96 | –3.23, –2.32 | 0.0339 | |
| Desire, Height | N | 72 | –8.38 | –8.33 | 1.77 | –8.80, –7.97 | 0.0856 |
| Desire, Slope | N | 72 | –9.24 | –9.09 | 1.99 | –9.70, –8.77 | 0.0945 |
| Note, Height | N | 72 | –5.87 | –6.00 | 1.26 | –6.16, –5.57 | 0.0600 |
| Note, Slope | N | 72 | –6.73 | –6.66 | 1.13 | –7.00, –6.47 | 0.0683 |
| Desire, Height | Y | 72 | 0.54 | 0.46 | 1.61 | 0.17, 0.92 | 0.0169 |
| Desire, Slope | Y | 72 | –3.13 | –3.22 | 1.77 | –3.54, –2.72 | 0.0359 |
| Note, Height | Y | 72 | –0.61 | –0.58 | 1.42 | –0.95, –0.28 | 0.0154 |
| Note, Slope | Y | 72 | –2.41 | –2.36 | 1.03 | –2.65, –2.17 | 0.0262 |
| Cal. = calibrated (N = no; Y = yes); n = number of height measurements; SD = standard deviation; 95% CI = confidence interval at the 95% confidence level; RMSE = root-mean-square error. | |||||||
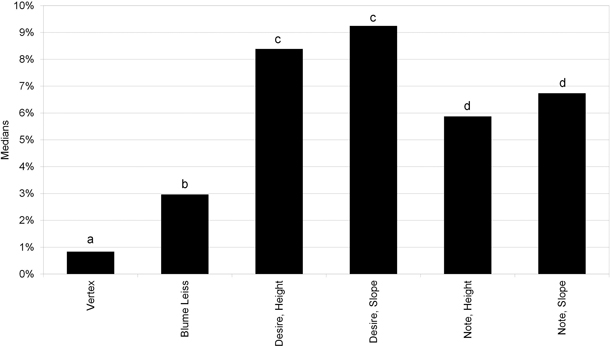
Fig. 2. Medians of the modulus of the relative errors before calibration. Desire = HTC Desire; Note = Samsung Galaxy Note; Height = Tool Height (Smart Tools); Slope = Tool Slope (Smart Tools). Medians of hypsometers without a common letter are significantly different at p = 0.05.
Fig. 3 shows the differences between the measurements according to the Z axis obtained with the Digital Angle Finder and the terminals. The proportionality of the internal error in the conversion of the accelerometer values to degrees of inclination can clearly be seen. This proportionality means the data can be easily corrected with a linear regression. The linear regression slopes with their corresponding R2 are shown in Table 3. The proportionality revealed in Fig. 3 is confirmed by the high values of the coefficients R2 (greater than 0.99 in all cases). Except for Note using the Slope tool, the p-values were clearly significant in both intercept and coefficient. The coefficient values indicate that in all cases there is positive proportional systematic error, with values that range between 3.9% and 9.5%. The intercept values also reveal that there is constant systematic error (except in the case of Note with the Slope tool), in spite of performing the calibration integrated in the app. However, constant error is less important, as in most cases its values are barely a third of a degree (representing an error of only 14 cm in a tree with a height of 12 m).
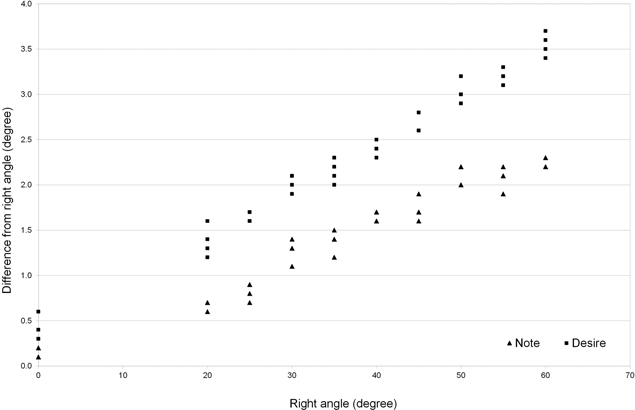
Fig. 3. Differences between the smartphone readings (measured on axis Z) and those of the Digital Angle Finder (Right angle).
| Table 3. Regression models of the smartphones and the Digital Angle Finder. | |||||
| Smartphone | Axis | Regression model | R2 | P-values | |
| Intercept | Coefficient | ||||
| Note | Y | f(y) = 1.04471y + 0.35464 | 0.99925 | <0.0001 | <0.0001 |
| Note | Z | f(z) = 1.03904z + 0.05963 | 0.99993 | 0.263 | <0.0001 |
| Desire | Y | f(y) = 1.09512y – 1.84003 | 0.99952 | <0.0001 | <0.0001 |
| Desire | Z | f(z) = 1.05483z + 0.39165 | 0.99995 | <0.0001 | <0.0001 |
| Note = Samsung Galaxy Note; Desire = HTC Desire. y, z = angles obtained with the smartphone. f(y), f(z) = corrected estimated angles. | |||||
The corrected values of the experiment after applying the correction obtained in the calibration tests are shown in the lower part of Table 1 and Table 2. It can be seen that the measurements obtained with the smartphones have markedly improved, and in all cases meet the FIA criterion. The best results were obtained with the measurements based on the rotations around the Y axis (Height tool). A negative bias can still be seen in the 95% confidence intervals of the relative errors of the Slope tool after calibration (Table 2), although similar to Blume Leiss.
The statistical analysis of the relative errors after calibration indicates a clear heteroscedasticity of the data (the p-value according to Bartlett’s test is 9.97·10–8), and hence the nonparametric Kruskal Wallis test was applied. The results indicate once again that there are clear and significant differences between hypsometers (p-value < 2.2·10–16). The separation of the groups in this case is shown in Fig. 4.
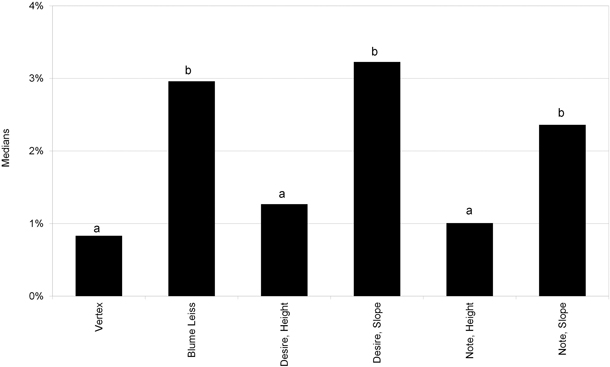
Fig. 4. Medians of the modulus of the relative errors after calibration. Desire = HTC Desire; Note = Samsung Galaxy Note; Height = Tool Height (Smart Tools); Slope = Tool Slope (Smart Tools). Medians of the hypsometers without a common letter are significantly different at p = 0.05.
We detected no influence of tree height on errors. The modulus of the error (in metres) increases with height, but no modifications in relative error (in %) were observed with height (p-value > 0.05).
The effect of distance to tree on the quality of the measurements in the case of HTC Desire with Slope tool was similar to Blume Leiss. In all other cases the influence of distance is similar to Vertex (p-value > 0.05).
4 Discussion
It is important to highlight that the present study analyses the errors in measurement, not the speed at which the measurements are taken. This aspect has been studied in forestry hypsometers (Bozic et al. 2005; Tallant and Pelkki 2004) but not in smartphones. Although the time required to take the height measurements was similar in all the hypsometers (aiming and reading the results), the differences in their actual use is due to the previous phase of measuring the distance to the object. In the present study, owing to the fact that the measurements were taken at fixed distances previously measured with a tape, no differences in the times were detected.
The errors obtained using traditional forestry hypsometers are similar to the findings of other studies. The maximum (7.6%) and mean (2.96%) values of the modulus of the relative error of the Blume Leiss in this work are similar to the results of the study on Fagus sylvatica by Rondeux and Claustriaux (1983), which found values of between 10% and 1% respectively.
The median of the modulus of the relative errors for the Vertex was 0.8%, lower than reported by Kitahara et al. (2010). This is due to the fact that these measurements were made by inexperienced surveyors. The effects of training show that the errors in the equipment of Kitahara et al. (2010) decrease towards the value indicated in the present study. Williams et al. (1994) obtained errors with the Laser Height Finder that are similar to the rest of the hypsometers. This could be related with the early preproduction model used and with the low number of samples taken with this hypsometer.
The comparison with other analyses of errors obtained using smartphones as forestry hypsometers is limited, due to the scarcity of available studies. Itoh et al. (2010) uses an iPhone and calculates a Root Mean Square Error of 0.7 m for measurements of 10 m in height from a distance of 20 m. In the present study the value for Root Mean Square Error obtained for the same variables is 0.63 for Note and 0.86 for Desire (without calibration), very similar to the above.
The smartphone results indicate that a prior calibration is required to correctly transform the data from the accelerometer into angle or height measurements. This transformation error is not exclusive to these hypsometers (Skovsgaard et al. 1998; Lukic et al. 2005). This bias may be negligible in the normal use of a smartphone (screen turns, tilting while gaming) but it is unacceptable if we need to obtain precise measurements of slopes. It is surprising that the manufacturers have failed to correct this underestimation of the values, which is common to both the smartphones analysed, and on the two axes. Vertex is the only hypsometer that does not have this systematic error. However, the smartphones reveal highly defective source transformations, which makes them practically worthless for use in measuring the height of trees. The errors obtained with the uncalibrated measurements far exceed those of the forestry hypsometers, and in some cases do not meet the minimum required by the USDA Forest Service (Pollard et al. 2006).
The use of the Slope tool shows systematic errors towards lower values in both smartphones, even after calibration. This bias is similar to the one seen in the Blume Leiss. The reason for this error is that the calibration process was done with a Digital Angle Finder, not with the experiment height measurements. The fact that this is not a direct calibration may cause distortions to appear, as when the lower edge of the smartphone case (calibration reference) and the upper edge of the screen (height measurement reference) are assumed to be perfectly parallel. It is therefore advisable to make the calibrations using real height measurements, as was done with the Height tool.
The process of calibrating the smartphones considerably improves measurement errors. The statistical analysis indicates that with this calibration procedure the measurements are significantly equivalent to (Desire) or better than (Note) the Blume Leiss. The measurements obtained with the Vertex were observed to be the best quality (these results coincide with those of Lukic et al. 2005), but they do not present significant differences with those obtained with Height tool. The lower errors obtained in Note compared to Desire are due to the greater resolution of the accelerometer and the presence of the gyroscope.
The proportionality between the data from the accelerometer and the smartphone measurements makes it simple and effective to establish a linear regression slope. Surprisingly, although some of the applications allow the calibration of the accelerometer, as in the case of Smart Tools (Smart Tools co. 2012), this is limited to setting 0, and does not allow the adjustment of the linear regression slope. It is essential to incorporate this calibration procedure into all smartphone applications intended for the estimation of angles based on measurements from the accelerometer.
References
Barta T. (2012). Elixir 2. Ver 2.28. Application available at: https://play.google.com/store/apps/details?id=com.bartat.android.elixir&hl=en. Developer’s website: http://bartat.hu/. [Cited 11 Dec 2012].
Bozic M., Cavlovic J., Lukic N., Teslak K., Kos D. (2005). Efficiency of ultrasonic Vertex III hypsometer compared to the most commonly used hypsometers in Croatian forestry. Croatian Journal of Forest Engineering 26(2): 91–99.
Deskis OU. (2012). Measure Height. Ver 1.3. Application available at: https://play.google.com/store/apps/details?id=ee.deskis.android.height&hl=en. Developer’s website: http://www.deskis.ee/. [Cited 6 Nov 2012].
Han D. (2013). Standing tree volume measurement technology based on digital image processing. Proc. SPIE 8761, PIAGENG 2013: Image Processing and Photonics for Agricultural Engineering, 87610E (March 4, 2013).
Itoh T., Eizawa J., Yano N., Matsue K., Naito K. (2010). Development of software to measure tree heights on the smartphone. Journal of the Japanese Forest Society 92: 221–225. [In Japanese]. http://dx.doi.org/10.4005/jjfs.92.221.
Kennedy R.R. (2012). Use of smartphone and GIS technology for sustainable forestry in Eastern Ontario. Thesis. University of Ottawa. 95 p.
Kitahara F., Mizoue N., Shigejiro Y. (2009). Evaluation of data quality in Japanese National Forest Inventory. Environmental Monitoring and Assessment 159(1): 331–340. http://dx.doi.org/10.1007/s10661-008-0632-8.
Kitahara F., Mizoue N., Shigejiro Y. (2010). Effects of training for inexperienced surveyors on data quality of tree diameter and height measurements. Silva Fennica 44(4): 657–667. http://dx.doi.org/10.14214/sf.133.
Lee Y.S., Cho S.B. (2011). Activity recognition using hierarchical hidden markov models on a smartphone with 3D accelerometer. In: Corchado E., Kurzynski M., Wozniak M. (eds.). HAIS 2011, Part I, LNAI 6678. p. 460–467.
Lukic N., Bozic M., Cavlovic J., Teslak K., Novosel D. (2005). Investigating the Vertex III ultrasonic altimeter/distance measurer applicability in relation to the most commonly used altimeters in the forestry of Croatia. Sumarski list 129(9–10): 481–488. [In Croatian].
Pollard J.E., Westfall J.A., Patterson P.L., Gartner D.L., Hansen M., Kuegler O. (2006). Forest inventory and analysis. National data quality assessment. Report for 2000 to 2003. U.S. Department of Agriculture, Forest Service, Rocky Mountain Research Station, General Technical Report RMRS-GTR-181. 43 p.
Roesch F.A. (2002). The sensitivity of derived estimates to the measurement quality objectives for independent variables. Proceedings of the Fourth Annual Forest Inventory and Analysis Symposium, 2002 November 19–21. U.S. Department of Agriculture, Forest Service. New Orleans. p. 173–180.
Rondeux J., Claustriaux J.J. (1983). Précision de la mesure de hauteurs d’essences feuillues. [Errors in height measurement of hardwood trees]. Bulletin des Recherches Agronomiques de Gembloux 18: 61–69.
Skovsgaard J.P., Johannsen V.K., Vanclay J.K. (1998). Accuracy and precision of two laser dendrometers. Forestry 71(2): 131–139. http://dx.doi.org/10.1093/forestry/71.2.131.
Smart Tools co. (2012). Smart Tools. ver. 1.5.0. Application available at: https://play.google.com/store/apps/details?id=kr.aboy.tools&hl=en. Developer’s website: http://androidboy1.blogspot.com.es/2013/04/smart-tools-manual.html. [Cited 6 Nov 2012].
Taakkumn. (2012). aHypsometer Lite. Ver 1.0. Application available at: https://play.google.com/store/apps/details?id=com.taakkumn.iHypsometerLite&hl=en. Developer’s website: http://www.taakkumn.com/taakkumnRoom/iHypsometer.html. [Cited 7 Nov 2012].
Tallant B., Pelkki M. (2004). A comparison of four forest inventory tools in southeast Arkansas. In: Alavalapati J.R.R., Carter D.R. (eds.). Competitiveness of southern forest products markets in a global economy: trends and predictions. Proceedings of the Southern Forest Economics Workshop 2004, St. Augustine, USA. p. 23–34.
Williams M.S., Bechtold W.A., LaBau V.J. (1994). Five instruments for measuring tree height: an evaluation. Southern Journal of Applied Forestry 18(2): 76–82.
Zhang J., Huang X. (2009). Measuring method of tree height based on digital image processing technology. Information Science and Engineering (ICISE), 1st International Conference. p. 1327–1331.
Total of 19 references
