Marjut Turtiainen  ,
Jari Miina,
Kauko Salo,
Juha-Pekka Hotanen
,
Jari Miina,
Kauko Salo,
Juha-Pekka Hotanen
Empirical prediction models for the coverage and yields of cowberry in Finland
Turtiainen M., Miina J., Salo K., Hotanen J.-P. (2013). Empirical prediction models for the coverage and yields of cowberry in Finland. Silva Fennica vol. 47 no. 3 article id 1005. https://doi.org/10.14214/sf.1005
Highlights
- The site fertility significantly affected the abundance of cowberry on mineral soils, spruce mires and pine mires
- The stand basal area and dominant tree species were among the most important forest structural predictors in the model for the coverage
- In the cowberry yield model developed for mineral soil sites, the stand basal area and coverage of cowberry plants were statistically significant predictors.
Abstract
Empirical models for the coverage and berry yield of cowberry (Vaccinium vitis-idaea L.) were developed using generalized linear mixed models (GLMMs). The percentage coverage of cowberry was predicted as a function of site and stand characteristics using data from the Finnish National Forest Inventory (NFI) in 1995. The average annual yield, including the between-year variation in the yield, was predicted as a function of percentage coverage and stand characteristics using permanent experimental plots (MASI) established in different areas of Finland and measured in 2001-2012. The model for cowberry yields (Model 2) was developed for mineral soil forests. The model for the coverage (Model 1) was constructed so that it considers both mineral soil sites and also many other sites where cowberry occurs in the field layer. According to Model 1, the site fertility significantly affected the abundance of cowberry on mineral soils, spruce mires and pine mires. The stand basal area and dominant tree species were among the most important forest structural predictors in Model 1. The site fertility was not a significant predictor in the cowberry yield model. Instead, the stand basal area and coverage of cowberry plants were found to be statistically significant predictors in Model 2. The estimated models were used to predict the cowberry coverage, average annual yield and its 95 % confidence interval along with stand development. The models of this study can be used for multi-objective forest planning purposes.
Keywords
generalized linear mixed model;
abundance;
berry yield;
Vaccinium vitis-idaea L.
-
Turtiainen,
University of Eastern Finland, School of Forest Sciences, P.O. Box 111, FI-80101 Joensuu, Finland
E-mail
marjut.turtiainen@uef.fi
- Miina, Finnish Forest Research Institute, Joensuu Unit, P.O. Box 68, FI-80101 Joensuu, Finland E-mail jari.miina@metla.fi
- Salo, Finnish Forest Research Institute, Joensuu Unit, P.O. Box 68, FI-80101 Joensuu, Finland E-mail kauko.salo@metla.fi
- Hotanen, Finnish Forest Research Institute, Joensuu Unit, P.O. Box 68, FI-80101 Joensuu, Finland E-mail juha-pekka.hotanen@metla.fi
Received 23 May 2013 Accepted 10 September 2013 Published 30 September 2013
Views 251394
Available at https://doi.org/10.14214/sf.1005 | Download PDF

Corrections
1 Introduction
Cowberry (Vaccinium vitis-idaea L.) is one of the most common and most abundant forest berry species in Finland (Hotanen et al. 2000). This species has adapted to a wide range of different site and land types in coniferous ecosystems and, therefore, is widely distributed in different parts of Europe and in northern Asia (e.g. Ritchie 1955; Landolt 1996; Grjaz’kin et al. 2006). In northern America, there occurs the subspecies V. vitis-idaea spp. minor (Ritchie 1955).
In Finland, cowberry is at its most typical in light pine-dominated dryish heath forests (e.g. Raatikainen et al. 1984; Salo 1995; Salemaa 2000). Cowberry also occurs and produces yield in many marginal types of forest (e.g. fell forests), and on pristine and drained peatland sites (e.g. Salo 1995; Salemaa 2000 and references therein). On drained peatlands (particularly on drained pine mires) the coverage of the species increases along with the post-drainage succession phases (i.e. recently drained, transforming phase, transformed phase) (Sarasto 1961; see also Laine et al. 1995 - they used drainage age classes). On average, the coverage of cowberry has decreased drastically on Finnish mineral soil forests and peatlands since the 1950s. During the 40 years from the beginning of the 1950s to 1995, the average coverage of cowberry has declined from 16% to 6% (Salemaa 2000). One reason for this phenomenon is intensive forestry including clear-cuttings combined with soil preparation (e.g. Tolvanen 1994, 1995). The forest density, as well as the proportion of young forests, has also increased, which has had negative effects on the abundance (coverage) of cowberry (Salemaa 2000; see also Hedwall et al. 2013).
Cowberry is the economically most significant wild berry species in Finland and it also provides the most abundant annual crops, varying from approximately 130 to 390 million kg depending on the crop level of the year (Turtiainen et al. 2011). Picking wild berries provides many kinds of benefits to people. Berries are picked for both household use and sale, and berry picking is also considered to be healthy exercise. In addition, the health effects of many wild berry species have been widely recognized. In 2011, the total amount of wild berries collected by Finnish households was 34.9 million kg and, of this amount, cowberry constituted 46% (16.1 million kg) (Vaara et al. 2013). In this context, it is important to note that not only people but also many wild animal species benefit from wild berries. Cowberry and the other common wild berry species, such as bilberry (Vaccinium myrtillus L.), form an essential part of the nutritional diet of many herbivores (e.g. grouse, voles) and predators (e.g. bear (Ursus arctos)) (Grjaz’kin et al. 2006; Lakka and Kouki 2009).
During the last decades, the preferences of many forest landowners about forests and forestry have become increasingly diversified, i.e. income from timber is no longer considered as the sole goal of forest management, since goals related to nature conservation and multiple-use aspects of forests have gained increasing importance. A survey of private Finnish forest owners conducted at the end of the 1990s indicated that nearly half of the owners set several goals, both monetary and non-monetary, in regard to management of their own forests (Karppinen et al. 2002). One fifth of the owners were interested purely in recreational aspects of their forests, and the rest emphasized either working opportunities or the economic security that the forest estate provides (Karppinen et al. 2002). In a case when berry yields – or recreation through berry picking – are highly valued by the forest owner, the effect of alternative management options on berry yields should be included in forest planning. This means that there is a need for numerical prediction models for different wild berry species so that the production of berries can be integrated in model based forest planning.
So far, several models for the yields of cowberry (and also for bilberry) have been developed in Finland (Muhonen 1995; Pukkala 1998; Ihalainen and Pukkala 2001; Ihalainen et al. 2002, 2003, 2005). All these models are suitable for forest planning calculations (i.e. they use as explanatory variables such site and stand characteristics which are known in forest planning), but most of them are based on expert knowledge. It has been suggested that expert models should be used only temporarily until empirical-studies-based models are available (Kangas 1998). In fact, only the models of Pukkala (1998) and Ihalainen et al. (2003) are based on empirical measurements, but these unfortunately rely on regional data and are consequently not applicable to the conditions of the whole of Finland. So far, there has been only one attempt to create berry yield models for the area of the whole country, namely the regional expert models of Ihalainen et al. (2005) for the 13 Forestry Centres of Finland (see Fig. 1, Forestry Centres 1–13). These models have been further calibrated for an average crop year with a set of empirical data (Turtiainen et al. 2005).
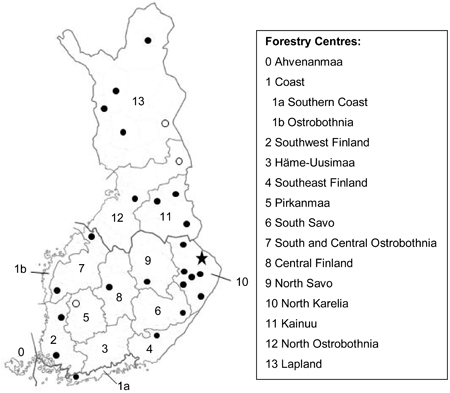
Fig. 1. Locations of MASI stands used in this study. Black circle means that there was one stand per municipality. The cases with two stands and five stands per municipality are marked with an unfilled circle and a star, respectively. Numbers 0–13 refer to Forestry Centres of Finland.
Recently Miina et al. (2009) developed a set of prediction models for bilberry. These empirical models predict first the coverage of bilberry and then the annual berry yield as a function of stand characteristics and bilberry coverage. The models also enable us to consider, for the first time, the annual variation in yield predictions. The coverage model of Miina et al. (2009) can be applied throughout the country, but the yield model is regional due to the limitations in one of the datasets used. In addition, Miina et al. (2009) focused in their study purely on mineral soil sites, which is the case also in earlier modelling attempts, with one exception (Ihalainen and Pukkala 2001).
Thus, the overview above on the existing models for wild berries makes it clear that there is still room for improvements in the future modelling attempts. In this study, two empirical models for cowberry (i.e. models for the abundance and yields including annual variation) were developed using the modelling approach applied by Miina et al. (2009). The datasets of this study made it possible to create both models for the whole of Finland. In addition, the model for the coverage was constructed so that it considers not only mineral soil sites but also many other sites where cowberry occurs and produces yield (i.e. peatland sites and fells). The models were developed for multi-objective forest planning purposes. Their performance was illustrated by predicting the development of the cowberry coverage and yields in accordance with the development of pine stands in southern and northern Finland.
2 Materials and methods
2.1 Data on the percentage coverage of cowberry
The study material consisted of the measurements of site and stand characteristics and the coverage of plant species carried out on the permanent sample plots (300 m2) of the Finnish National Forest Inventory (NFI) in 1995 (so-called PSP3000 data). The inventory in southern Finland was based on clusters of four permanent sample plots, arranged in a north-south direction, located systematically at intervals of 400 m. In northern Finland, the corresponding layout was three plots at 600 m intervals. The clusters were arranged systematically throughout the country (Pysyvien koealojen… 1995, see also e.g. Maltamo 2006).
Sample plots representing seven different categories (a)–(g) were used in this study. The categories were developed for the purpose of this study and were selected on the basis of the criterion that cowberry occurs on each of them – typically frequently and abundantly – in the field layer (e.g. Lohiniva and Saastamoinen 1989; Hotanen et al. 2000; Vuokko 2005). Category (a) included sample plots located on mineral soil sites of forest land (for the definition of forest land, see e.g. Finnish Statistical…2012; cf. the international definition of forests e.g. in FAO 2010) (Table 1). Categories (b)–(e) also pertained to forest land and represented different combinations of the main groups of forested peatland site types (spruce mires, pine mires) and post-drainage succession phases (transforming phase = clear effect on ground vegetation and tree stand; transformed phase = vegetation resembles corresponding heath forest site type, tree stand forest-like) (Sarasto 1961). They were as follows:
b) spruce mires – transforming phase
c) spruce mires – transformed phase
d) pine mires – transforming phase
e) pine mires – transformed phase
On poorly productive land and unproductive (waste) land, only fell forests and summits (i.e. site quality class VIII; see e.g. Pysyvien koealojen… 1995; Tomppo et al. 2011) were considered in the modeling, i.e. categories (f) and (g) (see Table 1).
| Table 1. Main characteristics of cowberry coverage and stands in the PSP3000 data used in this study, by categories (a)–(g). Categories (a)–(e) pertain to forest land. For each category, number of stands (N), mean values and ranges of variation (min–max) of the characteristics are presented. Sites I-V and VII-VIII refer to different site quality classes (I = herb-rich forests, eutrophic mires, II = herb-rich heath forests, mesotrophic mires, III = mesic heath forests, meso-oligotrophic mires, IV = sub-xeric heath forests, oligotrophic mires, V = xeric heath forests, poor ombro-oligotrophic bogs, VII = rocky and sandy soils, VIII = summit and fell forests). View in new window/tab. |
In the NFI, the fertility of mineral soil sites of forest land (category a) is determined using the following site quality classification: class I = herb-rich forests (groves), II = herb-rich heath forests, III = mesic (fresh) heath forests, IV = sub-xeric (dryish) heath forests, V = xeric (dry) heath forests, VI = barren heath forests, and VII = rocky and sandy soils (Pysyvien koealojen… 1995; Tomppo et al. 2011). In this study, site quality class VI was omitted because it contained only one sample plot.
In the site quality classification used in the NFI, peatland sites are grouped by their fertility level as follows: I = eutrophic, II = herb-rich (mesotrophic), III = Vaccinium myrtillus and tall-sedge (meso-oligotrophic), IV = Vaccinium vitis-idaea and small-sedge (oligotrophic), V = cottongrass and dwarf-shrub (poor ombro-oligotrophic bogs) and VI = Sphagnum fuscum (ombrotrophic bogs) (e.g. Pysyvien koealojen… 1995; Tomppo et al. 2011). The PSP3000 data concerning pine mires was represented by classes I-VI, but in this study class VI was omitted because it contained only two sample plots. In addition, classes I-III were combined into one bigger class (Table 1) because pine mires of I- and II-class origin develop into V. myrtillus drained peatland forest site type (sub-type II) after drainage (e.g. Vasander and Laine 2008). The spruce mires were represented by fertilities I-IV, but the two most fertile classes were combined into one (Table 1).
A total of 2515 sample plots were included in the study material. Most of the plots were completely located within one unified stand, but 11% of the plots were divided into two stands and five plots even into three stands due to the heterogeneity of the sample plot. As a result, 2801 stands were included in the analyses, the division of which into different categories is presented in Table 1. The data had a hierarchical structure because the sample plots were located in 983 clusters which in turn were located in 367 municipalities and 14 forestry centre regions.
The stand characteristics were measured and recorded according to the field instructions of the NFI (Pysyvien koealojen… 1995). On each sample plot, the covers of individual species (including cowberry) were estimated from usually four 2-m2 quadrates (e.g. Heikkinen and Reinikainen 2000; Maltamo 2006) and their averages were used as the sample plot-wise (stand-wise) estimates of abundance. If the sample plot was bisected by a stand compartment boundary, the stand characteristics and species coverages were estimated separately for each stand and used in the modelling.
On mineral soil sites of forest land (category a), about 70% of the stands were naturally regenerated, while the remainder was either planted or direct seeded. Only 2% of the stands were located on former agricultural land. According to the stand volume of individual tree species, most of the stands (59%) were dominated by pine (Pinus sylvestris), 31% by spruce (Picea abies) and 8% by birches (Betula pendula, B. pubescens) and other deciduous tree species. The rest of the stands were recently clear-cut. On spruce mires (categories b and c), spruce was the dominant tree species on 45% of the stands. Pine and birch were also common on spruce mires (the corresponding proportions were 26% and 25%, respectively). Pine mires (categories d and e) were mainly pine-dominated and fell forests (category f) mostly birch-dominated.
2.2 Cowberry yield data
The yield of cowberry and its annual variation during 2001–2012 were studied using the inventory data (so-called MASI data) collected in different parts of Finland by the Finnish Forest Research Institute (see e.g. Salo 1999; Turtiainen et al. 2011). In the MASI inventory, the flowering and ripening of cowberries (and also bilberries) are recorded annually in permanent sample plots which have been placed in forest stands found to be good growing sites for the species. In each stand, there are five permanent 1-m2 quadrates. In this study, the mean annual number of ripe cowberries on the quadrates was used in the analyses. In 2001–2012, there were a total of 193 observations on the mean annual number of cowberries in the study material (Table 2). On average, the number of cowberries was recorded 5.7 times per stand during the twelve-year period.
| Table 2. Main characteristics of cowberry and stands in the MASI data (193 annual observations in 34 stands). Sites III-V refer to different site quality classes of mineral soil forests (III = mesic heath forest, IV = sub-xeric heath forest, V = xeric heath forest). | ||||
| Characteristic | N | Mean | Min | Max |
| Number of berries (m–2) | 193 | 130.4 | 0 | 2338 |
| on site III | 15 | 233.8 | 11 | 1173 |
| on site IV | 154 | 122.4 | 0 | 2338 |
| on site V | 24 | 117.1 | 8 | 332 |
| Coverage of cowberry (%) | 34 | 48.2 | 9 | 86 |
| on site III | 3 | 63.0 | 52 | 77 |
| on site IV | 26 | 46.2 | 9 | 86 |
| on site V | 5 | 49.4 | 22 | 76 |
| Altitude (m) | 34 | 149.2 | 19 | 314 |
| Temperature sum (dd) | 34 | 1015.5 | 682 | 1337 |
| Stand age (a) | 34 | 75.7 | 5 | 300 |
| Stand basal area (m2ha–1) | 34 | 12.0 | 0 | 35 |
The number of MASI stands has varied to some extent from year to year for various reasons (e.g. Miina et al. 2009; Turtiainen et al. 2011). For example, regeneration cutting of a certain stand may have destroyed the quadrates. On the other hand, new stands with new quadrates have been created almost every year. When a stand was established before 2009, only a limited number of site and growing stock characteristics was recorded (i.e. site type, dominant tree species, stand development class). Instead, more measurements were made in stands established in 2009–2012 (i.e. stand age, stand basal area by tree species, coverages of berry plant species). These additional measurements were conducted also in some of the stands established before 2009. The coverage of a plant species was estimated on the same quadrates that were also used for annual monitoring of ripe berries (see above) and the mean coverage on the quadrates was used in the analyses. The study material included 34 stands in which all the characteristics mentioned above were inventoried (Table 2).
It is worth noting that stand characteristics and the coverage of cowberry in each stand were measured during one particular year while observations of ripe berries were made over a longer period. In the case of a few stands, the development class of the stand had changed during the period of annual observations (e.g. from small-seedling stand to advanced seedling stand). It is quite obvious that cowberry yields decrease when seedling stands grow up and become denser (e.g. Raatikainen 1978). This fact was taken into account so that in each stand only those annual observations which pertain to the same development class as the coverage estimate and the estimates of growing stock were included in the data.
The stands were located in 27 municipalities and in 12 forestry centre regions (Fig. 1). All of them represented mineral soil sites of forest land and were pine-dominated. Most of the stands (76%) belonged to site quality class IV, 15% to class V and the rest (9%) to class III (Table 2). The development classes of the stands were as follows: seed-tree stands (9%), small-seedling stands (21%), advanced seedling stands (9%), young thinning stands (12%), advanced thinning stands (18%) and mature stands (32%).
2.3 Statistical modelling
2.3.1 General
Models were prepared for the mean percentage coverage of cowberry (Model 1) and the mean number of ripe cowberries in the stand (Model 2) using the PSP3000 and MASI datasets, respectively. The models were prepared using generalized linear mixed models (GLMMs). In this study, the coverage of species was treated as a proportion, and Model 1 was expressed by the logit-link function with a binomial response (McCullagh and Neldel 1989). The model for counts (Model 2) was expressed by the log-link function with a Poisson response (McCullagh and Neldel 1989). Due to discrete (binomial and Poisson) distributions, the average coverages and numbers of berries were rounded to the nearest integer. The multi-level hierarchy and unbalanced structure of the data were taken into account by including random effects at different levels in the variance component models, and by allowing the intercept to vary randomly across the levels (e.g. Searle et al. 1992; Snijders and Bosker 1999; Goldstein 2003). As suggested by Browne et al. (2005), overdispersion in the response variables was taken into account by adding an additional random term in the models (“pseudo” level). The GLMMs were estimated using the glmmPQL function of the R software (R Development Core Team 2012).
2.3.2 Cowberry coverage
The general multi-level (i.e. hierarchical) binomial model (Model 1) used in this study was as follows:
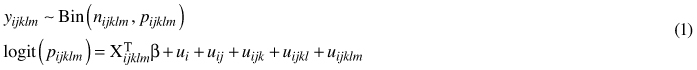
where y is the mean percentage coverage of 2-m2 quadrates in the stand; Bin(n, p) denotes the binomial distribution with parameters n (binomial sample size; in this study, all nijklm are equal to 100) and p (expected coverage of the species); logit(p) is a logit-link function; and Xijklm are the fixed predictor variables with corresponding coefficients vector β. Subscripts i, j, k, l and m refer to the forestry centre region, municipality, cluster, sample plot and stand, respectively. ui, uij, uijk, uijkl and uijklm are normally distributed random effects with a mean of 0 and constant variances.
In principle, the modelling of coverage consisted of three steps. First, GLMMs were developed for each category (a)–(e). The stand age and stand basal area, as well as several transformations of these variables (e.g. squared stand age), were used as fixed continuous predictors in the models. The altitude of the stands and mean effective temperature sum during the growing season (threshold +5 ºC), as described in Ojansuu and Henttonen (1983), were also used as continuous predictors to describe the south-north variation in the growing conditions at the national level. The categorical predictors (site quality class, dominant tree species, regeneration method and history of the stand) were considered in the modelling by dummy variables. In addition, some interactions of the variables (e.g. site quality class × stand age) were used as additional potential predictors. All the fixed predictors included in the models had to be logical and statistically significant (the significance level used in this study was 0.05), and no systematic errors were observed in residuals.
In the second stage, models created for each of the categories (a)–(e) were compared with each other. In this comparison, it was examined whether the same predictors were included in different models. It was also checked whether the relationships were similar in different models. As a result of these investigations, it was decided to combine category (b) with category (c) and, consequently, to develop a new model for spruce mires. Correspondingly, a new model was developed for pine mires so that observations of both categories (d) and (e) were employed. It is worth noting that the combination of these two post-drainage succession phases (i.e. transforming and transformed phases) was found to be justified also because practical forestry is withdrawing from separating the post-drainage succession phases (e.g. Vasander and Laine 2008). From now on in this study, when talking briefly about spruce mires, categories (b) and (c) are meant, and when talking about pine mires, categories (d) and (e) are meant.
In the final stage, a common model was created for categories (a)–(g) so that a model for mineral soil sites (step 1) and models for spruce mires and pine mires (step 2) were used as the basis of modelling. Site dummy variables which were statistically significant in these separate models were included in the common model by means of main group-specific site dummies (site IV on mineral soils was the reference). Other fixed predictors were added to the common model using the following general rule: if a certain predictor was included only in one main group-specific model, it concerned only this main group (i.e. mineral soil site, spruce mire or pine mire) also in the common model. Instead, if the same predictor was included in several main group-specific models, it concerned these particular main groups also in the common model. The predictors “temperature sum” and “altitude”, however, formed an exception to this general rule as it was decided to check whether these predictors became statistically significant for all the categories (also categories (f) and (g)). Categories (f) and (g) were considered in the common model also by their own dummy variables.
2.3.3 Cowberry yield
The general multi-level Poisson model (Model 2) used in this study was as follows:
where y is the mean number of berries on five 1-m2 quadrates in the stand in year t; the conditional distribution of y, given the expected value π, is the Poisson distribution; ln(π) is a log-link function; and Xijmt are the fixed predictor variables with corresponding coefficients vector β. Subscripts i, j, m and t refer to the forestry centre region, municipality, stand and year, respectively. ui, uij, uijm and uijmt are normally distributed random effects with a mean of 0 and constant variances. In Eq. 1 and 2, random terms at different hierarchical levels were assumed to be uncorrelated.
In the modelling of cowberry yield, practically the same fixed predictors were employed as in the modelling of coverage (step 1). In addition, the coverage was also used as a potential predictor. Because the glmmPQL function did not allow the random cross-effects, the effects of the years 2001–2012 were considered using dummy variables in fixed predictors.
2.4 Simulations
The performance of the estimated models was illustrated by predicting the coverage of cowberry and the cowberry yield and its annual variation in various stands whose initial characteristics, development and management were simulated using the Motti stand simulator (e.g. Hynynen et al. 2005). Simulations were conducted for southern and northern Finland, with the temperature sum and altitude set at 1200 dd. and 100 m (Southwest Finland), and 900 dd. and 200 m (Kainuu), respectively (cf. Fig. 1 and Finnish Statistical… 2000, p. 28). In the simulations, only pine stands were considered because both the coverage and yield of cowberry are, on average, higher in stands dominated by pine compared with stands dominated by spruce or deciduous trees (e.g. Salo 1995; Tonteri et al. 2005). Thus, only the most common cases were included in this paper.
The development of stands representing mineral soils and pine mires was simulated on sites III, IV and V, which are typical growing sites for pine. On mineral soil sites, the initial stands on different sites and at different geographical locations were generated with a stand age of 5 years. The stands were assumed to be direct seeded for pine. They were thinned three times before regeneration felling leaving seed trees (cf. Hyvän metsänhoidon… 2006). On pine mires, the mean height of the initial stands was set at 4 m because the Motti simulator was not able to simulate the earlier stages of stand development reliably enough. Depending on the site fertility and temperature sum, the mean height of 4 m was set to correspond to stand ages varying from 20 to 45 years. The stands were assumed to be naturally regenerated, and were thinned 1–2 times before regeneration felling leaving seed trees.
The development of the coverage of cowberry was presented as a function of stand characteristics for several site fertilities (sites III-V), on both mineral soils and pine mires. The cowberry yield and its annual variation were presented only for sub-xeric heath forests (site IV) because the modelling data (i.e. MASI data) mainly covered site IV. The coverage of cowberry was predicted using Model 1, and the number of berries was predicted using Model 2 so that estimates for the cowberry coverage were first computed using Model 1. In the calculations, the number of berries was converted into the cowberry yield (kg ha–1) by multiplying it by the mean weight of one ripe berry (0.23 g) (Kuchko 1988; Ihalainen et al. 2003). It is worth noting that the mean value of the fixed year effects was used as a year effect in Model 2 (i.e. it was added to the intercept) when the average annual yields were calculated for the simulated stands. The variance of the year effects was estimated from the sample variance of the fixed year effects by subtracting the additional variance caused by the estimation errors (see e.g. Miina 1993). Standard deviation of the year effects was employed when 95% confidence intervals for the average annual yields were calculated.
3 Results
3.1 Model for the percentage coverage of cowberry
The model developed for the abundance of cowberry indicates that the highest coverage can be found on sub-xeric heath forests (i.e. the reference in Model 1; see Table 3). On mineral soils, the coverage of cowberry on xeric heath forests (V) and mesic heath forests (III) was approximately 66% of that on site IV (see Odds ratios, Table 3). On fertile mineral soil sites (sites I and II), the coverage was scarce. If the stand had been afforested (i.e. former agricultural land), the coverage was lower than at other stands.
Oligotrophic spruce mires (site IV) did not differ significantly from sub-xeric heath forests with respect to the abundance of cowberry (Table 3). On spruce mires, the coverage decreased along with the increase in site fertility. On pine mires, site IV was most advantageous in regard to the high coverage of cowberry but, however, not as advantageous as the corresponding site fertility level on mineral soils and spruce mires. The other sites on pine mires reached, on average, only 16–17% of the coverage of the reference in Model 1 (Table 3). In fell forests (i.e. site VIII, poorly productive land), the coverage was approximately one fifth of that of the reference in Model 1, but in fell tops (i.e. site VIII, waste land) it was very marginal.
| Table 3. The multi-level binomial model (Model 1) estimated for the mean percentage coverage of cowberry on the 2-m2 quadrates in the stands of the PSP3000 data. Sites I-V and VII-VIII refer to different site quality classes (see Table 1). Mineral soils, spruce mires and pine mires pertain to forest land (i.e. categories a-e of this study). | |||||
| Variable | Estimate | Std error | t-value | Odds ratio | p-value |
| Intercept | –4.7902 | 0.4571 | –10.48 | 0.008 | <0.001 |
| Site (ref. IV, mineral soils) a) | |||||
| site I, mineral soils | –5.1730 | 0.2410 | –21.47 | 0.006 | <0.001 |
| site II, mineral soils | –2.5690 | 0.1396 | –18.40 | 0.077 | <0.001 |
| site III, mineral soils | –0.4216 | 0.0687 | –6.13 | 0.656 | <0.001 |
| site V, mineral soils | –0.4185 | 0.1403 | –2.98 | 0.658 | 0.003 |
| sites I-II, spruce mires | –2.0679 | 0.1567 | –13.20 | 0.126 | <0.001 |
| site III, spruce mires | –0.7984 | 0.1179 | –6.77 | 0.450 | <0.001 |
| sites I-III, pine mires | –1.8198 | 0.1543 | –11.79 | 0.162 | <0.001 |
| site IV, pine mires | –0.5644 | 0.0959 | –5.88 | 0.569 | <0.001 |
| site V, pine mires | –1.7620 | 0.1121 | –15.72 | 0.172 | <0.001 |
| site VIII, poorly productive land | –1.4831 | 0.2776 | –5.34 | 0.227 | <0.001 |
| site VIII, waste land | –2.9819 | 0.333 | –8.95 | 0.051 | <0.001 |
| FormerAgrLand b), mineral soils | –0.9438 | 0.1993 | –4.73 | 0.389 | <0.001 |
| Spruce c) on sites I-III, mineral soils and spruce mires | –0.4327 | 0.0663 | –6.52 | 0.649 | <0.001 |
| Deciduous trees c) on sites I-III, mineral soils and spruce mires | –0.7528 | 0.1009 | –7.46 | 0.471 | <0.001 |
| 1000/Temperature sum (dd) | 2.5592 | 0.5561 | 4.60 | 12.925 | <0.001 |
| Altitude (m) | –0.0039 | 0.0008 | –4.62 | 0.996 | <0.001 |
| Stand age (a) on sites I-II, mineral soils | 0.0106 | 0.0019 | 5.65 | 1.011 | <0.001 |
| Stand basal area (m2ha–1), forest land d) | 0.0157 | 0.0025 | 6.19 | 1.016 | <0.001 |
| Variance components at e) | |||||
| forestry centre region level | 0.1211 | (14) | |||
| municipality level | 0.1839 | (367) | |||
| cluster level | 0.1819 | (983) | |||
| sample plot level | 0.2148 | (2515) | |||
| stand level (“pseudo” level) | 0.9463 | (2801) | |||
| a) The parameter estimates of site variables “site VII, mineral soils” and “site IV, spruce mires” were not statistically significant. b) FormerAgrLand (former agricultural land) is an indicator variable for stand history (ref. forest). c) An indicator variable for the dominant tree species (the reference is other tree species). d) In this context, forest land refers to categories (a)–(e) of this study. e) The number of observations at each level is given in parentheses. A random term at “pseudo” level accounts for the overdispersion. | |||||
On mineral soils and spruce mires, the dominant tree species was a significant predictor of the abundance of cowberry. However, the decreasing effect of deciduous trees and spruce (compared with pine) was not found on all sites, but only on sites I-III (Table 3). Similarly, a slight positive effect of stand age on the coverage was found only on the most fertile mineral soil sites (I and II). The stand basal area affected positively the coverage of cowberry on mineral soils, spruce mires and pine mires.
Both the temperature sum and altitude were significant predictors of the abundance of cowberry in the case of all categories (a)–(g) (Table 3). Although these two variables correlated strongly with each other in the modelling data (the correlation was –0.776), it was decided to include both of them in Model 1 as they describe large-scale geographical variation in the coverage of cowberry in Finland. On average, the coverage seems to be higher in northern Finland than in southern Finland (see also Fig. 2).
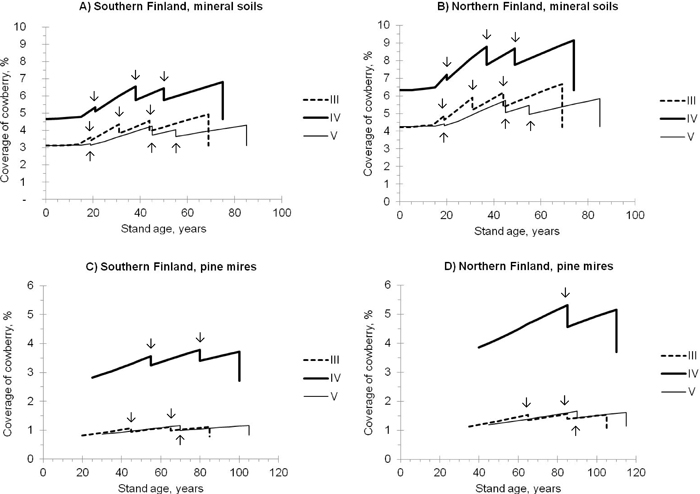
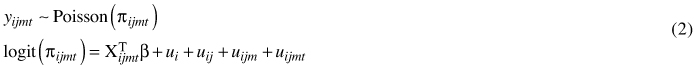
Fig. 2. Predicted coverage of cowberry in pine stands of different site fertilities (i.e. sites III-V; see the definitions in Table 1). The development of stands, representing mineral soils (A, B) and pine mires (C, D) in southern (A, C) and northern (B, D) Finland, was simulated using the Motti simulator (arrows indicate thinnings). Predictions were calculated using Model 1 (Table 3).
Most of the unexplained variation (57%) of Model 1 was found at the stand level (Table 3). The sample plot-, cluster- and municipality-level residual variations accounted for almost an equal proportion (11–13%) of the total variation. The rest of the variation (7%) was due to the forestry centre region-level variation.
3.2 Model for cowberry yield
In Model 2, the site fertility was not a significant predictor for the number of cowberries (Table 4). Instead, the stand basal area was found to have a negative effect on cowberry yield. It was also found that the number of berries increased when the coverage of cowberry increased up to a coverage of 58%, after which the berry yield decreased.
| Table 4. The multi-level Poisson model (Model 2) estimated for the mean number of cowberries on five 1-m2 quadrates in pine-dominated stands of the MASI data, measured in 2001–2012. Sites III-V refer to different site quality classes of mineral soil forests (see Table 2). | ||||
| Variable | Estimate | Std error | t-value | p-value |
| Intercept | 6.5404 | 1.0099 | 6.48 | <0.001 |
| Year effect (ref. 2012) | ||||
| 2001 | 0.6276 | 0.3083 | 2.04 | 0.044 |
| 2002 | 0.1742 | 0.3011 | 0.58 | 0.564 |
| 2003 | 0.3927 | 0.3118 | 1.26 | 0.210 |
| 2004 | 0.1290 | 0.2941 | 0.44 | 0.662 |
| 2005 | 1.0525 | 0.2960 | 3.56 | 0.001 |
| 2006 | 0.4146 | 0.2919 | 1.42 | 0.158 |
| 2007 | 0.1529 | 0.2700 | 0.57 | 0.572 |
| 2008 | –0.2921 | 0.2682 | –1.09 | 0.278 |
| 2009 | –0.3474 | 0.2710 | –1.28 | 0.202 |
| 2010 | –0.2773 | 0.2698 | –1.03 | 0.306 |
| 2011 | 0.1925 | 0.2714 | 0.71 | 0.479 |
| Coverage of cowberry (%) | 0.0966 | 0.0208 | 4.64 | 0.010 |
| Coverage of cowberry2/100 (%) | –0.0837 | 0.0217 | –3.86 | 0.018 |
| Ln (Stand basal area + 1) (m2ha–1) | –0.4716 | 0.0993 | –4.75 | 0.009 |
| Altitude (m) | 0.0071 | 0.0023 | 3.06 | 0.009 |
| 1000/Temperature sum (dd) | –4.6264 | 1.0758 | –4.30 | 0.001 |
| Variance components at a) | ||||
| forestry centre region level | 0.2270 | (12) | ||
| municipality level | 0.0904 | (27) | ||
| stand level | <0.0001 | (34) | ||
| stand x year level (“pseudo” level) | 0.5024 | (193) | ||
| a) The number of observations at each level is given in parentheses. A random term at “pseudo” level accounts for the overdispersion. | ||||
The temperature sum and altitude were significant predictors in Model 2 (Table 4). This was the case also in Model 1 (Table 3), but the effects of these two predictors were opposite in the two models. Model 2 suggests that cowberry yields are, on average, higher in southern Finland than in northern Finland (see also Fig. 3). In this context, it is worth noting that the number of stands was relatively low in the MASI data. In addition, the stands were not evenly distributed in the country (Fig. 1), which resulted in a high proportion of the unexplained variation at the forestry centre region level. Therefore, the results of this study concerning the effects of temperature sum and altitude on cowberry production can be regarded as quite tentative in nature.
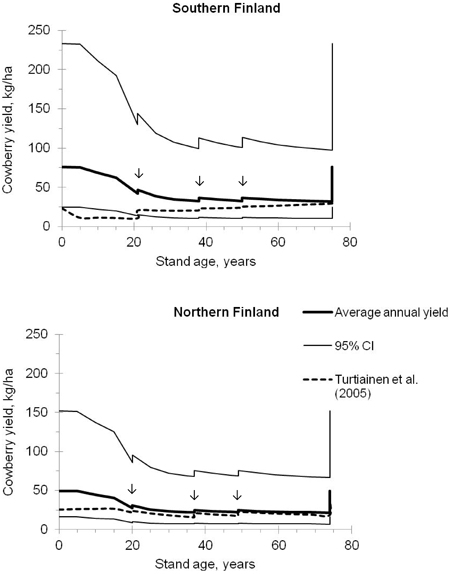
Fig. 3. Predicted average annual yields of cowberry and their 95% confidence intervals in pine stands on site IV (i.e. sub-xeric heath forest) in southern and northern Finland. The development of stands was simulated using the Motti simulator (arrows indicate thinnings). Predictions were calculated using Models 1 and 2 (Tables 3 and 4), and were also compared with the estimates computed using the models of Turtiainen et al. (2005).
In Model 2, the last year of the study period 2001–2012 was selected as the reference year (Table 4). The sample mean of the fixed year effects of Model 2 was 0.1849. Thus, the number of cowberries was lower than average in 2002, 2004, 2007–2010 and 2012 and higher than average in 2001, 2003, 2005, 2006 and 2011 (Table 4). The variance of the year effects of Model 2 was 0.3298.
3.3 Simulation results
In the simulated pine stands, the predicted coverage of cowberry followed the development of the stand basal area and age on both mineral soil sites and pine mires (Fig. 2). The coverage increased with increasing stand age and basal area, and was temporarily affected by thinnings. The regeneration felling decreased the coverage to the same level that it was in initial conditions. The superiority of site fertility class IV over other site fertilities, in regard to the abundance of cowberry, was evident on both mineral soil sites and pine mires. On average, the coverage was higher on mineral soils than on pine mires.
The predicted average annual yield of cowberry was the highest in seed-tree stands and in small seedling stands (Fig. 3). In a seed-tree stand located in southern Finland, the annual cowberry yield reached about 75 kg ha–1, with the 95% confidence interval of 25–234 kg ha–1. In northern Finland, the corresponding estimates were about 50 kg ha–1 and 16–152 kg ha–1, respectively. Between the stand ages of approximately 5 and 30 years, the crop level decreased quite strongly with increasing stand basal area, after which it was relatively constant and increased only temporarily after thinnings.
The predicted yields of cowberry were also compared with yield predictions computed using the regional berry yield models of Ihalainen et al. (2005) and the correction factors presented by Turtiainen et al. (2005). From now on in this paper, when talking briefly about models of Turtiainen et al. (2005), in fact the models of Ihalainen et al. (2005) which were calibrated by Turtiainen et al. (2005) are meant. In a pine stand located in northern Finland (Kainuu), the patterns of the predicted cowberry yields corresponded closely with each other, except at the beginning of the rotation (Fig. 3). In southern Finland (Southwest Finland), however, the predictions produced by the models of this study differed considerably from those computed using the model of Turtiainen et al. (2005). Fig. 3 indicates that the yield estimates followed the development of the stand age in a different way and, in addition, the difference between the yield predictions was high (even 60 kg ha–1 at the stand age of five years).
4 Discussion
This study was the first occasion on which a prediction model for the coverage of cowberry was developed in Finland. It was also the first attempt to create an empirical cowberry yield model for the whole country. Earlier empirical cowberry yield models concern particularly eastern and central Finland (Pukkala 1998; Ihalainen et al. 2003).
In this study, the modelling approach that was earlier applied by Miina et al. (2009) was utilized. Miina et al. (2009) used three different datasets in order to develop three separate models for the coverage and yields of bilberry. The first dataset was collected on the sample plots of the NFI (cf. PSP3000 data used in this study). The second dataset was collected on the permanent sample plots in different parts of Finland (i.e. MASI data). At the time when Miina et al. (2009) prepared their study, only a limited number of stand characteristics were recorded in MASI stands (see Chapter 2.2). Thus, MASI data could be utilized only for modelling the annual variation in the bilberry yields, and one more dataset was needed to obtain a linkage between the abundance and berry yield. This dataset was collected in North Karelia in a single year and, consequently, the yield model of Miina et al. (2009) was regional. Miina et al. (2009) made suggestions to improve the MASI field inventory so that more measurements could be made in MASI stands. These suggestions have been considered since 2009 (see Chapter 2.2). This improvement made it possible, in the present study, for both the average annual yield of cowberry and the 95% confidence interval for the between-year variation in the yield to be included in one national yield model (Model 2, Table 4).
Despite the improvement mentioned above, the MASI data (Table 2) still contained some features and limitations which should be considered when applying the yield model of this study. First, all of the study stands were pine-dominated and most of them represented sub-xeric heath forests (site IV). This means that the effect of tree species on cowberry production could not be predicted and, consequently, Model 2 should be applied only in pine-dominated stands, representing preferably sub-xeric (=dryish) heath forests. Second, the yields in the MASI data are higher than the average due to the sampling method (see also Miina et al. 2009). If a random or systematic sampling had been used, there would also have been a number of sample plots with no berry plants or only a few berry plants (see e.g. Ihalainen et al. 2003) and, consequently, the measured yields would have been lower. Thus, it is quite obvious that the yield model of this study (Model 2) produces, on average, higher predictions than the previous yield models which also provide estimates in terms of kilograms per hectare (Pukkala 1998; Ihalainen et al. 2003; Turtiainen et al. 2005) (see also Fig. 3). Third, the stands did not cover the country uniformly (Fig. 1). Though the coverage was predicted to be higher in the north than in the south (Fig. 2), Model 2 and also Fig. 3 suggest that the yields of cowberry are, on average, higher in southern Finland than in northern Finland. Empirical yield studies conducted so far in different parts of Finland do not support this result (Turtiainen et al. 2005, p. 23). In fact, the average cowberry yield on site IV seems to be a bit higher in Kainuu and Lapland compared with other parts of the country (Turtiainen et al. 2005, p. 23). Thus, there is a need for a more comprehensive network of MASI stands (i.e. more MASI stands established uniformly across the country) so that the large-scale geographical variation in cowberry yields, reflected by the temperature sum and altitude, can be determined more reliably.
The coverage of cowberry was predicted using an extensive dataset (Table 1). This made it possible to develop a national model for the coverage of cowberry (i.e. Model 1, Table 3), a model which considers both mineral soil sites (category a) and also many other sites where cowberry occurs in the field layer (categories b-g). According to Model 1, the highest coverage of cowberry could be found on site IV. This was the case on mineral soils, pine mires and spruce mires. This finding is in line with many earlier studies (e.g. Eriksson et al. 1979; Raatikainen et al. 1984; Salemaa 2000; Tonteri et al. 2005), even though it is worth noting that most empirical studies on wild forest berries (including cowberry) concern primarily mineral soils and only to a smaller extent peatlands (see e.g. Turtiainen et al. 2007). In addition, tree species composition had a significant effect on the abundance of cowberry. On mineral soils and spruce mires, the coverage of cowberry was higher in pine-dominated stands than in stands dominated by spruce or deciduous trees; a well-known result supported, e.g., by Eriksson et al. (1979), Kardell and Carlsson (1982), Tonteri et al. (2005) and Hedwall et al. (2013). In this study, the priority of pine over other tree species was significant only on sites I-III. This was not a surprise since stands representing site fertilities IV and V were mainly pine-dominated in the modelling data and this is the case also in general in the Finnish forests (e.g. Tomppo et al. 2011).
The prevalence of cowberries predicted by Model 1 varied quite moderately during the stand rotation. The coverage increased with the stand age and basal area, and decreased temporarily after thinnings. The coverage of cowberry was the highest in mature stands on both mineral soil sites and peatland sites. These results are very similar to many earlier research results (e.g. Eriksson et al. 1979; Raatikainen et al. 1984; Salemaa 2000; Tonteri et al. 2005). In Sweden, the effects of different silvicultural measures on the occurrence and production of cowberry and bilberry were studied on permanent sample plots in 1976–1986 (Kardell and Eriksson 1990). It was found that, during the first decade after clear-cutting, the coverage of cowberry was approximately 30% lower than the situation before the final felling. If clear-cutting was followed by soil preparation, the average decrease in the abundance during the same period was 40%. For comparison, the corresponding figures for bilberry were 70% and 80%. In this study, different silvicultural measures (e.g. soil preparation) were not taken into account in the modelling by their own dummy variables. However, it is obvious that cowberry suffers from final fellings and subsequent soil preparation considerably less than bilberry (see also e.g. Bråkenhielm and Liu 1998; Salemaa 2000). There are at least two potential explanations for this. First, as a light plant, cowberry adapts well to conditions of intensive illumination in felling areas. Second, cowberry populations seem to have an ability to recover even from serious disturbances within a few years (e.g. Raatikainen et al. 1984; Tolvanen 1994, 1995). However, like bilberry, cowberry also suffers from the competition from grasses at the beginning of stand rotation (e.g. Ferm and Sepponen 1981; Salo 1995).
Model 1 produced, on average, higher predictions for stands located in northern Finland compared with stands in southern Finland. This finding is supported in Finland by Salemaa (2000). A similar observation has been made also for Sweden (Eriksson et al. 1979), although one should keep in mind that the findings from Finland and Sweden may not be directly comparable due to differences in natural conditions between the countries (e.g. Salo 1995, p. 124). Further, Model 1 indicated that the coverage of cowberry is quite low in fell forests (compared with the reference in Model 1) and very marginal in fell tops. According to Hämet-Ahti (1963), the mean coverage of cowberry is approximately 3–5% in the timberline birch woodland zone in Northern Fennoscandia (continental subalpine subzone). It is worth noting that, although the coverage of cowberry bushes is low in fells, one can still have good crops in these areas. Lohiniva and Saastamoinen (1989) studied yields of the most common wild berries in the northernmost Lapland in two consecutive years, 1987–1988. They established sample squares on sites which were known to be used for berry picking. In the case of cowberry, the sample squares were established in both mineral soil forests (cf. category (a) of this study) and fell forests (cf. category (f)). It was concluded that cowberry yields typically remain smaller in fell forests than in mineral soil forests but in some years (as in 1987) these two categories may be equally good with respect to cowberry production (Lohiniva and Saastamoinen 1989).
The site fertility was not a significant predictor in the cowberry yield model (Model 2). A reason for this may be the low number of stands representing mesic (III) and xeric (V) heath forests (Table 2). In general, the highest cowberry yields can be found on poor mineral soil sites (sites IV and V) (e.g. Raatikainen 1978; Raatikainen et al. 1984; Belonogova and Zajceva 1989). The results of this study concerning the relationship between the stage of stand development and cowberry production were partly well in line with earlier research results and partly quite contradictory when compared with earlier findings. Model 2 suggested that the beginning of stand rotation (openings, seed-tree stands and small seedling and sapling stands) was most advantageous with respect to high cowberry crops. Further, the period of intensive berry production was limited by the formation of young stands (see also Fig. 3). These findings are supported, e.g., by Jaakkola (1983), Raatikainen et al. (1984), Belonogova and Zajceva (1989) and Belonogova (1993). Thus, although the proportion of fertile berry plants is often low in felling areas, cowberries flower abundantly and can produce high yields in these areas (Belonogova 1993). Model 2 also suggested that cowberry production in mature stands was approximately of the same level as in young and advanced thinning stands. According to previous empirical studies, sparse mature stands are more suitable for cowberry collection than young and advanced thinning stands (e.g. Eriksson et al. 1979; Raatikainen et al. 1984; Jäppinen et al. 1986; Ihalainen et al. 2003). As an exception, it was found that the regional cowberry yield model for Kainuu (Ihalainen et al. 2005; Turtiainen et al. 2005; see also Fig. 3) did not differ from Model 2 in this respect. In spite of this exception, it seems that Model 2 produces underestimates at the end of stand rotation, particularly when calculated for sparse mature stands. In dense mature stands, instead, it is obvious that cowberry yields remain low (e.g. Belonogova 1993).
In this context, it may be worth noting that terms “sparse” and “dense” forest stands indicate different things in different studies. In the study of Ihalainen et al. (2005), for example, a stand was regarded as dense if it was recommended to be thinned according to the thinning model (see Luonnonläheinen metsänhoito… 1994). A sparse stand was thinned so that the stand basal area of the remaining growing stock was according to the thinning model on the lowest possible level (see Luonnonläheinen metsänhoito… 1994). Raatikainen et al. (1984) found that cowberry produced the highest crops when the crown cover of trees was 1–40%. They also found that when the crown cover exceeded 40%, the cowberry production started to decrease.
In this study, it was possible to employ only traditional stand attributes, such as stand basal area and stand age, which usually have originated from field work of stand level management inventory. As cowberry is favoured by (direct and indirect) solar radiation it may be questioned whether these traditional variables reflect relevant conditions adequately enough. However, in Finland these stand attributes are nowadays obtained as a result of airborne laser scanning (ALS) based stand level inventory (Maltamo et al. 2011). One of the most applied ALS metrics as independent variable in the stand attribute models is the proportion of vegetation echoes which means the proportion of ALS echoes above a certain height limit, e.g. 2 meters (e.g. Næsset 2002). This metric can be directly used as a highly accurate estimate for canopy cover without any field reference (see e.g. Korhonen et al. 2011).
Since ALS data already covers considerable parts of Finland it would be interesting to utilize the proportion of vegetation echoes as well as other ALS metrics also in berry yield modelling studies. Different laser scanner settings, differences between laser scanner individuals and the effect of data acquisition time (leaf on – leaf off) have some effect on the derived ALS metrics which will complicate the use of these metrics in the large scale berry yield modelling studies including several ALS inventory areas. However, it has been shown that the proportion of vegetation echoes, calculated from the ALS first pulse echoes is still rather robust metric between different ALS campaigns (Korhonen et al. 2011).
The modelling approach and datasets used in this study made it possible to consider the species coverage as a predictor in the yield model. This has not been possible in previous cowberry yield models developed for forest planning purposes, although it is quite obvious that there exists dependence between the abundance of cowberry and its yield (e.g. Raatikainen et al. 1984). Model 2 indicated that the higher the coverage, the higher the number of berries; this was the situation up to a certain limit (58%), after which the effect of increasing coverage was negative. For comparison, Raatikainen et al. (1984) found a strong positive correlation between the cowberry coverage and yield. The result of this study, however, seems to be more logical since, although cowberry occurs frequently in mature stands, a considerable proportion of cowberry plants grow as sterile under the canopy layer of mature trees (e.g. Vuokko 2005).
The annual variation in cowberry yields was high (Table 4, Fig. 3). Also, the annual variation in bilberry yields based on the MASI data was at the same level (Miina et al. 2009). It is probable that in the MASI data temporal variations in the yields are also higher than the average due to the sampling method. For comparison, a Russian study which was conducted on permanent sample plots placed on sites that were advantageous with respect to cowberry production found that annual yields varied greatly (43–468 kg ha–1) during the study period of 1964–1977 (Kolupaeva 1980). When one applies the yield model of this study, it is recommended to consider also the between-year variation in yield predictions (cf. Miina et al. 2010; Pukkala et al. 2011). If only average annual yields are calculated using Model 2, the results may not be completely realistic. For example, they omit the fact that there are years when the crop fails also on sites that are usually advantageous for berry picking.
The models were developed for use on multi-objective forest planning primarily in commercially managed forests (cf. modelling datasets). They can also be included in stand simulators for silvicultural and forest planning purposes. Recently Miina et al. (2010) studied the effect of bilberry production on the optimal stand management by including the models of Miina et al. (2009) in a stand growth simulator and maximizing the joint production of timber and bilberries. Similarly, Models 1 and 2 could be used to integrate the value of cowberry production in the optimization calculations. Optimizing the joint production of timber, bilberries and cowberries would most probably lead to different results from those presented by Miina et al. (2010), since bilberry and cowberry differ from each other in many ways, particularly with respect to the need for light (e.g. Raatikainen et al. 1984; Hotanen et al. 2000). Finally, the models provide the possibility of giving stand management prescriptions that enhance cowberry yields (cf. Parlane et al. 2006). For example, it seems obvious that cowberry production increases after thinning (see e.g. Fig. 3). However, it is recommended that this kind of prescription should be based not only on the results of this study but also on previous cowberry yield models (especially empirical models) as well as empirical studies made so far, because of the special features related to Model 2.
Acknowledgements
This study was supported by the Alfred Kordelin Foundation and Niemi Foundation, and also by the strategic funding of the University of Eastern Finland (UEF) as a WP 4.3 of CABI-project. We wish to thank Prof. Matti Maltamo (School of Forest Sciences, UEF) for his valuable comments on the manuscript.
References
Belonogova T. (1993). Changes in bilberry and cowberry yields under the influence of forestry measures. Aquilo Series Botanica 31: 17–20.
Belonogova T., Zajceva N.L. (1989). Ekologo-biologičeskie osobennosti hozjajstvenno cennyh rastenij Karelii. [Ecological and biological features of the economically significant plants in Karelia]. Petrozavodsk. 168 p. [In Russian].
Bråkenhielm S., Liu Q. (1998). Long-term effects of clear-felling on vegetation dynamics and species diversity in a boreal pine forest. Biodiversity and Conservation 7: 207–220. http://dx.doi.org/10.1023/A:1008836502640.
Browne W.J., Subramanian S.V., Jones K., Goldstein H. (2005). Variance partitioning in multilevel logistic models that exhibit overdispersion. Journal of Royal Statistical Society A, 168: 599–613. http://dx.doi.org/10.1111/j.1467-985X.2004.00365.x.
Eriksson L., Ingelög T., Kardell L. (1979). Bilberry, lingonberry, raspberry. Occurrence and production in Sweden 1974–1977. Sveriges lantbruksuniversitet, Avdelning för landskapsvård, Rapport 16. 124 p. [In Swedish with English summary].
FAO. (2010). Global forest resources assessment 2010. Main report. FAO Forestry Paper 163. http://www.fao.org/docrep/013/i1757e/i1757e.pdf. [Cited 27 August 2013].
Ferm A., Sepponen P. (1981). Development of ploughed tracks and vegetation on reforestation areas in Finnish Lapland during a period of 10 years. Folia Forestalia 493. 19 p. [In Finnish with English summary].
Finnish Statistical Yearbook of Forestry. (2000). Finnish Forest Research Institute. Gummerus Kirjapaino Oy, Jyväskylä. 366 p. [In Finnish with English summary].
Finnish Statistical Yearbook of Forestry. (2012). Finnish Forest Research Institute. Vammalan Kirjapaino Oy, Sastamala. http://www.metla.fi/metinfo/tilasto/julkaisut/vsk/2012/. [Cited 27 August 2013].
Goldstein H. (2003). Multilevel statistical models. Kendall's Library of Statistics 3. 3rd edition. Arnold, London. 256 p.
Grjaz'kin A.V., Kondratenko N.N., Pona D.S. (2006). Nedrevesnaja produkcija lesa. [Non-wood forest products]. Izdatel'stvo Politehničeskogo universiteta. Sankt-Peterburg. 338 p. [In Russian].
Hämet-Ahti L. (1963). Zonation of the mountain birch forests in northernmost Fennoscandia. Annales Botanici Societatis 'Vanamo' 34(4). 127 p.
Hedwall P-O., Brunet J., Nordin A., Bergh J. (2013). Changes in the abundance of keystone forest floor species in response to changes of forest structure. Journal of Vegetation Science 24: 296–306. http://dx.doi.org/10.1111/j.1654-1103.2012.01457.x.
Heikkinen J., Reinikainen A. (2000). Inventointiaineistot ja tulosten laskenta. [Inventory data and calculation of the results]. In: Reinikainen A., Mäkipää R., Vanha-Majamaa I., Hotanen J-P. (eds.). Kasvit muuttuvassa metsäluonnossa. [Effects of the changes in land use and forest management on vegetation]. Tammi, Helsinki. p. 44–59. [In Finnish].
Hotanen J-P., Korpela L., Mikkola K., Mäkipää R., Nousiainen H., Reinikainen A., Salemaa M., Silfverberg K., Tamminen M., Tonteri T., Vanha-Majamaa I. (2000). Metsä- ja suokasvien yleisyys ja runsaus 1951–95. [Frequency and abundance of forest and mire plants in Finland in 1951–95]. In: Reinikainen A., Mäkipää R., Vanha-Majamaa I., Hotanen J-P. (eds.). Kasvit muuttuvassa metsäluonnossa. [Effects of the changes in land use and forest management on vegetation]. Tammi, Helsinki. p. 84–301. [In Finnish].
Hynynen J., Ahtikoski A., Siitonen J., Sievänen R., Liski J. (2005). Applying the MOTTI simulator to analyse the effects of alternative management schedules on timber and non-timber production. Forest Ecology and Management 207: 5–18. http://dx.doi.org/10.1016/j.foreco.2004.10.015.
Hyvän metsänhoidon suositukset. [Silvicultural recommendations for appropriate forest management]. (2006). Metsätalouden kehittämiskeskus Tapio. Metsäkustannus Oy, Helsinki. 100 p. [In Finnish].
Ihalainen M., Pukkala T. (2001). Modelling cowberry (Vaccinium vitis-idaea) and bilberry (Vaccinium myrtillus) yields from mineral soils and peatlands on the basis of visual field estimates. Silva Fennica 35(3): 329–340.
Ihalainen M., Alho J., Kolehmainen O., Pukkala T. (2002). Expert models for bilberry and cowberry yields in Finnish forests. Forest Ecology and Management 157: 15–22. http://dx.doi.org/10.1016/S0378-1127(00)00653-8.
Ihalainen M., Salo K., Pukkala T. (2003). Empirical prediction models for Vaccinium myrtillus and V. vitis-idaea berry yields in North Karelia, Finland. Silva Fennica 37(1): 95–108.
Ihalainen M., Pukkala T., Saastamoinen O. (2005). Regional expert models for bilberry and cowberry yields in Finland. Boreal Environment Research 10: 145–158.
Jaakkola I. (1983). Rovaniemen maalaiskunnan marjasatoinventointi. [Berry yield inventory in the Rovaniemi rural municipality]. Metsäntutkimuslaitoksen tiedonantoja 105: 137–143. [In Finnish].
Jäppinen J-P., Hotanen J-P., Salo K. (1986). Yields of wild berries and larger fungi and their relationship to stand characteristics on MT and VT-type mineral soil sites in Ilomantsi, eastern Finland, 1982–1984. Folia Forestalia 670. 25 p. [In Finnish with English summary].
Kangas J. (1998). Non-wood forest goods and benefits and the choice of forest management practices. In: Lund H.G., Pajari B., Korhonen M. (eds.). Sustainable development of non-wood goods and benefits from boreal and cold temperate forests. EFI Proceedings 23. p. 203–210.
Kardell L., Carlsson E. (1982). Cloudberry, cranberry, lingonberry. Occurrence and production in Sweden 1978–1980. Sveriges lantbruksuniversitet, Avdelning för landskapsvård, Rapport 25. 139 p. [In Swedish with English summary].
Kardell L., Eriksson L. (1990). Skogsskötselmetodernas inverkan på blåbär och lingon: resultat av en tioårig försöksserie. [Effect of silvicultural measures on bilberries and cowberries: results of ten-year investigations]. Sveriges lantbruksuniversitet, Institutionen för skoglig landskapsvård. Rapport 47. 113 p. [In Swedish].
Karppinen H., Hänninen H., Ripatti P. (2002). Suomalainen metsänomistaja 2000. [Finnish forest owner 2000]. Metsäntutkimuslaitoksen tiedonantoja 852. 83 p. [In Finnish].
Kolupaeva K.G. (1980). Dinamika urožajnosti lesnyh jagodnyh i plodovyh rastenij Kirovskoj oblasti. [Dynamics of the yields of forest berry plants in the Kirov region]. Rastitel'nye Resursy 14(1): 139–145. [In Russian].
Korhonen L., Korpela I., Heiskanen J., Maltamo M. (2011). Airborne discrete-return LIDAR data in the estimation of vertical canopy cover, angular canopy closure and leaf area index. Remote Sensing of Environment 115: 1065–1080. http://dx.doi.org/10.1016/j.rse.2010.12.011.
Kuchko A.A. (1988). Bilberry and cowberry yields and the factors controlling them in the forests of Karelia, USSR. Acta Botanica Fennica 136: 23–25.
Laine J., Vasander H., Laiho R. (1995). Long-term effects of water level drawdown on the vegetation of drained pine mires in southern Finland. Journal of Applied Ecology 32: 785–802. http://dx.doi.org/10.2307/2404818.
Lakka J., Kouki J. (2009). Patterns of field layer invertebrates in successional stages of managed boreal forest: implications for the declining Capercaillie Tetrao urogallus L. population. Forest Ecology and Management 257: 600–607. http://dx.doi.org/10.1016/j.foreco.2008.09.042.
Landolt E. (1996). Vaccinium vitis-idaea L. subsp. minus (G. Lodd.) Hultén (Ericaceae), an overlooked circumpolar-arctic taxon of the Alps. Anales Jardín Botánico de Madrid 54: 277–284.
Lohiniva S., Saastamoinen O. (1989). Pohjois-Lapin kuntien marjasatoinventointi. Hillan, mustikan ja puolukan keskimääräiset hehtaarisadot ja kokonaissatoarvio Enontekiön, Utsjoen ja Inarin kunnissa vuosina 1987 ja 1988. [Berry yield inventory in the municipalities of northern Lapland. Cloudberry, bilberry and cowberry yield estimates in the Enontekiö, Utsjoki and Inari municipalities in 1987 and 1988]. In: Kujala M., Malin A., Saastamoinen O., Lohiniva S., Niva A. (eds.). Pohjois-Lapin kuntien metsämarja- ja sienitutkimus vuosina 1987–1988 (Pohla-projekti). [Research concerning wild forest berries and mushrooms in the municipalities of northern Lapland in 1987–1988]. Pellervo-Seuran Markkinatutkimuslaitos, Raportteja ja artikkeleita 26. p. 73–101. [In Finnish].
Luonnonläheinen metsänhoito: metsänhoitosuositukset. [Natural forest management: forest management practise recommendations]. (1994). Metsäkeskus Tapion julkaisu 6. Helsinki. 72 p. [In Finnish].
Maltamo M. (2006). Inventories of vegetation, wild berries and mushrooms. In: Kangas A., Maltamo M. (eds.). Forest inventory – methodology and applications. Springer, Dordrecht. p. 141–153. http://dx.doi.org/10.1007/1-4020-4381-3_9.
Maltamo M., Packalén P., Kallio E., Kangas J., Uuttera J., Heikkilä J. (2011). Airborne laser scanning based stand level management inventory in Finland. In: Proceedings of SilviLaser 2011, October 16–20, 2011, Hobart, Australia. http://lidar.com.es/2012/02/16/documentos-proceedings-de-la-conferencia-silvilaser-2011/. [Cited 5 September 2013].
McCullagh P., Neldel J.A. (1989). Generalized linear models. 2nd edition. Chapman and Hall, London–New York. 511 p.
Miina J. (1993). Residual variation in diameter growth in a stand of Scots pine and Norway spruce. Forest Ecology and Management 58: 111–128. http://dx.doi.org/10.1016/0378-1127(93)90134-9.
Miina J., Hotanen J-P., Salo K. (2009). Modelling the abundance and temporal variation in the production of bilberry (Vaccinium myrtillus L.) in Finnish mineral soil forests. Silva Fennica 43(4): 577–593.
Miina J., Pukkala T., Hotanen J-P., Salo K. (2010). Optimizing the joint production of timber and bilberries. Forest Ecology and Management 259: 2065–2071. http://dx.doi.org/10.1016/j.foreco.2010.02.017.
Muhonen T. (1995). Mustikka- ja puolukkasatojen ennustaminen kasvupaikka- ja puustotunnusten avulla – asiantuntemukseen perustuva lähestymistapa. [Prediction of bilberry and cowberry yields using site and growing stock characteristics – an approach based on expertise]. Master's thesis of forest planning and economics. Faculty of Forestry, University of Joensuu. 37 p. [In Finnish].
Næsset E. (2002). Predicting forest stand characteristics with airborne scanning laser using a practical two-stage procedure and field data. Remote Sensing of Environment 80: 88–99. http://dx.doi.org/10.1016/S0034-4257(01)00290-5.
Ojansuu R., Henttonen H. (1983). Estimation of local values of monthly mean temperature, effective temperature sum and precipitation sum from the measurements made by the Finnish Meteorological Office. Silva Fennica 17: 143–160. [In Finnish with English summary].
Parlane S., Summers R.W., Cowie N.R., van Gardingen P.R. (2006). Management proposals for bilberry in Scots pine woodland. Forest Ecology and Management 222: 272–278. http://dx.doi.org/10.1016/j.foreco.2005.10.032.
Pukkala T. (1998). Metsäsuunnitteluohjelma Monsu: ohjelmiston toiminta ja käyttö. [User's guide of the Monsu forest planning program]. University of Joensuu, Joensuu. 66 p. [In Finnish].
Pukkala T., Lähde E., Laiho O., Salo K., Hotanen J-P. (2011). A multifunctional comparison of even-aged and uneven-aged forest management in a boreal region. Canadian Journal of Forest Research 41: 851–862. http://dx.doi.org/10.1139/x11-009.
Pysyvien koealojen 3. mittaus 1995 – maastotyön ohjeet. [Field instructions for the 3rd measurement of the permanent sample plots in 1995]. (1995). The Finnish Forest Research Institute, Helsinki. The National Forest Inventory. 104 p. + appendices. [In Finnish].
Raatikainen M. (1978). The berry yield, picking, and marketing of Vaccinium vitis-idaea L. in the commune of Pihtipudas. Silva Fennica 12(2): 126–139. [In Finnish with English summary].
Raatikainen M., Rossi E., Huovinen J., Koskela M-L., Niemelä M., Raatikainen T. (1984). The yields of the edible wild berries in central Finland. Silva Fennica 18(3): 199–219. [In Finnish with English summary].
R Development Core Team. (2012). R: A language and environment for statistical computing. R Foundation for Statistical Computing, Vienna, Austria. http://www.R-project.org/. [Cited 21 June 2012].
Ritchie J.C. (1955). Biological flora of the British Isles: Vaccinium vitis-idaea L. Journal of Ecology 43: 701–708. http://dx.doi.org/10.2307/2257030.
Salemaa M. (2000). Vaccinium vitis-idaea. Puolukka. In: Reinikainen A., Mäkipää R., Vanha-Majamaa I., Hotanen J-P. (eds.). Kasvit muuttuvassa metsäluonnossa. [Effects of the changes in land use and forest management on vegetation]. Tammi, Helsinki. p. 136–138. [In Finnish].
Salo K. (1995). Non-timber forest products and their utilization. In: Hytönen M. (ed.). Multiple-use forestry in the Nordic countries. The Finnish Forest Research Institute. p. 117–155.
Salo K. (1999). Principles and design of a prognosis system for an annual forecast of non-wood forest products. In: Niskanen A., Demidova N. (eds.). Research approaches to support non-wood forest products sector development: case of Arkhangelsk region, Russia. EFI Proceedings No. 29. p. 35–44.
Sarasto J. (1961). Über die Klassifierung der für Walderziehung entwässerten Moore. Acta Forestalia Fennica 74(5). 57 p.
Searle S.R., Casella G., McCulloch C.E. (1992). Variance components. Wiley, New York. 501 p. http://dx.doi.org/10.1002/9780470316856.
Snijders T., Bosker R. (1999). Multilevel analysis. An introduction to basic and advanced multilevel modeling. SAGE Publications, London. 266 p.
Tolvanen A. (1994). Differences in recovery between a deciduous and an evergreen ericaceous clonal dwarf shrub after simulated aboveground herbivory and belowground damage. Canadian Journal of Botany 72: 853–859. http://dx.doi.org/10.1139/b94-110.
Tolvanen A. (1995). Aboveground growth habits of two Vaccinium species in relation to habitat. Canadian Journal of Botany 73: 465–473. http://dx.doi.org/10.1139/b95-047.
Tomppo E., Heikkinen J., Henttonen H.M., Ihalainen A., Katila M., Mäkelä H., Tuomainen T., Vainikainen N. (2011). Designing and conducting a forest inventory – case: 9th National Forest Inventory of Finland. Managing Forest Ecosystems 21. 270 p. http://dx.doi.org/10.1007/978-94-007-1652-0.
Tonteri T., Hotanen J-P., Mäkipää R., Nousiainen H., Reinikainen A., Tamminen M. (2005). Metsäkasvit kasvupaikoillaan – kasvupaikkatyypin, kasvillisuusvyöhykkeen, puuston kehitysluokan ja puulajin yhteys kasvilajien runsaussuhteisiin. [Forest plant species in different sites – the effect of site type, vegetation zone, stand development class and tree species on the abundances of different plant species]. Metsäntutkimuslaitoksen tiedonantoja 946. 106 p. [In Finnish].
Turtiainen M., Salo K., Saastamoinen O. (2005). Satomalleilla lasketut Suomen kangasmetsien alueelliset ja valtakunnalliset mustikka- ja puolukkasadot. [Model-based estimates of regional and national bilberry and lingonberry yields on mineral soils in Finland]. University of Joensuu, Faculty of Forestry. Research Notes 167. 44 p. [In Finnish].
Turtiainen M., Salo K., Saastamoinen O. (2007). National and regional estimates of blueberry (Vaccinium myrtillus L.) and lingonberry (V. vitis-idaea L.) yields on peatlands in Finland. Suo 58(3–4): 87–98. [In Finnish with English summary].
Turtiainen M., Salo K., Saastamoinen O. (2011). Variations of yield and utilisation of bilberries (Vaccinium myrtillus L.) and cowberries (V. vitis-idaea L.) in Finland. Silva Fennica 45(2): 237–251.
Vaara M., Saastamoinen O., Turtiainen M. (2013). Changes in wild berry picking in Finland between 1997 and 2011. Scandinavian Journal of Forest Research 28: 586–595. http://dx.doi.org/10.1080/02827581.2013.786123.
Vasander H., Laine J. (2008). Site type classification on drained peatlands. In: Korhonen R., Korpela L., Sarkkola S. (eds.). Finland – Fenland. Maahenki. p. 146–151.
Vuokko S. (2005). Metsien yleiset kasvit. Opas kasvupaikkojen tunnistamiseen. [Common forest plant species. A guide for recognising different site types]. Metsätalouden kehittämiskeskus Tapio. Helsinki. 160 p. ISBN 952-9891-95-4. [In Finnish].
Total of 68 references
