Sebastian Kühle  ,
Alfred Teischinger,
Manfred Gronalt
,
Alfred Teischinger,
Manfred Gronalt
Optimal location of laminated beech production plants within the solid hardwood supply network in Austria
Kühle S., Teischinger A., Gronalt M. (2019). Optimal location of laminated beech production plants within the solid hardwood supply network in Austria. Silva Fennica vol. 53 no. 3 article id 10074. https://doi.org/10.14214/sf.10074
Highlights
- This paper provides data to the solid hardwood business and develops a mixed integer linear program model to design a laminated beech wood supply network
- It covers the strategic decision where to locate a new production facility within the existing supply network with the lowest supply network cost
- Sufficient sawn wood suppliers and potential facility locations are provided.
Abstract
Due to changes in forest management in various European countries, hardwood forest areas and amounts will increase. Sustainable and individual utilization concepts have to be developed for the upcoming available resource. Studies conclude that there is low potential for hardwoods in the traditional appearance market thus the application areas have to be extended to new structural innovative products. This paper examines the extension to a future laminated beech wood supply network which would be a combination of already existing and new production facilities. For a better future use of hardwood raw materials it is necessary to consider the entire supply chain. This also better shows a total hardwood value chain. Therefore, this paper provides data to the solid hardwood business and develops a mixed integer linear programming to design a laminated beech wood supply network. The model is applied to Austria as the sample region. It covers the important strategic decisions where to locate a downstream facility within the existing production network with the lowest supply network cost. Fourteen scenarios are developed to examine various future network configurations. Results about optimal material flows and used sawmills as well as downstream production facilities are presented in form of material and financial performances. Two optimal laminated beech production locations are determined by the calculated scenarios results, and the impact of a new sawmill is analyzed which is focused on beech.
Keywords
decision support system;
facility location;
laminated timber products;
mixed integer linear programming;
supply chain network design
-
Kühle,
BOKU - University of Natural Resources and Life Sciences, Vienna, Department of Material Science and Process Engineering, and Renewable Institute of Wood Technology Materials, Konrad-Lorenz-Straße 24, 3430 Tulln, Austria
E-mail
skuehle@boku.ac.at
- Teischinger, BOKU - University of Natural Resources and Life Sciences, Vienna, Department of Material Science and Process Engineering, and Renewable Institute of Wood Technology Materials, Konrad-Lorenz-Straße 24, 3430 Tulln, Austria E-mail alfred.teischinger@boku.ac.at
- Gronalt, BOKU - University of Natural Resources and Life Sciences, Vienna, Department of Economics and Social Sciences, Institute of Production and Logistics, Feistmantelstraße 4, 1180 Vienna, Austria E-mail manfred.gronalt@boku.ac.at
Received 13 November 2018 Accepted 5 July 2019 Published 2 August 2019
Views 82871
Available at https://doi.org/10.14214/sf.10074 | Download PDF

1 Introduction
1.1 Change of hardwood resources
Currently, within the hardwood business, the challenge is to develop sustainable and individual utilization concepts which consider species, quality, supply network and further aspects because more resource potential will be available prospectively. It becomes apparent that the proportion of deciduous forest area increases as well as the amount of harvested hardwood (BMLFUW 2015a; BMLFUW 2015b; BMEL 2017). The utilization of hardwoods as timber has decreased tremendously in the last two decades in Europe, but the utilization of hardwoods as industrial roundwood and fuel wood develops progressively in contrast.
1.2 Hardwood products
For the hardwood companies, a study by Lehner et al. (2014) concludes that there is low potential to increase the market volume in the traditional area like doors, staircases, flooring and more. The authors see more market potential in the development of glued cross sections based on hardwood or hybrid products for the construction market like hardwood cross-laminated timber, glulam and laminated veneer lumber. For construction applications, the production of lamellas requires defined strength properties by respective standards. Torno et al. (2013) applied such rules on the conversion of beech roundwood leading to the production of lamellas for beech glued laminated timber. They considered saw logs of different dimensions and qualities and three sawing technologies. They analysed the kiln-drying, planing, and strength grading processes. As a result, the yield was found to be between 17% and 22%. One has to highlight that they did not take in account co- and by-products.
In contrast to the technology concepts to produce these hardwood load-bearing component (Krackler et al. 2011; Blenk et al. 2015; Tran et al. 2016; Espinoza and Buehlmann 2018), one of the most important points that has not been addressed so far, is that there is currently no provider on the market who can continuously deliver glued hardwood timber products in Europe. There are less knowledge and experience with modern hardwood supply networks and the performance of structural hardwood applications. Also, comprehensive data about the supply network, stakeholders and the linked material flows is missing.
In addition to the technological requirements for manufacturing as well as strength testing of the lamellas and the depend on production line at the sawmills and downstream facilities, the hardwood supply network also has to be studied about possible quantities of the final products. A coniferous glued-laminated timber (glulam) plant is in the range up to 100 000 m3 as well as a cross-laminated timber plant. The timber supply for this production capacity must be provided continuously and promptly for further processing along a hardwood supply network. Beech wood is a potential resource for this case but has some availability limitation in summer (Berendt et al. 2017). In Central Europe, it is widespread, and it can be provided for a one-hardwood-type-only product.
1.3 Hardwood supply network
A potential beech wood supply network for laminated beech (LBWSN) would be a combination of already existing stakeholders (forest departments and sawmills) and new stakeholders (laminated wood production facility and customers). In a graph, it is represented by nodes as the stakeholders and arcs as material flow between the nodes thus the material is transported from source nodes, the forest department, over facility nodes to demand zone nodes, which represent the customers.
The main raw material of the supply network is hardwood saw logs. In sawmills, these logs are processed into lamellas using specific cutting patterns for producing rough glulam laminations (Torno et al. 2013). The kiln-dried beech timber is shipped to the downstream facility where it is further manufactured and assembled to various glued hardwood products like glulam or cross-laminated timber. Finally, the products are shipped from the facility to the customer zones.
While the locations and current products are known for forest departments and hardwood sawmills, further data is rather unknown for strategic network planning such as potential production capacities or transformation yield from hardwood roundwood to lamellas. Also, the downstream facilities contain uncertain factors. Production data and economical expense are not available or can be assumed for the downstream facility and the customers. Such data and parameters may comprise facility production capacity, production costs, the potential product demand etc.
In order to reengineer the network and to add new facilities for the downstream, new potential networks have to be designed. These alternatives can include possible suppliers, locations, production and storage capacities as well as marketing and shipment options (Klibi et al. 2010). Within the forest- and wood-based business, the opening up of new facilities are strategic decisions with long-term impact. Thus, it is also important to redesign the capacities and technologies of facilities within the divergent transformation business (Vila et al. 2006).
The collective consideration of individual production units within a supply chain can help to achieve aggregated capacities and resources to satisfy a downstream demand which is impossible as a solitary company. The combination of all these factors makes the planning of the LBWSN complex in the combination of the various factors and difficult in the computation with a big amount of data. The network needs a decision support system to support the strategical planning process and policy makers in the estimation of the potential consequences of their strategic business choices (Drucker 1995).
1.4 Optimization and facility location problem (FLP)
Within the operational research, the supply network design problem (SNDP) restructures supply networks to achieve value creation in stakeholders involved (Klibi et al. 2010).
FLP is a subset of supply network design or discrete problems which deal with the location of at least one facility in a given surrounding. The aim is to optimize the objective function like revenue, profit, cost, distances, covering or others. FLP is applied in public, private or military sector on a national or international level (Farahani et al. 2010). They can be focused on single echelon, single period and capacitated facilities such as manufacturing or distribution facility location-allocation problems. Facilities locations are chosen from a determined set of candidates to satisfy the demand of customers. The objective is to minimize the total cost covering fixed opening and variable operational cost or transport cost (ReVelle et al. 2008).
Furthermore, Melo et al. (2009) identified four elementary aspects in their review which may be considered in strategic supply chain planning with FLP: multi-layer/multi-capacity facilities, multi commodities, single/multiple periods, as well as deterministic or stochastic parameters. For example, the benefit of using multiple periods is that supply network designs can be adapted to parameters which change over the periods like resource availability or customer demand.
Within the forest- and wood-based sector, a high share of FLP publications deals with the use of woody biomass for heat and energy generation or as a resource for biorefineries. The contribution is the allocation of resource amounts and locations to plants or to biorefinery facilities as well as the opening of intermediate storage locations for the transport from source to the user (Gronalt and Rauch 2007; Rauch and Gronalt 2010; Kanzian et al. 2013; Johnson et al. 2014). Advanced FLP focus on integrated facilities within a supply chain network. Integrated biorefinery and forest product supply chain network designs are studied to support organizations in their investment decision (Feng et al. 2010; Abasian et al. 2017). Further, FLP can consider biorefineries technologies which can lead to centralized or decentralized plant concepts (Walther et al. 2012).
These integrated forest supply chain models represent almost unreachable, ideal networks. They consist of a cooperative and connective supply chain with optimal material and information flows. However, the real world problems have stakeholders with their own objectives thus lacks of coordination occur between stakeholders. Therefore, Alayet et al. (2018) provide a forest supply network model with independent business unites which are linked through interdependent processes. The model helps to study applied supply chain management methods. In their work, they compare Make-to-Order, Vendor Managed Inventory, and a centralized planning approach. The latter leads to the highest profit. The network design is characterized by perfect collaboration. The Vendor Managed Inventory approach fits for a business environment which is more characterized by competition and non-collaborative.
Klibi et al. (2010) mentioned that there are three major classes of value drivers which should be taken into account in supply chain network design. They are revenue drivers, cost drivers and capital expenditure. All three are not necessarily relevant for supply network design at the same time. If models use deterministic demand for the given number of periods, the revenues can be seen as a constant and the model objective just minimizes the supply network cost. Further, a review of facility location SCM shows that three fourth of the considered literature applied cost minimization objectives. That is highlighted by the authors because most businesses are profit oriented (Melo et al. 2009).
Finally, there is uncertainty involved in strategic planning processes with high investments. This means that there is not sufficient information at a specific time to predict specific resource, demand, sales or other developments in the future. One method to tackle uncertainty is the development of appropriate scenarios representing potential alternative futures that can be analyzed (Mansoornejad 2012).
For the laminated beech wood production network, there is no optimization model with collected data which could support the opening of downstream facilities to produce the laminated products yet available.
The presented works deal with supply network design, i.e. location problems in the forest- and wood-based business and hardwood products. None of the basic works relates in particular to the hardwood sector, which has an increased potential for raw material growth due to the emerging climate change. The novelty in this paper is the application of the existing models to the solid hardwood sector. Therefore, the main contribution of the paper is to collect data about the solid hardwood business for developing a strategic planning model to design a supply network for laminated beech products. Therefore, this research focuses on the FLP within a supply network design with the following characteristics:
• The laminated beech wood supply network under consideration is a multi-period, single-product and multi-layer supply network.
• Demand in each period (monthly) is deterministic and known.
• At least one facility is opened from a set of candidates.
• Customers can receive the product from one or multiple downstream facilities.
• Several different possible scenarios are used to simulate various network designs.
The results support decision makers where to locate a downstream facility within an existing production network with the lowest supply network cost and which hardwood sawmills should be involved in the upcoming implementation phase.
This paper aims to support standard decisions within the solid hardwood network where to allocate new manufacturing facilities for load-bearing applications and to analyses the beech material flow within the hardwood supply network for laminated timber purposes.
2 Material and methods
The following section describes the considered supply chain and its entities with forest departments, sawmills, downstream facilities and customers (Fig. 1). Data will be provided for each considered entity. It is from several sources as well as calculated and determined. Then, the mathematical program model description will present the exact formulation. It is followed by the chosen scenario. They are edited based on various roundwood supply and production capacity configurations to demonstrate the impact on the network design and because of the uncertainty of future developments. The section is completed with data preparation and processing.
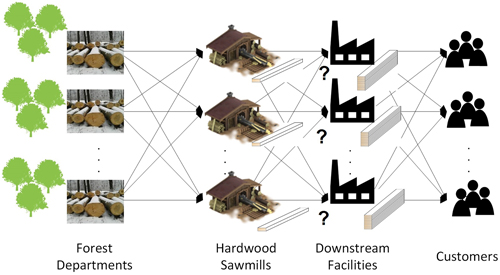
Fig. 1. The laminated beech wood supply network stakeholders and the material flows between them. There is a direct flow from one entity to all entities of the next tier. The source is at the forest departments and finishes at the sink, the customers. From several candidates, optimal downstream facilities are chosen to be opened within supply network.
2.1 Supply network
2.1.1 Forest areas, distribution and roundwood supply
48% of Austria were covered with forests in 2013. The annual increment was 30.4 million m3 of standing wood and 25.9 million m3 (85%) of it was harvested. 82% of the forest land is owned by the private and 18% by the public sector. The forest area consists of 28 % deciduous and 72% coniferous tree shares (proHolz 2013). In the case of wood harvesting, the proportion was 83% softwood and 17% hardwood in 2015. All in all, 17.5 million m3 of the harvested wood was utilized, as there is harvesting loss in bark an wood of about 10%. (BMLFUW 2016). The most commercial species are spruce (Picea abies (L.) H. Karst., 69%), European beech (Fagus sylvatica L., 7%) and Scots pine (Pinus sylvestris L., 6%) (BFW 2017).
Deciduous trees are mainly located in the north-east and south-east of Austria. According to the Austrian forest inventory data of the period 2007–09, the four highest deciduous stocks are in Lower Austria, Styria, Upper Austria and Carinthia (BFW 2017). For the utilization of hardwood in 2015, Lower Austria used almost the same amount as all the other 8 federal states together. It is followed by Upper Austria, Styria and Burgenland. The amount of harvested hardwood for material utilization (mid-diameter > 20 cm) was 288 000 m3 harvested timber of which approximately 146 000 m3 of harvested timber was beech wood (BMLFUW 2016). In the model, 88 forest departments are considered which provide roundwood (Fig. 2). Their location is determined by the central global positioning system coordinates of the district cities. Hardwood amounts are differently distributed at each department and not every department supplies beech roundwood. The geographic orientation of Austria makes transnational raw material procurement necessary thus sawmills procure wood from adjacent countries like Germany or Hungary. If transnational raw material procurement from neighbor countries is also considered, an additional 212 730 m3 are available (Table 1).
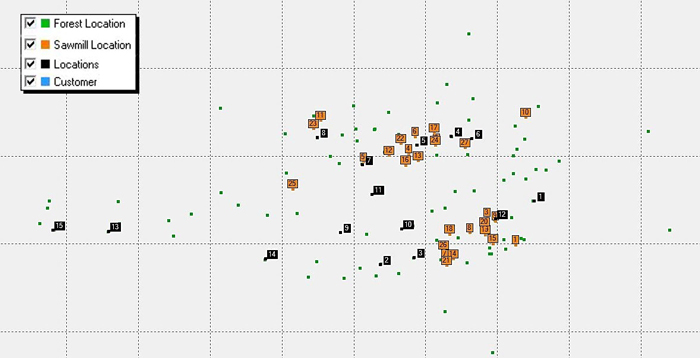
Fig. 2. The map represents the location of the several hardwood stakeholders. Forest departments with soft- and hardwood (green - 94), hardwood sawmills (orange - 27), laminated beech wood facility candidates (black -15) and customers (blue – have the same location as the forest departments - 88). View larger in new window/tab.
| Table 1. Countries and amounts for beech roundwood procurement. | |||||
| Country | City as central location | Share of beech in the country, estimated | Share of beech in the chosen location, estimated | Production, Sawlogs and veneer logs, non-coniferous* [m3 of roundwood] | Amount of beech in the chosen location, calculated [m3 of roundwood] |
| Slovakia | Nitra | 25% | 10% | 1 558 996 | 38 975 |
| Hungary | Székesfehérvár | 6% | 40% | 919 400 | 22 066 |
| Czech Republic | Iglau | 8% | 10% | 496 000 | 3968 |
| Germany | Landshut | 18% | 8% | 3 356 883 | 48 339 |
| Slovenia | Celje | 30% | 30% | 320 823 | 28 874 |
| Croatia | Zagreb | 36% | 10% | 1 958 567 | 70 508 |
| Total | 212 730 | ||||
| * FAOSTAT | |||||
In Fig. 3 the development of the yearly roundwood availability (12 periods) and the course of product demand is displayed. The values are used as a distribution key because the amounts of product demand and resources are only given per year.
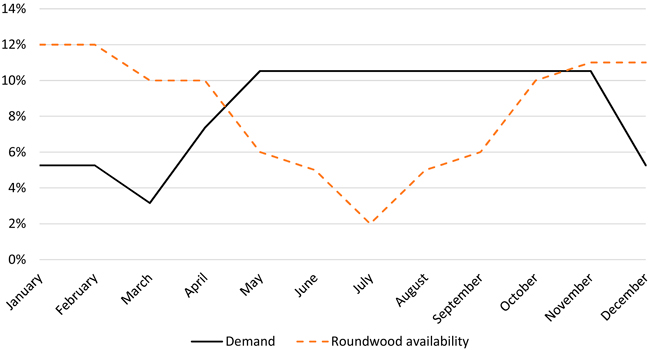
Fig. 3. Development of the annual product demand and the roundwood availability over the year.
2.1.2 Hardwood sawmills
The possible product amount depends on the availability of raw material, sawmill production capacities and demand. The Austrian hardwood sawmills have a wide range of production capacity. In 2015, 25–30 sawmills were operated with a sawing capacity from 1000 to 80 000 m3 of roundwood (Holzkurier 2015). These hardwood sawmills are located almost in proximity to the forest resources. Less than half of the sawmills are in the north-east and less than a half are in the south-east of the considered region. In 2015 sawmills processed approximately 309 000 m3 of roundwood. An estimated 132 000 m3 of the annual hardwood roundwood amount is beech wood. If only sawmills are considered which have a higher production capacity than 4550 m3 of roundwood each and manufacture beech, the result is an ultimate production capacity of 116 250 m3 of roundwood per year. 4550 m3 of saw logs are processed to a final product amount of 1000 m3 of sawn timber using a material yield of 22% (η1). Together, all hardwood sawmills can produce 275 500 m3 of roundwood which have a higher production capacity than 4550 m3 of roundwood each.
In addition to the already existing sawmills, another hardwood sawmill is introduced with the cutting capacity of 40 000 m3 of roundwood, which is located in Lower Austria. It is assumed that sawmill production capacity is missing in the federal state of Austria with the highest deciduous stock.
For the sawmill production cost, Rathke et al. (2012) conducted a study about different hardwood sawing types and presented a cost parameter for band saws with cutting costs of 36.09 € m–3 of roundwood. In this paper, we chose 35 € m–3 for the annual production capacity interval from 25 000 to 45 000 m3 of roundwood. Higher production capacities are calculated with 30 € m–3 and lower ones with 40 € m–3. For sawmills with a production capacity under 10 000 m3 of roundwood per year 45 € m–3 are used. The data can be modified for different planning purposes. Finally, an inventory is considered at the sawmills and downstream facilities which balances the fluctuation in raw material and products over the year by storing them to an earlier point of time if possible.
2.1.3 Laminated beech wood facilities (LBWF)
A modern LBWF satisfy a demand of 16–20 000 m3 per year. As a reference, in Switzerland, the ultimate investment cost comes to 21.3 million CHF (19.9 million €) including real estate, infrastructure, machines for the production line as well as furnishings and equipment (Vögtli 2013). These costs are taken into account by annuity calculation over 20 years and a 5% interest rate.
For the supply chain model, 15 different locations where proposed as possible LBWF locations which are directly supplied by the sawmills. The facilities are distributed by following the two requirements: First, all federal states have to be considered and second, the locations have to be chosen with the lowest square meter purchasing price in the selected federal state. The yield recovery of the facility is determined with 95% (η2). The 5% loss is related to the joining process only. Further, the facilities have different production capacity options (CAPlo). Three types are determined with (O = 1) 20 000 m3, (O = 2) 15 000 m3 and (O = 3) 10 000 m3. According to the size, the investment costs are adapted. These types represent only one shift. A second shift is selectable with three extra option (34 000 m3 (O = 4), 25 500 m3 (O = 5) and 17 000 m3 (O = 6)). They are representing 170% of the original option capacity. These additional options do not influence the investments of the newly opened facility, but it may influence the facility location allocations and material flows because of the production capacity increase.
2.1.4 Customer demand
The demand for hardwood construction products is set to 50 000 m3 per year. For laminated timber products, we guess that products of approximately 1.8 million m3 were produced which mainly consist of softwood (Kaufmann et al. 2011). 50 000 m3 are less than 3% substitution of the softwood laminated timber products. This amount is distributed all over Austria. The timber building distribution key of the survey was used to allocate the demand to the federal states. The detailed demand, within the Austrian federal states, is distributed over the several districts with the relation inhabitants per district. Also, a combined distribution key is determined for the national (40%) and transnational (60%) demand (Table 2).
| Table 2. Demand distribution key for Austria (Kaufmann et al. 2011), Italy and Germany. | ||||
| Countries | Scenario #1 – #13 | Scenario #14 | ||
| Federal States | Weighting [%] | Amount [m3] | Weighting [%] | Amount [m3] |
| Austria | 100.00 | 50 000 | 40.00 | 19 998 |
| Lower Austria | 21.52 | 10 760 | 21.52 | 4303 |
| Upper Austria | 17.01 | 8505 | 17.01 | 3403 |
| Styria | 16.53 | 8265 | 16.53 | 3306 |
| Vienna | 12.59 | 6295 | 12.59 | 2519 |
| Tyrol | 9.66 | 4830 | 9.66 | 1932 |
| Carinthia | 8.06 | 4030 | 8.06 | 1612 |
| Salzburg | 6.39 | 3195 | 6.39 | 1278 |
| Burgenland | 4.24 | 2120 | 4.24 | 844 |
| Vorarlberg | 4.00 | 2000 | 4.00 | 801 |
| Italy | 0 | 0 | 18.00 | 9000 |
| Germany | 0 | 0 | 42.00 | 21 000 |
2.1.5 Transportation data
In this paper a simplified transport situation is assumed. Three transport cost coefficients are determined with C1 (from forest department to sawmill), C2 (from sawmills to LBWF) and C3 (from LBWF to the customer). Each is made up of a unit cost per km divided by 28 m3 of roundwood loading volume and multiplied by two for two directions. For C1 4 € m3km–1, for C2 3 € m3km–1, and C3 2.5 € m3km–1 are assumed. For C1, the value computed is in line with the provided values from Borcherding (2007) for the driving distance between 50 to 100 km. The decreasing values for C2 and C3 simulate the increasing load density resulting from lower wood humidity and better packing potential through dimension formatting from the resource location to the customer. The applied simplicity either considers decreasing the cost for higher driven distances and no different vehicle possibilities (Suurs 2002).
2.2 Model description
We propose a mixed integer linear programming model (MILP) to find an optimal design for a general LBWSN considering the aforementioned entities. It combines a supply network flow with a FLP. The model aims to minimize the cost of supply network by satisfying a specific product demand per year. The model considers several parameters which characterize the four entities forest departments, sawmills, LBWF, and customers. Decision variables are introduced to describe material flows between the entities and within the sawmills and production facilities (Fig. 4).
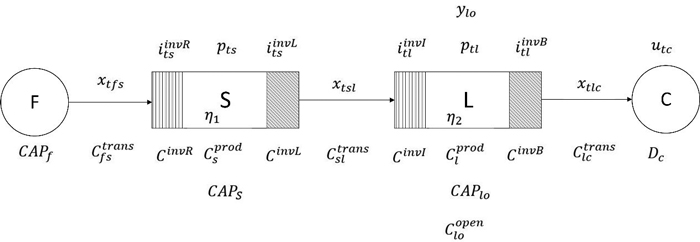
Fig. 4. Generic LBWSN with the four entities forest departments (F), hardwood sawmills (S), LBWF (L) and customers (C). I, p, u, x and y represent decision variables and the notations C and D represent parameters.
The following section presents the exact formulation of the MILP model, defining sets, parameters [min; max], the objective function, decision variables, and constraints.
| Indices | ||
| F | Set of forests departments | |
| S | Set of sawmills | |
| L | Set of laminated beech wood facility locations | |
| C | Set of customers | |
| O | Set of options | |
| T | Set of periods | |
| Parameters | ||
| Fixed cost to open new LBWF location l with capacity option o [11 301 682 €; 14 941 682 €] | ||
| Transportation distance from forest f to sawmill s [0 km; 523 km] | ||
| Transportation distance from sawmill s to LBWF l [0 km, 507 km] | ||
| Transportation distance from LBWF l to customer c [0 km; 506 km] | ||
| Unit sawing cost at sawmill s [30 €, 45 €] | ||
| Unit production cost at LBWF l [30 €] | ||
| CAPtf | Amount of resource at forest location f in period t [0 m3 of roundwood; 8461 m3 of roundwood] | |
| CAPts | Production capacity at sawmill s in period t [0 m3; 7083 m3] | |
| CAPlo | Production capacity at LBWF l with capacity option o [833 m3; 2125 m3] | |
| Dtc | The demand of Customer in period t [0 m3; 2211 m3] | |
| Lmax | Max amount of new LBWF [0; 15] | |
| M | High value [400] | |
| CinvR | Unit inventory cost for raw material at sawmill [12 €] | |
| CinvL | Unit inventory cost for the product at sawmill [10 €] | |
| CinvI | Unit inventory cost for raw material at LBWF [10 €] | |
| CinvB | Unit inventory cost for the product at LBWF [8 €] | |
| C1,C2,C3 | Transport cost coefficient [0.2856 € m³km–1, 0.071 € m³km–1, 0.178 € m³km–1] | |
| η1 | Yield at sawmills to disassembly hardwood stems to timber [0.22] | |
| η2 | Yield at LBWF to assembly hardwood timber to beams [0.95] | |
| SinvR | Start inventory for raw material at sawmill [0 m3 of roundwood] | |
| SinvL | Start inventory for the product at a sawmill [0 m3] | |
| SinvI | Start inventory for raw material at LBWF [0 m3] | |
| SinvB | Start inventory for product at LBWF [0 m3] | |
| Variables | ||
| xtfs | Amount of roundwood shipped from forest f to sawmill s in period t [m3] | |
| xtsl | Amount of lamellas shipped from sawmill s to LBWF l in period t [m3] | |
| xtlc | Amount of product shipped from LBWF l to customer c in period t [m3] | |
| pts | Amount of consumed roundwood at sawmill s in period t [m3] | |
| ptl | Amount of consumed lamellas at LBWF l in period t [m3] | |
| Inventory level of raw material at sawmill s in period t [m3 of roundwood] | ||
| Inventory level of product at sawmill s in period t [m3] | ||
| Inventory level of raw material at LBWF l in period t [m3] | ||
| Inventory level of product at LBWF l in period t [m3] | ||
| ylo | 1, if LBWF l is open with capacity option o, 0 otherwise | |
| utc | Unsatisfied demand of customer c in period t | |
2.2.1 Objective function
The objective function is to minimize the total cost of the supply network. The costs of the model comprise sawing at the sawmills, transportation, production at the LBWF, inventory, demand shortage and fixed cost to open new LBWF (1).
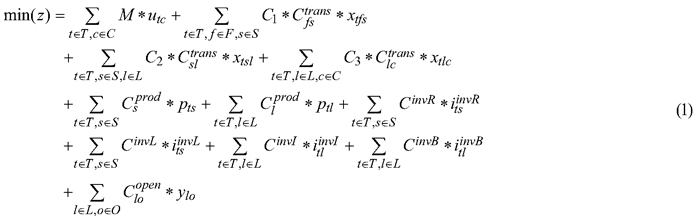
The decision variable utc, is used to guaranty maximal demand satisfaction. There will be model configurations which do not satisfy the demand constraint thus a model objective value of 0will be provided. To counteract this effect, the decision variable utc is introduced thus also a not fully achieved demand satisfaction will provide a solution.
2.2.2 Constraints
Constraint (2) and (3) provide the production and supply capacity constraint.
Constraint (4) to (11) assure that the material flow is balanced at the different positions. For the several periods, the sum of incoming and outgoing material flows has to be zero. Constraints (4), (6), (8) and (10) represent the inventory levels for the periods higher than one, while every other constraint represents the inventory level for the first periods. Thus, the start inventory Sinv is introduced. Constraint (12) can be used to limit the number of LBWF. Every opened LBWF has just one production capacity option (13). Constraint (14) assures that the available LBWF production capacity with option o can not exceeded. Constraint (15) defines the demand satisfaction constraints stating that the determined demand is every time satisfied by the sum of the product shipment and the unsatisfied demand variable. Finally, variables are defined in constraint (16) and (17).
2.3 Numerical experiments and scenario setup
In order to test the sensitivity of the optimal LBWSN design, several assumptions are made for key parameters of the network stakeholders. Opening a LBWF is linked with a high fixed cost. Therefore, the scenarios are used to examine if a facility location is competitive under various configuration. Altogether, 14 individual scenarios are designed. The matrix of scenarios is provided in Table 3.
| Table 3. Developed scenarios with the defined parameters. | |||||
| Scenarios | Additional sawmill (ADS) | Amount of facilities (AF) | Facility capacity option (FCO) | Sourcing strategy (SO) | Amount of roundwood (AR) |
| #1 | unlimited | 3 | AUT | 146 023 | |
| #2 | unlimited | 3 | AUT | 146 023 | |
| #3 | unlimited | 3 | AUT | 146 023 | |
| #4 | unlimited | 6 | AUT | 146 023 | |
| #5 | x | unlimited | 3 | AUT | 146 023 |
| #6 | x | unlimited | 6 | AUT | 146 023 |
| #7 | x | unlimited | 3 | AUT + Neighbours | 358 762 |
| #8 | x | unlimited | 6 | AUT + Neighbours | 358 762 |
| #9 | x | 1 | 3 | AUT + Neighbours | 358 762 |
| #10 | x | 1 | 6 | AUT + Neighbours | 358 762 |
| #11 | unlimited | 3 | AUT + Neighbours | 358 762 | |
| #12 | x | unlimited | 3 | AUT + Neighbours | 358 762 |
| #13 | x | unlimited | 6 | AUT + Neighbours | 358 762 |
| #14 | x | unlimited | 6 | AUT + Neighbours | 358 762 |
The first two scenarios represent the current situation of the network. They consider only beech processing sawmills and a national sourcing strategy (SO with AUT) with an amount of roundwood (AR) of 146 023 m3. The difference to the first scenario (#1) is that the #2 has a minimal production capacity threshold of 4550 m3 of roundwood.
For the following scenarios, the sawmill production capacity is increased in total by using all hardwood sawmills for the converting of beech wood. The existing cutting technologies would make it possible to change the hardwood type.
#3 represents the new adaption of the total sawmill capacity. In #4, it is possible to have a LBWF with six different production capacities options (FCO).
In #5 and #6, the additional hardwood sawmill (AS) is used.
#7 to #8 are based on the previous assumptions plus a transnational sourcing strategy (SO AUT + Neighbours). This sourcing strategy is also assumed for the following scenarios. On the one hand, there would not be enough beech roundwood to fulfill all demand with a national one. On the other hand, a shorter distance can be used.
For #9 to #10, it is assumed that the amount of LBWF (AF) is limited to one. The high financial risk of the investment and the uncertain demand makes it more reasonable to open only one facility and to accept the unsatisfied demand.
#11 to #13 represent the configuration of an alternative network design based on the existing sawmill locations but with increased production capacities. Additional to the LBWF capacities also sawmills capacities can be modified; thus the LBWSN is re-engineered by optimized material flows. The #13 configuration includes all 27 hardwood processing sawmills. Their cutting capacities are set to 20 000 m3 of roundwood at least. The investment costs for the required technology adoption are not considered in the model. The focus is based on the minimal supply network cost and the design with the corresponding material flow.
The last configuration (#14) is similar to #13. Only the national and transnational demand is different. 40% of the demand is located in Austria, and 60% are located in Germany (70%) and Italy (30%).
For every modification according to the scenario configuration, a MILP model is calculated and resolved again.
After the calculation, the results are presented and analyzed in two steps. The first represents cost parameters which are given in € m–3 for the satisfied individual demand per scenario. There are the total cost (objective value minus the unsatisfied cost), the opening cost for the chosen amount of facilities and the capacity option, the transport cost from each used entity, the production cost (sawing cost at sawmills and production cost at the LBWF) and the combined storage cost for sawmill and LBWF. The second part shows material parameters in % per scenario. The degree of production capacity utilization for individual sawmills is shown with a bar chart and which LBWF is opened.
The model is implemented in the modeling language Xpress Mosel Version 4.0.0 using FICO Xpress-Optimizer 29.01.07 as a solver. All numerical tests were run on a standard laptop with a 2.8 GHz processor and 48.0 GB RAM.
3 Results
The solver runtime never lasts more than 40 sec for the given problem size. For example, the model counts 53 814 variables, 3304 constraints and 107 124 non-zero elements in #13.
The graphical output, for #1, shows that the sawmills are located in the north-east or south-east. Also, the LBWF has a south-east location in the network (Fig. 5).
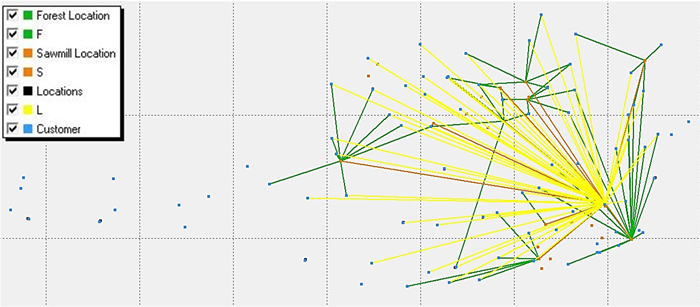
Fig. 5. Material flow of #1. The individual colours illustrate the material flows from forest locations to sawmills (green), from sawmills to facility locations (orange) and from facility location to customer (yellow).
The total supply costs per satisfied demand of laminated beech products range from 309 to 351 € m–3 and the satisfied demands range from 14 847 to 38 242 m3 (Table 4).
| Table 4. Financial performance results for scenarios #1 to #14. | ||||||||||||||
| Cost parameter | #1 | #2 | #3 | #4 | #5 | #6 | #7 | #8 | #9 | #10 | #11 | #12 | #13 | #14 |
| Sadiesfied demand [m3] | 14 972 | 14 847 | 23 942 | 26 639 | 24 181 | 24 378 | 30 000 | 33 451 | 19 992 | 31 092 | 34 703 | 34 710 | 37 548 | 38 242 |
| Total supply cost per m3 [€ m–3] | 345 | 351 | 339 | 332 | 324 | 309 | 330 | 322 | 311 | 323 | 341 | 331 | 323 | 321 |
| Opening cost [€ m–3] | 48 | 49 | 53 | 41 | 53 | 30 | 49 | 33 | 46 | 30 | 47 | 47 | 34 | 27 € |
| Transport cost [€ m–3] | 109 | 121 | 79 | 86 | 71 | 76 | 87 | 94 | 70 | 92 | 92 | 87 | 92 | 93 € |
| Production cost [€ m–3] | 186 | 178 | 202 | 202 | 195 | 198 | 191 | 191 | 193 | 197 | 197 | 192 | 192 | 197 € |
| Storage cost [€ m–3] | 2 | 2 | 5 | 2 | 5 | 5 | 4 | 4 | 2 | 5 | 5 | 5 | 4 | 4 € |
The lowest opening cost is calculated for #14 with 27 € m–3. This means that 27 € m–3 of the cost is investment cost. Also, they have the lowest transportation cost but not the lowest demand satisfaction. #2 represents the lowest demand satisfaction and minimal production cost over all calculations. It is the scenario with the lowest production capacity. Thus only sawmills are considered which cut beech and have a production capacity threshold of 4550 m3 of roundwood. #2 also has the highest total cost of supply.
Considering the production costs in contrast to the remaining costs, Fig. 6 illustrates that production cost makes up around half of the total supply cost but reaches two thirds in scenario #6. The storage cost can be neglected because they take a very small share of the remaining supply costs.
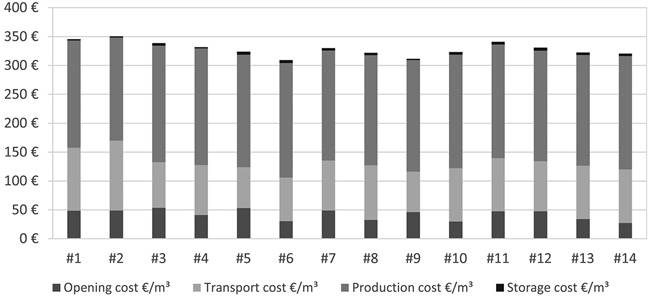
Fig. 6. The total supply network costs are represented per satisfied demand and for each sceanrio.
The material performances are shown in Table 5 for all calculations. For four chosen scenarios, Fig. 7 shows the satisfied demand and resource supply over the year. They are chosen because #6 has the lowest total cost of supply, #8 has no sawmill capacity adaption but transnational sourcing, in #9 only one LBWF can be opened, and in #13 the highest resource, sawmill and LBWF capacities are available. The degree of demand fulfillment is at the lowest point in #1 and #2 and increased gradually from 30% up to 76%. The expansion of the roundwood sourcing locations and amounts shows also a change in the amount of used resources from #6 to #7. The amount of imported roundwood reaches 28% in #14. The highest utilization of the sawmill capacities is in #2 with the lowest sawmill capacity in total. Almost all opened LBWF have a high capacity utilization. Three even reach the capacity limit.
| Table 5. Material performance results for scenarios #1 to #14. | ||||||||||||||
| Material parameter | #1 | #2 | #3 | #4 | #5 | #6 | #7 | #8 | #9 | #10 | #11 | #12 | #13 | #14 |
| Degree of demand fulfillment [%] | 30 | 30 | 48 | 53 | 48 | 49 | 60 | 67 | 40 | 62 | 69 | 69 | 75 | 76 |
| Amount of used resources [%] | 49 | 49 | 78 | 87 | 79 | 80 | 40 | 45 | 27 | 41 | 46 | 46 | 50 | 51 |
| Amount of imported resources [%] | 0 | 0 | 0 | 0 | 0 | 0 | 25 | 27 | 6 | 17 | 25 | 24 | 27 | 28 |
| Amount of used sawmill capacity [%] | 54 | 61 | 42 | 46 | 37 | 37 | 45 | 51 | 30 | 23 | 27 | 26 | 28 | 28 |
| Amount of used LBWF capacity [%] | 100 | 99 | 60 | 78 | 69 | 98 | 100 | 98 | 100 | 91 | 99 | 87 | 88 | 75 |
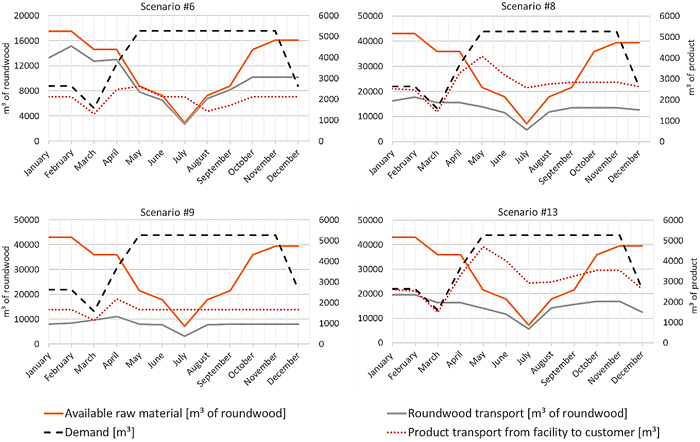
Fig. 7. Material performance results are shown for scenario 6, 8, 9 and 13. The raw material (orange,) and demand of products (black, m3 of product, right diagram title) curves result from the key distribution parameter and have the same development in the four diagrams. In contrast to the following three scenarios, #6 includes a national souring only. Roundwood (grey, m3 roundwood, left diagram title) product transportation (red, m3 of product, right diagram title) are the results of the individual scenarios. View larger in new window/tab.
Over the year, the curves for customer demand and availability of resource proceed in opposite directions. While the demand of laminated wood products for construction purposes has high season over summer, roundwood availability has low season.
For #6 in Fig. 7, the demand is almost satisfied for the first three months and roundwood is provided at a high level. Up to April, the demand recovers after a demand downturn in March, but the product supply stays low the following months. With the assumption of transnational roundwood procurement, which achieves a higher roundwood amount, the demand is satisfied on a higher level (#8). If the amount of new LBWF is limited, also the supply of products to customer is limited and fixed on a specific level (#9 with only one LBWF). With the possibility of more sawmills with cutting capacity over 20 000 m3 of roundwood, the demand can be satisfied on a high level with roundwood procurement shortage in July (#13).
To understand the sawmill side and the integration of each sawmill into the supply network designs, the operated sawmills are presented in Fig. 8. Additionally, the degree of capacity utilization is shown and the opened LBWF are represented. The additional sawmill 27 is always used if it is possible and it always reaches the capacity limit. Considering the specific used sawmills in the scenarios, it is obvious that also in #11 to #14 the same sawmills are used than in the scenarios before, although every sawmill location is available to produce lamellas and that with a raised threshold.
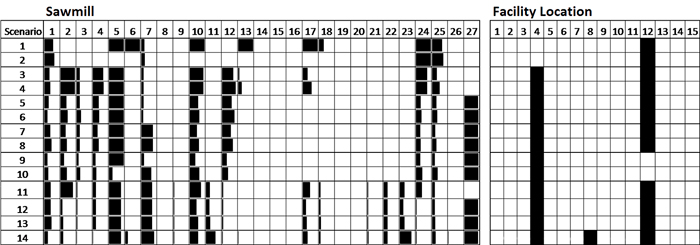
Fig. 8. For all 14 scenarios, the used sawmills and facilities are represented. For the facility locations, it is just shown if it is opened. The degree of sawmill capacity utilization is shown with percentage bar sizes. The additional sawmill 27 is used every time when it was possible.
With the focus on open a LBWF within the supply network, the scenarios calculated two optimal locations for the facilities for #1 to #13 and an additional one for the #14. One, L 12, is located in Styria and the second one, L 4, is located in Lower Austria and the third one, L 8, is located in Upper Austria.
Finally, different limits occur within the scenarios. The first two scenarios show a very low degree of demand fulfillment by a high total cost of supply and a high percentage of used sawmill capacity. The provided sawmill capacity is the limit for these scenarios because the distances and transport cost also increase with a higher sawmill capacity use. More roundwood is used in the next four scenarios because higher production capacity is available at the sawmills; thus it results in a higher demand fulfillment and lower total supply cost. Here, the roundwood is at the highest consumption compared to the other scenarios. For the following scenarios, the degree of demand fulfillment illustrates the limit. It is at the highest level compared to the previous scenarios.
4 Discussion and conclusions
With the developed approach, proposed in the current paper, the LBWSN flows from forest departments via hardwood sawmills and the optional downstream facility for construction purpose to the final customer, can be optimized. Also, different scenarios are presented which simulate specific assumptions to support the optimization and the evaluation of the supply chain network designs. In most practical situations, a quite large number of scenarios is possible but only a few of them can be considered in the optimization process for reasons of time. With the focus on opening up a LBWF within the supply network, two locations are calculated repetitive for optimal locations in the several scenarios. Further aspects will be discussed which result from the outcome of the scenarios and which are linked to the developments in the LBWSN.
4.1 Sawmill characterization and LBWF location
Both opened facilities have bigger suppliers of lamellas in their closer distance which result in lower transport and production cost. Further, the used sawmill can be classified in three groups: sawmills which I) manufacture beech and have a production capacity equal or higher 20 000 m3 of roundwood, II) manufacture beech and have a production capacity lower 20 000 m3 of roundwood or III) manufacture no beech and have a production capacity lower 20 000 m3 of roundwood. The last two groups of sawmills need a raise of production capacity like new or enhanced technology. This can benefit the owner and the whole LBWSN, but it challenges the hardwood network which contains of stakeholders with own objectives. Thus in the most cases, it is easier to design a new network from scratch than to reengineer it. Optimizing existing processes means that new processes have to be integrated in running operations and the transition has to be well planned from one to the other network design. In this work, an addition sawmill was integrated to study the impact on the network (Fig. 8, sawmill 27). Besides the full use of its capacity, the opening of the sawmill can reduce the network production and transport costs 5 € m–3 each (Table 4, #11 and #12).
4.2 The inventory role
The possibility to store raw materials and products has an impact to satisfy the demand. Inventory plays an important role in this network and model because roundwood and products are stored to provide them when they are needed. The availability of roundwood is decreasing from spring time and whereas the demand from the side of the sawmills starts to raise. Fig. 7 represents how the material flows react to the situation and with the high demand gradient from the beginning of spring. For example #13, the production capacity is limited to 3541 m3 for the assigned LBWF. After the demand gap in March, the satisfied demand went over the production capacity. Products and raw material are used from the storage to satisfy demand. After May, the curve goes down because roundwood is not economically available anymore although demand of final products and roundwood are still existing. It is to point out that the model has no storage limit constraints, but they could be added easily.
4.3 Raw material increase and the influence on the supply network
By design, the optimization model focusses on strategic planning to choose the optimal LBWF locations and material flow within the production network. For the model, the period of scope is one year with 12 periods. It does not consider future resource increment of the local forest sources. For the investors, the investment horizon is an important aspect which can be 15 years and more. Studies show that there is an increase in hardwood stocks and that the trend goes on. This has an impact on the overall supply network cost. To anticipate the consequences for this cost, the national (#5 and #6) and transnational (#7 and #8) sourcing strategy are compared. It can be assumed that the production cost will decrease per m³, the opening cost stays stable (decrease from #5 to #7 and increase from #6 to #8) and the satisfied demand will increase. Transportation cost increase because of the longer roundwood allocation distances and in order to supply more customers. It is to be highlighted that this increases the degree of demand fulfillment by 18% (#6 to #8). In total the overall cost of transport increases from 76 € m–3 (#6) to 87 € m–3 (#8). It can be assumed that saw log transport cost will decrease with a higher amount of local resources available. Nevertheless, it is possible to work out further cost reduction when the procurement part is investigated in more detail. Potential can be found in the use of different means of transports, the strategy of sourcing like collective procurement of logs or further advanced transport tactics like back hauling.
4.4 Change of demand
In this paper, demand was determined to 50 000 m3 glued laminated beech wood products. In the same way as the resource amount, also the demand side can not be predicted with certainty. In the case the demand would be higher than expected, it would strongly affect the network structure. In the case, laminated wood product demand increases from 3% to 10%, as an example, this can result in economy of scale effects which will affect the total supply chain costs as described by Song and Sun (2016).
Italy and Germany are the major buyers of Austrian wood-products. Therefore, 60% of the demand are located transnationally. When the additional demand is considered in the calculations, this results in a slightly different network design and material flow. The satisfied demand reaches 76% (#14), which is 1% more than for the national demand only. Like before, the additional sawmill 27 is used. For the opened LBWF, it is noticeable that facility 8 (Upper Austria) is opened in addition to 4 and 12. The opening cost are the lowest for all scenarios, although it is optimal to open three facilities which result in a lower amount of used facility capacity. The total supply cost makes up 321 € m–3 and the transport cost 93 € m–3. With the computed results, the #14 is in accordance with the other 13 scenarios.
4.5 Managerial implication
Data, which is visualized in Fig. 8, can support the decision which stakeholders should be cooperating to guaranty reduced network and product costs. Results about used and transported amounts as well as used forest departments, sawmills, opened facilities and customer locations are available, which lead to optimized material flows through the supply network. One important insight is that the production of laminated beech wood products has to be a cooperative planning between existing stakeholder and new ones. Instead of individual stakeholder goals, we defined an overall supply network objective. The potential LBWSN can lead to sawmills with qualitative manufacturing and secure supply of beech lamellas and to LBWF which are focused on producing qualitative laminated beech wood products and satisfying final customers.
4.6 Further outcomes
This paper looks at the minimal supply network cost from raw material to the customer and integrated transportation as well specific manufacturing activities of the production units. Beyond the paper of Torno et al. (2013), this paper integrated the decision to open downstream facilities at determined locations as well as transportation activities between the units and before and after the sawmills. Further, this paper considered location positions of the production units as well as capacity differentiations of the sawmills and the LBWF.
Ouhimmou et al. (2008) conducted an analyze of a specific furniture company by using their internal dataset and compared computed results with the results of the company planning process. The provided dataset helped the authors to find potential performance improvements. The main reason for the improvements increase was fitting sawing policies and hardwood logs to the customer´s demand configuration. In this paper, only one material yield is used for the sawing process for one class of beech logs which was provided by Torno et al. (2013). At this point, there is potential for further studies which should consider different sawing policies for various log dimensions or alternative sawing policies which go along with the new intermediate products. Also, if there is a deeper study of the laminated beech wood supply network, it will be necessary to conduct a broader study for collaboration between the beech wood production units either through information or resource sharing. D´Amours and Rönnqvist (2008) report that this results in decreased cost of executing the logistics activities, improve service, gain market shares, enhance capacities as well as protect environment and mitigate climate change Issues. Just as authors before, Abasian et al. (2017) reported that collaboration has a significant effect on the supply network profit.
As well as Feng et al. (2010) emphasize it, this model is also capable in evaluating various network designs with depended production unit parameters and amounts to find the minimal cost of the supply network, but the results are scenario sensitive. Therefore, further particular business data is required as well as scenario studies.
5 Concluding remarks
In general, this work provides data to the solid hardwood business and develops a MILP model in order to design a LBWSN. For a new product in the hardwood sector, the model covers the important strategic decision where to locate a glued laminated wood facility within the existing production network with the lowest supply network cost. The results of the optimization model, e.g. material flows and sawmills involved, can be considered for further planning. From the allocation of a production site, the continuous laminated beech wood production has to be guaranteed by a secure lamella supply by the sawmills. It will be challenging to develop a cooperation planning of the network actors on a tactical and operational level. Papers, which already tackled aforementioned aspects, show that a comprehensively developed model with well detailed data can identify further potentials in unused capacities. Thus, simultaneous considerations of the mechanical, production and network aspects will lead to further cost reductions within the LBWSN (Audy et al. 2012; Ouhimmou et al. 2008).
Acknowledgements
This paper is supported by BOKU Vienna Open Access Publishing Fund. Financial support for the work done in the framework of the PhD School DokIn´Holz was also provided by the Austrian Federal Ministry of Science, Research and Economy as well as the Austrian Federal Forestry Office and the Austrian Chamber of Agriculture are gratefully acknowledged.
References
Abasian F., Rönnqvist M., Ouhimmou M. (2017). Forest fibre network design with multiple assortments: a case study in Newfoundland. Canadian Journal of Forest Research 47(9): 1232–1243. https://doi.org/10.1139/cjfr-2016-0504.
Alayet C., Lehoux N., LeBel L. (2018). Logistics approaches assessment to better coordinate a forest products supply chain. Journal of Forest Economics 30(1): 13–24. https://doi.org/10.1016/j.jfe.2017.11.001.
Audy J.-F., Lehoux N., D’Amours S., Rönnqvist M. (2012). A framework for an efficient implementation of logistics collaborations. International Transactions in Operational Research 19(5): 633–657. https://doi.org/10.1111/j.1475-3995.2010.00799.x.
Berendt F., Fortin M., Jaeger D., Schweier J. (2017). How climate change will affect forest composition and forest operations in Baden-Württemberg—a GIS-based case study approach. Forests 8(8): 298. https://doi.org/10.3390/f8080298.
BFW (2017). Die österreichische Waldinventur. Erhebung 2007–09. [Austrian forest inventory]. Ascertainment 2007–09. Bundesforschungs- und Ausbildungszentrum für Wald, Naturgefahren und Landschaft. http://bfw.ac.at/rz/wi.home. [Cited 4 Jun 2017]. [In German].
Blenk M., Wehrmann W., Torno S. (2015). Laubholz für tragende Konstruktionen – Zusammenstellung zum Stand von Forschung und Entwicklung. [Hardwood for load-bearing constructions – Compilation on the state of art in research and development]. Cluster-Initiative Forst und Holz in Bayern gGmbH. [In German].
BMEL (2017). Forests and forest policy in Germany. Hg. v. BMEL. Federal Ministry of Food and Agriculture, Bonn.
BMLFUW (2015a). Austrian forest report 2015. Hg. v. Johannes Prem. BMLFUW – Federal Ministry of Agriculture, Forestry, Environment and Water Management, Vienna.
BMLFUW (2015b). Nachhaltige Waldwirtschaft in Österreich. Datensammlung zum österreichischen Wald. [Sustainable forestry in Austria. Data collection on the Austrian forest]. Time series for hardwood harvesting. BMLFUW – Federal Ministry of Agriculture, Forestry, Environment and Water Management, Vienna. 295 p. [In German].
BMLFUW (2016). Holzeinschlagsmeldung für das Jahr 2015. [Austrain logging report for 2015]. BMLFUW – Federal Ministry of Agriculture, Forestry, Environment and Water Management. https://www.bmnt.gv.at/dam/jcr:6bdf0ab0-d247-45b8-b5f9-83e419000069/Daten%20Holzeinschlag%202015%20BF%20CI.xlsx. [Cited 20.02.2017]. [In German].
Borcherding M. (2007). Rundholztransportlogistik in Deutschland – eine transaktionskostenorientierte empirische Analyse. [Log transport logistics in Germany – a transaction cost-oriented empirical analysis]. Dissertation. University of Hamburg, Hamburg. 266 p. [In German].
D´Amours S., Rönnqvist M. (2008). Issues in collaborative logistics. SNF Report 27/08. ISBN 978-82-491-0608-0. Institute for Research in Economics and Business Administration, Bergen. 19 p.
Drucker P.F. (1995). The information executives truly need. Harvard Business Review 1995: 54–62.
Espinoza O., Buehlmann U. (2018). Cross-laminated timber in the USA. Opportunity for hardwoods? Current Forestry Reports 4(1): 1–12. https://doi.org/10.1007/s40725-018-0071-x.
FAOSTAT (2017). Domain code: FO (forestry production and trade); Area code: 11,79,97,98,167,198,199; Element code: 5516 (production); Item code: 1604 (sawlogs and veneer logs, non-coniferous); Year: 2015; Unit: m3. http://www.fao.org/faostat/en/#data/FO. [Cited 22 May 2017].
Farahani R.Z., Seifi M.S., Asgari B. (2010). Multiple criteria facility location problems: a survey. Applied Mathematical Modelling 34(7): 1689–1709. https://doi.org/10.1016/j.apm.2009.10.005.
Feng Y., D’Amours S., LeBel L., Nourelfath M. (2010). Integrated bio-refinery and forest products supply chain newtork design using mathematical programming approach. CIRRELT-2010-50. https://doi.org/10.13140/RG.2.1.1979.2081.
Gronalt M., Rauch P. (2007). Designing a regional forest fuel supply network. Biomass and Bioenergy 31(6): 393–402. https://doi.org/10.1016/j.biombioe.2007.01.007.
Holzkurier (2015). Laubholzsägewerke Deutschland und Österreich: 2015. [Hardwood sawmills in Germany and Austrian in 2015]. Holzkurier 2015(38): 15–17. [In German].
Johnson D.M., Jenkins T.L., Zhang F. (2014). Methods for optimally locating a forest biomass-to-biofuel facility. Biofuels 3(4): 489–503. https://doi.org/10.4155/bfs.12.34.
Kanzian C., Kühmaier M., Zazgornik J., Stampfer K. (2013). Design of forest energy supply networks using multi-objective optimization. Biomass and Bioenergy 58: 294–302. https://doi.org/ 10.1016/j.biombioe.2013.10.009.
Kaufmann H., Nerdinger W., Grdanjski M., O’Donovan J.R., Robinson M., Taylor J., Kühfuss M. (2011). Bauen mit Holz. Wege in die Zukunft. Österreischiche Informationsbeilage. [Building with timber. Paths into the future]. Austrian information supplement. Prestel, Munich. [In German].
Klibi W., Martel A., Guitouni A. (2010). The design of robust value-creating supply chain networks. A critical review. European Journal of Operational Research 203(2): 283–293. https://doi.org/10.1016/j.ejor.2009.06.011.
Krackler V., Keunecker D., Niemz P., Hurst A. (2011). Possible field of hardwood application. Wood Research 56(1): 125–136.
Lehner L., Kinnunen H., Weidner U., Lehner J., Pauli B., Menk J. (2014). Branchenanalyse. Analyse und Synthese der Wertschöpfungskette (WSK) Wald und Holz in der Schweiz. [Industry analysis. Analysis and synthesis of the value chain (VC) forest and wood in Switzerland]. bwc management consulting GmbH. [In German].
Mansoornejad B. (2012). Design for flexibility in the forest biorefinery supply chain. Dissertation. École Polytechnique de Montréal, Départment de génie chimique, Canada.
Melo M.T., Nickel S., Saldanha-da-Gama F. (2009). Facility location and supply chain management – a review. European Journal of Operational Research 196(2): 401–412. https://doi.org/10.1016/j.ejor.2008.05.007.
Ouhimmou M., D’Amours S., Beauregard R., Ait-Kadi D., Chauhan S.S. (2008). Furniture supply chain tactical planning optimization using a time decomposition approach. European Journal of Operational Research 189(3): 952–970. https://doi.org/10.1016/j.ejor.2007.01.064.
proHolz (2013). Im Wald. [In the forest]. Zuschnitt 51. http://www.proholz.at/shop/publikation-detail/kategorie/zuschnitt/produkt/zuschnitt-51/. [Cited 20 Feb 2017]. [In German].
Rathke J., Huber H., Teischinger A., Müller U., Hansmann C. (2012). Verwendbarkeit von Laubschwachholz in der Sägeindustrie. Teil 1: Ausbeuteberechnung und Technologiebewertung. [Utilization of small dimensioned hardwood in the sawmill industrie]. Holztechnologie 51 (6). [In German].
Rauch P., Gronalt M. (2010). The terminal location problem in the forest fuels supply network. International Journal of Forest Engineering 21(2): 32–40. https://doi.org/10.1080/14942119.2010.10702596.
ReVelle C.S., Eiselt H.A., Daskin M.S. (2008). A bibliography for some fundamental problem categories in discrete location science. European Journal of Operational Research 184(3): 817–848. https://doi.org/10.1016/j.ejor.2006.12.044.
Song G., Sun L. (2016). Evaluation of factors affecting strategic supply chain network design. International Journal of Logistics Research and Applications 20(5): 405–425. https://doi.org/10.1080/13675567.2016.1267125.
Suurs R. (2002). Long distance bioenergy logistics – an assessment of costs and energy consumption for various biomass energy transport chains. University of Utrecht. ISBN 90-73958-83-0.
Torno S., Knorz M., van de Kuilen J.-W. (2013). Supply of beech lamellas for the production of glued laminated timber. ISCHP 13 - International Scientific Conference on Hardwood Processing. p. 210–217.
Tran V.-D., Oudjene M., Méausoone P.J. (2016). Experimental investigation on full-scale glued oak solid timber beams for structural bearing capacity. Construction and Building Materials 123: 365–371. https://doi.org/10.1016/j.conbuildmat.2016.07.002.
Vila D., Martel A., Beauregard R. (2006). Designing logistics networks in divergent process industries: methodology and its application to the lumber industry. International Journal of Production Economics 102(2): 358–378. https://doi.org/10.1016/j.ijpe.2005.03.011.
Vögtli S. (2013). Industrielle Laubholz-Weiterverarbeitung in der Nordwestschweiz. Schlussbericht. [Industrial hardwood processing in northwest Switzerland (final report)]. Forestry associaction beider Basel. Verfügung Nr. 09.0063.PJ/4-13.02. https://www.bafu.admin.ch/dam/bafu/de/dokumente/wald-holz/fachinfo-daten/laubholzverarbeitungnordwestschweiz.pdf.download.pdf/laubholzverarbeitungnordwestschweiz.pdf. [Cited 9 August 2017]. [In German].
Walther G., Schatka A., Spengler T.S. (2012). Design of regional production networks for second generation synthetic bio-fuel – a case study in Northern Germany. European Journal of Operational Research 218(1): 280–292. https://doi.org/10.1016/j.ejor.2011.09.050.
Total of 39 references.
