Uttam Thangjam,
Uttam K. Sahoo  ,
Pentile Thong
,
Pentile Thong
Characterization of morphometric, reproductive and seedling traits of Parkia timoriana in northeast India
Thangjam U., Sahoo U. K., Thong P. (2020). Characterization of morphometric, reproductive and seedling traits of Parkia timoriana in northeast India. Silva Fennica vol. 54 no. 1 article id 10163. https://doi.org/10.14214/sf.10163
Highlights
- Among provenances, Pherema (P1) Serchip (P10) and Jiribam (P7) were associated with stress tolerant and better quality seedlings.
- P1 gave the best result for seed traits including high germinability, P10 showed highest seedling vigour, while P7 corresponds to high-quality pod related traits
- Variations in morphological, germinative and seedling growth characters of seeds across provenance further illustrate the importance of site selection for the production of better quality trees.
Abstract
We studied variations on different traits of Parkia timoriana (D.C.) Merr. in twelve provenances systematically from their source of origin to a controlled environment where representative seedlings were grown. Among the provenances, P1 gave the best result for seed traits including germination traits, P7 for pod traits and P10 for seedling vigour. Effects of seasonal distribution of rainfall and temperature on seed and pod traits were also determined by computing multiple regression analysis. The results displayed winter rainfall and summer temperature as the most important factor determining pod and seed traits. Latitude also significantly (P < 0.001) affected PWT (r = 0.52), SWP (r = 0.46) and SW (r = 0.50). A common garden study for germination and seedling growth indicated P1 and P10 provenance as the best among all. Seeds drawn from P10 gave the highest seedling vigour with an average growth rate of 0.61 cm/day from 90th to 180th day. Highest broad-sense heritability values (h2) were observed in germination traits, followed by seedling collar diameter. The lowest h2 was observed for seedling height.
Keywords
seed source;
heritability;
genotype;
tree bean;
variations
-
Thangjam,
Department of Forestry, School of Earth Sciences & Natural Resource Management, Mizoram University, Aizawl-796004, Mizoram, India
 https://orcid.org/0000-0003-1263-5348
E-mail
thangjam1987@gmail.com
https://orcid.org/0000-0003-1263-5348
E-mail
thangjam1987@gmail.com
-
Sahoo,
Department of Forestry, School of Earth Sciences & Natural Resource Management, Mizoram University, Aizawl-796004, Mizoram, India
https://orcid.org/0000-0002-6524-1775
E-mail
uksahoo_2003@rediffmail.com
-
Thong,
Department of Forestry, School of Earth Sciences & Natural Resource Management, Mizoram University, Aizawl-796004, Mizoram, India
https://orcid.org/0000-0002-5358-181X
E-mail
pentilethong@gmail.com
Received 23 March 2019 Accepted 24 February 2020 Published 27 February 2020
Views 74357
Available at https://doi.org/10.14214/sf.10163 | Download PDF

1 Introduction
Parkia timoriana (D.C.) Merr., commonly known as tree bean (www.theplantlist.org), is one of the most widely distributed species of Parkia found in both sides of the hemisphere (Indo-Pacific region) and the only species found on both sides of the Wallace line (Hopkins 1994). The plant is highly valued for its subsistence products and an important source of cash income and livelihood support (Sahoo et al. 2007) for both hill and valley people during the winter and early spring seasons. Pods and seeds are sources of protein, fat, fibre and minerals (Longvah et al. 1998; Salam et al. 2009), and are a delicacy among people of northeast India; the pods are fetch a market value ranging from US$ 3–5 kg–1 (Rocky and Sahoo 2004). Other important uses of the tree include antioxidants, ethnomedicine, cosmetics, and firewood for the energy-deficient hill people (Angami et al. 2018). Enhancing the production of the species may reduce malnutrition for many people (>60%) in the region who suffer from lack of food (Longvah et al. 1998; Salam et al. 2010). Therefore, research is needed on population and regeneration ecology for the species as mortality rates are increasing year after year. Insect pests such as Cadra cautella and Anoplophora glabripennis damage heartwood, pod and seeds causing dieback of the tree regularly (Thangjam 2016).
Every tree has an adaptive potential for change in character supplemented by differences in genotypes, environments and their interactions (Savolainen et al. 2011). Tree bean also experiences variations in its pod and seed morphological characters within and between species (Luckow and Hopkins 1995). Inflorescence in this species is a capitulum of racemose type having three morphologically and functionally different flowers (Hopkins 1994). P. timoriana like many other species of Mimosoideae has self-incompatibility. Since the flower is not self-pollinated, gene flow is expected viz-a-viz genetic variation among the population. Moreover, within natural habitats of P. timoriana ranging extensively from foothills to elevations of 1300 m above sea level (Hopkins 1994) within northeast India, one may expect genetic divergence among its populations in several traits (Thangjam 2016). Molecular markers may provide a powerful means of assessing genetic structuring both within and among populations of P. timoriana; however, numerous times molecular markers have shown to be poor predictors of variation of adaptive traits (McKay et al. 2005). Therefore, this research involves a wider geographic range of discontinuity with diverse environments and exclusive of molecular markers to assess variations between provenance for morphometric, reproductive and seedling traits of P. timoriana in northeast India.
We assume that variation in phenotypic traits is influenced by local adaptation, maternal environment and varied breeding behaviour. Therefore, this study has the following objectives: (i) to relate variations in phenotypic traits of this species with the geographic variations and seed source, (ii) to distinguish the contribution of genotype and phenotype for a subset of traits through common garden study, and (iii) to identify the best seed source to counter the observed high mortality rates in populations of this species. Achieving these objectives will allow development of seed transfer guidelines for productivity improvement in the Eastern Himalayan region and, thereby, improve livelihood for the marginal farmers.
2 Materials and methods
2.1 Seed source/provenance selection and candidate plus trees (CPT) selection
From an extensive survey of 23 populations of P. timoriana, 12 provenances (sensu Zobel and Talbet 1984) representing 4 northeastern states in India were identified and selected for the study (Fig. 1). We considered a population with growth record for at least 4 generations and that were planted from locally obtained seed sources as a provenance. For this study, only P. timoriana trees grown in home gardens and shifting cultivation lands were represented, as no populations in wild were found in these regions. The provenance was identified in three steps: (a) through a market survey, find the main source of Parkia pods for household consumption and income generation; (b) visit localities where the species is grown abundantly and cross check if the source is providing sufficient products to the market; and (c) examine if the species grown locally was actually P. timoriana by evaluating parameters as per Hopkins (1986). Only mature trees of 13 to 15 years were selected for the study. Age of these trees was determined by counting the number of growth rings using tree ring increment cores. The geo-coordinates and other physical attributes of each provenance are shown in Table 1.
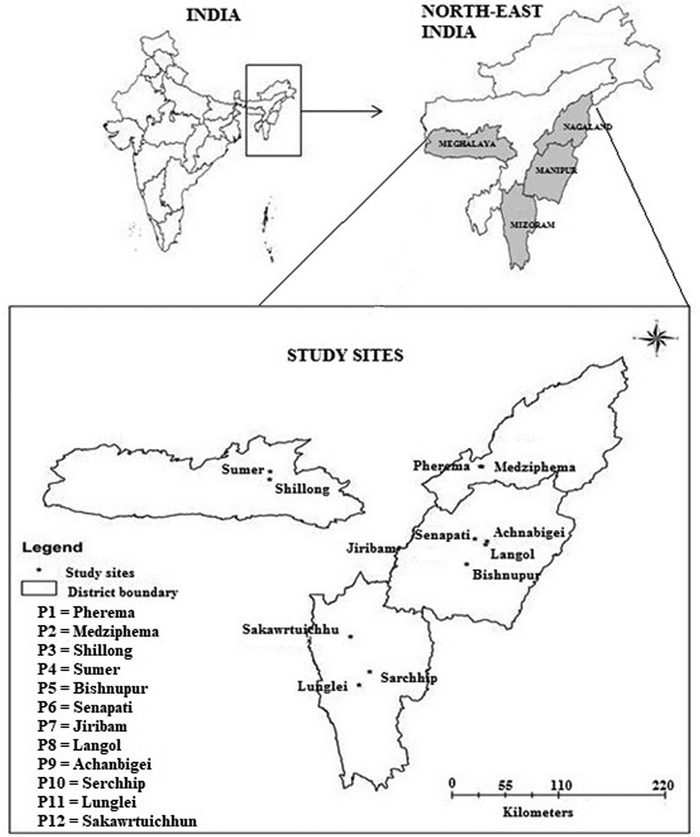
Fig. 1. Map of study area showing different provenances of Parkia timoriana.
| Table 1. Geomorphological climatic data corresponding to each provenance of Parkia timoriana in Northeast India. Meteorology data is from the Indian Meteorological Department (IMD) sub-stations, Krishi Vigyan Kendra (KVK) stations and state statistical department of the respective states. | |||||||
| Provenance | Code | District | Latitude | Longitude | Altitude (m) | MAP (mm) | MAT (°C) |
| Pherema | P1 | Dimapur | 25°45´21´´N | 93°53´39´´E | 432 | 3224 | 24 |
| Medziphema | P2 | Dimapur | 25°45´30´´N | 93°52´30´´E | 466 | 1180 | 28 |
| Shillong | P3 | Shillong | 25°35´80´´N | 91°55´21´´E | 1429.5 | 3530 | 17 |
| Sumer | P4 | Ri-Bhoi | 25°41´50´´N | 91°54´99´´E | 849.5 | 3063 | 22 |
| Bishnupur | P5 | Bishnupur | 24°36´34´´N | 93°45´05´´E | 820 | 1237 | 21 |
| Senapati | P6 | Senapati | 24°54´25´´N | 93°49´36´´E | 886 | 1537 | 22 |
| Jiribam | P7 | Jiribam | 24°47´15´´N | 93°06´56´´E | 60 | 1942 | 29 |
| Langol | P8 | ImphalWest | 24°50´25´´N | 93°55´39´´E | 851 | 1482 | 21 |
| Achanbigei | P9 | Imphal East | 24°52´46´´N | 93°56´25´´E | 788 | 1591 | 24 |
| Serchhip | P10 | Serchhip | 23°20´46´´N | 92°51´02´´E | 858.5 | 2208 | 25 |
| Lunglei | P11 | Lunglei | 23°11´26´´N | 92°45´06´´E | 809 | 3080 | 26 |
| Sakawrtuichhun | P12 | Aizawl | 23°45´33´´N | 92°40´25´´E | 839 | 2548 | 25 |
| MAP = Mean annual precipitation, MAT = Mean annual temperature. | |||||||
The selection of individual superior trees of P. timoriana for pod and seed collection was based on the phenotypic assessment of superior characters. In all the 12 provenances, ten 30 × 30 m plots per provenance were randomly placed, with the restriction that plots were at a minimum distance of 10 m apart. Ten most superior candidate plus trees (CPTs) with large volume and crown spread, coupled with large number of pods were selected per provenance and each such tree was selected only after making a comparison with 5 trees in a given plot (Table 2). The selected trees were free from diseases and had no evident advantage of fertilizer and cultural practices. The diameter was measured at breast height, i.e. 1.37 m above the ground. Height was measured by using a Ravi multimeter and volume was calculated from the regression equation developed by Thangjam et al. (2019).
| Table 2. Tree characters corresponding to average candidate plus tree (CPT) of each provenance of Parkia timoriana. | ||||||||
| Provenance | HT | DBH | CS | V | NB | CB | PC | PT |
| P1 | 11.45 | 19.78 | 5.87 | 0.47 | 9.3 | 5.01 | 10.4 | 492.1 |
| P2 | 13.10 | 23.28 | 6.08 | 0.71 | 7.1 | 4.15 | 9.3 | 268.8 |
| P3 | 10.30 | 21.85 | 5.93 | 0.55 | 9.4 | 4.50 | 10.3 | 424.7 |
| P4 | 13.50 | 25.30 | 6.24 | 0.91 | 9.9 | 4.88 | 9.5 | 457.8 |
| P5 | 11.30 | 16.50 | 6.12 | 0.49 | 8.8 | 4.87 | 13.0 | 541.8 |
| P6 | 10.40 | 18.15 | 5.84 | 0.54 | 7.7 | 4.50 | 10.4 | 360.6 |
| P7 | 12.30 | 22.70 | 5.65 | 0.67 | 11.0 | 4.09 | 9.4 | 414.4 |
| P8 | 6.73 | 16.05 | 5.03 | 0.22 | 6.9 | 5.01 | 11.6 | 403.2 |
| P9 | 13.50 | 18.86 | 5.60 | 0.56 | 7.9 | 4.63 | 10.2 | 369.0 |
| P10 | 13.40 | 20.08 | 6.63 | 0.63 | 10.0 | 4.84 | 12.5 | 609.6 |
| P11 | 9.10 | 17.45 | 5.55 | 0.34 | 6.4 | 4.55 | 8.9 | 260.8 |
| P12 | 11.80 | 22.60 | 6.21 | 0.89 | 9.8 | 4.87 | 9.2 | 447.6 |
| LSM | 11.41 | 20.22 | 5.90 | 0.58 | 8.7 | 4.66 | 10.4 | 420.8 |
| CV | 17.93 | 14.53 | 6.98 | 34.49 | 16.73 | 6.64 | 12.77 | 24.07 |
| SEm | 0.59 | 0.85 | 0.12 | 0.02 | 0.42 | 0.09 | 0.38 | 29.2 |
| LSD (P < 0.05) | 2.01 | 5.34 | 0.70 | 0.72 | 2.16 | 0.70 | 1.2 | 133.7 |
| HT = tree height (m), DBH = diameter at breast height (cm), CS = Crown spread (m), V = tree volume (m3), NB = number of branches per tree, CB = number of capitulum per branch, PC = number of pods per capitulum, PT = number of pods per tree, LSM = Least Square Means, CV = coefficient of variance, SEm = standard error of mean, LSD = least significant difference, n = 10. | ||||||||
2.2 Seed collection
Seeds were collected from the ten phenotypically superior candidate plus trees (CPT), each having a history of good seed production and without insect or pest attack. Care was taken that each candidate/plus tree was at least 100 m apart to ensure maximum genetic variation and to prevent from inbreeding depression (Seltmann et al. 2009). Twenty mature pods were plucked from each CPT and bulked together for the respective provenance, and then seeds were extracted manually from every pod by using secateurs. These seeds were then air dried for 15 days under shade to reduce moisture content and to increase germination. Seeds in each provenance were weighed and grouped based on its variation. As lighter weight seeds have low germination potential (Thangjam and Sahoo 2016), only heavier seeds (>50% of the overall average weight for each provenance) were considered for seed germination and evaluation of seedling traits.
2.3 Determination of seed and pod morphometric traits (SPT), germination, seedling growth and biomass
A total of 100 pods from each provenance (10 pods/tree × 10 trees) were measured individually for length (PL), width (PW), weight (PWT), number of seeds per pod (SNP) and seed weight per pod (SWP). In each provenance, extracted seeds were bulked, and then 100 seeds were randomly selected to measure the length (SL), width (SW), thickness (ST) and weight (SWT). Length of the pod was measured using flexible plastic meter tape (between basal end and stylar end); the width was measured by using a digital calliper and weight by using the digital weighing balance.
A total of 100 healthy and undamaged seeds drawn from each provenance were considered for seed germination experiment. Seeds were soaked in a 500 ml beaker containing distilled water for 24 hours. These imbibed seeds were then made into 5 replicates of 20 seeds each and placed in petri dishes (120 mm diameter) with Whatman No 1 filter paper (Sahoo 2007). In total, 1200 seeds were kept in a germinator at a constant temperature (30 ± 2 °C) and 12/12 hr light and darkness for 30 days on 60 petri dishes for the experiment. A seed was considered as germinated when its radicle reached 2 mm (ISTA 1999; Sahoo 2007). Germination was recorded daily until the radicle ceased to emerge (30 days). Germination per cent (GP) was calculated as the number of germinated seeds as a percentage of the total number of the tested seeds, while germination energy (GE) was calculated as the percentage of germinated seed obtained at maximum daily germination speed. Germination index (GRI) and mean germination time (MGT) were calculated following Scott et al. (1984).
At a two-leaf stage, 50 seedlings were transferred to polybags (200 mm × 170 mm) containing sieved garden soil for measuring initial growth parameters. Any kind of organic or inorganic fertilizer, growth hormone or mycorrhiza was not used. These polybags were kept in a completely randomized block design, inside a controlled nursery chamber by maintaining partial shade (50% light intensity). Neither 100% light intensity nor deep shade favours seed germination and seedling growth (Yan and Cao 2007). The seedlings were watered every 2 days in order to maintain an ideal condition of soil moisture. The initial seedling growth parameters, such as length of the radical or coleoptiles, length of root, root collar diameter (CD), biomass etc., were assessed for 25 destructively sampled plants on 90th day while the seedlings were in the two-leaf stage. Same growth parameters were assessed for the remaining 25 plants on 180th day to see the change in growth. Finally, seedling vigour index was estimated by multiplying the seedling length and their respective germination percentage (Abdul-Baki and Anderson 1973). Those provenances having SV values higher than the overall mean were indexed as high vigour (HV) and those lower were termed as low vigour (LV). Average growth rate (AGR) of the seedling was calculated by subtracting initial seedling length from the final length and then divided by the number of days taken for the experiment.
2.4 Statistical analysis
The germination data was used for the analysis of variance (ANOVA) based on a generalized linear model (GLM). GLM was also used to compute the maximum likelihood method to measure provenance and environmental variance (error). All percentage data were arcsine transformed to meet the normality assumptions for the ANOVA analysis (Zar 1996). To draw an analogy between the magnitude of variation caused by provenance and environment, phenotypic coefficient of variance (PCV) and environmental coefficient of variance (ECV) were estimated. Expected mean square for each seed, pod and tree related characters were calculated individually to represent its provenance variance (σpro2) and environmental variance (σe2). Broad sense heritability (h2) was also calculated to determine the per cent of genetic variation contributing to the total variation. The following equations were used to calculate PCV, ECV and h2 (Loha et al. 2006) as:


Pearson correlation was also performed between local climate, geomorphic factors and morphometric traits. Coefficient of variation (CV%), least significant difference (LSD) and Tukey’s post hoc test was calculated between provenances to determine the amount of variability and differences due to seed, pod, tree and seedling growth traits. IBM SPSS Statistics 20 was used for all the analyses with α = 0.05 for all the significance test.
Relative performance of each provenance was determined for overall seed characters, pod characters, germinability and seedling vigour. Weighted factors (Wi) were given to each provenance for every trait based on their morphometric, germinative and growth values. These weights were calculated as:
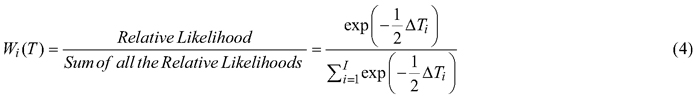
![]()
ΣWi(T) = 1, Tmax is the maximum value of the trait T in the 12 provenances. Values of all the traits were first standardized before calculating weight factor to facilitate ranking of the provenances. The final ranking for the overall characters was estimated by adding the aggregate weight of each provenance.
3 Results
3.1 Seed and pod morphology
The difference in the average values of morphometric characters (pods and seeds) were observed among all the provenances (Fig. 2). Variability as defined by the deviation from the mean value (CV%) was highest for seed weight per pod (30.16%) and followed by seed weight (21.26%) > pod weight (17.81%) > seed number (16.48%) > plant length (14.33%) > pod width (9.74%) > seed thickness (9.47%) > seed length (8.88%) > seed width (5.82%). Pearson’s correlation coefficient among seed and pod morphometric traits showed a significant relationship between seed weight with seed weight per pod and seedling length; pod length with pod weight, seed weight per pod and seed number; pod weight with pod length, seed weight per pod, seed number and seedling length; seed weight per pod with seed weight, pod length, seed number and seedling length; seed number with pod length, pod weight, seed weight per pod and seedling length; and seedling length with seed weight, pod weight, seed weight per pod and seed number (Table 3).
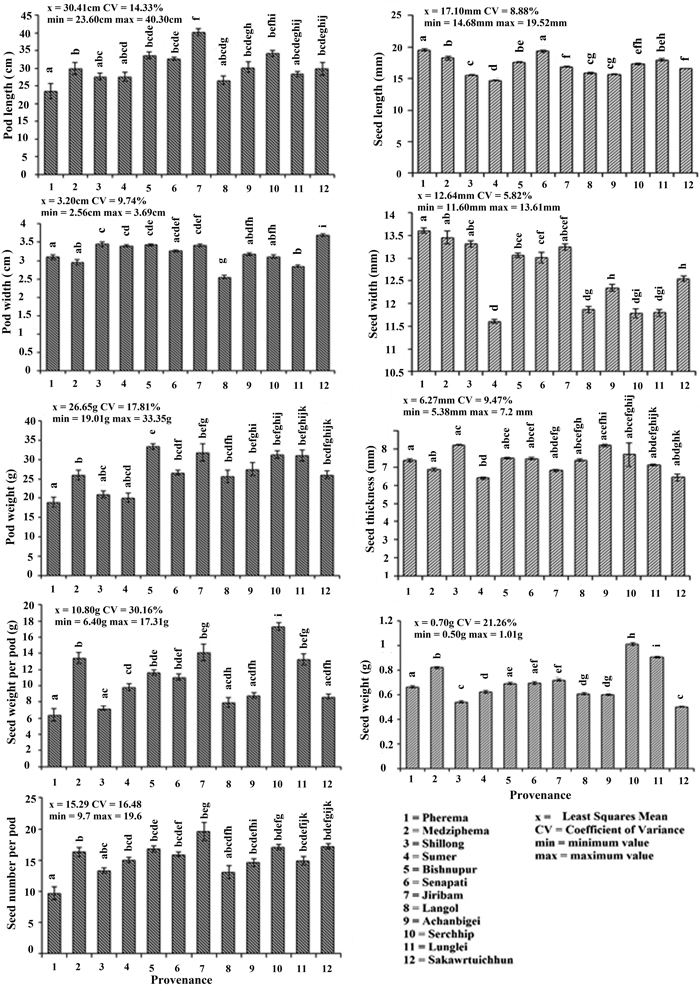
Fig. 2. Morphometric characters of Parkia timoriana in 12 provenances. Tukey’s post hoc test was used for pairwise separations. The values with same letter between the provenances are not significantly different at P < 0.05. View larger in new window/tab.
| Table 3. Pearson’s correlation coefficient between seed and pod morphometric traits (SPT’s) of 12 Parkia timoriana provenances. | ||||||||||
| SPT | PL | PWT | SWP | SNP | GP | GE | SDL1 | CD1 | SDL2 | CD2 |
| SWT | 0.31 | 0.53 | 0.86** | 0.27 | 0.55 | 0.52 | 0.58* | 0.09 | 0.51 | 0.12 |
| PL | 1 | 0.76** | 0.70* | 0.89** | –0.07 | –0.10 | 0.54 | –0.04 | 0.48 | 0.08 |
| PWT | 1 | 0.73** | 0.72** | –0.09 | –0.16 | 0.59* | 0.15 | 0.51 | 0.21 | |
| SWP | 1 | 0.72** | 0.34 | 0.31 | 0.76** | 0.04 | 0.69* | 0.06 | ||
| SNP | 1 | –0.10 | –0.13 | 0.64* | –0.05 | 0.58* | –0.04 | |||
| GP | 1 | 0.99** | 0.23 | 0.34 | 0.14 | 0.48 | ||||
| GE | 1 | 0.18 | 0.26 | 0.09 | 0.44 | |||||
| SDL1 | 1 | 0.12 | 0.97** | 0.19 | ||||||
| CD1 | 1 | 0.13 | 0.78** | |||||||
| SDL2 | 1 | 0.15 | ||||||||
| CD2 | 1 | |||||||||
| * Correlation is significant at P < 0.05 (2 tailed). ** Correlation is significant at P < 0.01 (2 tailed). SWT = seed weight, PL = pod length, PWT = pod weight, SWP = seed weight per pod, SNP = seed number, GP = Germination percentage, GE = Germination energy, SDL1 and CD1 = seedling length and collar diameter at 90 days, SDL2 and CD2 = seedling length and collar diameter at 180 days. Seed length (SL), seed width (SW), seed thickness (ST) and pod width (PW) are not included as they have no significant relationship to any of the traits. | ||||||||||
Seed and pod morphometric traits (SPTs) were also found to be affected by the seasonal distribution of rainfall and temperature (Table 4). Correlation analysis showed winter rainfall as the most important predictor for pod traits while summer temperature was found significant (P < 0.001) for traits related to seed weight. Increase in rainfall during winter and post-monsoon was found to decrease the characters related to pods of P. timoriana. On the other hand, high temperature during summer and post-monsoon season increased seed weight per pod and seed weight. Increase in post-monsoon and winter temperature inversely affected seed thickness. Variation in latitude was also found to affect some of the SPT’s (Table 4). Increase in latitude increased seed width, while decreased pod weight and seed weight per pod.
| Table 4. Pearson correlation analysis showing the effect of seasonal distribution of rainfall and temperature and geography of provenance of Parkia timoriana on the seed and pod traits. | ||||||||||
| WR | MR | PMR | WT | STM | MT | PMT | LAT | LON | ALT | |
| PL | –0.42* | –0.36* | –0.23 | 0.20 | 0.28 | 0.24 | 0.32* | –0.24 | 0.03 | –0.29 |
| PW | –0.48* | 0.12 | 0.12 | –0.10 | –0.11 | –0.19 | –0.10 | 0.05 | –0.42* | 0.09 |
| PWT | –0.22 | –0.43* | –0.14 | 0.08 | 0.29 | 0.28 | 0.29 | –0.52* | 0.18 | –0.19 |
| SWP | –0.46* | –0.27 | –0.40* | 0.39* | 0.53* | 0.41* | 0.48* | –0.46* | –0.03 | –0.28 |
| SNP | –0.51* | –0.34* | –0.26 | 0.23 | 0.31* | 0.26 | 0.35* | –0.31* | –0.10 | –0.21 |
| SL | 0.38* | –0.21 | –0.16 | 0.23 | 0.34* | 0.36* | 0.28 | –0.07 | 0.52* | –0.35* |
| SW | 0.30* | –0.10 | –0.22 | –0.01 | 0.05 | 0.13 | 0.08 | 0.50* | 0.31* | –0.27 |
| ST | 0.09 | 0.00 | 0.31* | –0.30* | –0.29 | –0.30* | –0.36* | 0.03 | 0.152 | 0.32* |
| SWT | –0.18 | –0.10 | –0.34* | 0.40* | 0.56* | 0.42* | 0.43* | –0.47* | 0.087 | –0.25 |
| *Correlation is significant at P < 0.01 (2 tailed). PL = pod length, PW = pod width, PWT = pod weight, SWP = seed weight per pod, SNP = seed number per pod, SL = seed length, SW = seed width, ST = seed thickness, SWT = seed weight, WR = winter rainfall, SR = summer rainfall, MR = monsoon rainfall, PMR = post monsoon rainfall, WT = winter temperature, STM = summer temperature, PMT = post monsoon temperature, LAT = latitude, LON = longitude, ALT = altitude. Summer rainfall (SR) is not included as it has no significant correlation. | ||||||||||
3.2 Seed germination
The average germination rate and energy for each provenance were highest in P1 (91% and 75%, respectively) followed by P7 (83% and 64%, respectively) (Fig. 3). The shortest time to germination (MGT) was found in seeds drawn from P11 (10.19 days), followed by P1 (10.26 days). Geographic and environmental factors had minor effects on germination (Table 5). Therefore, the total variation in both germination percentage and germination energy were largely due to provenance effect (h2 = 76 and 72) (Table 6).
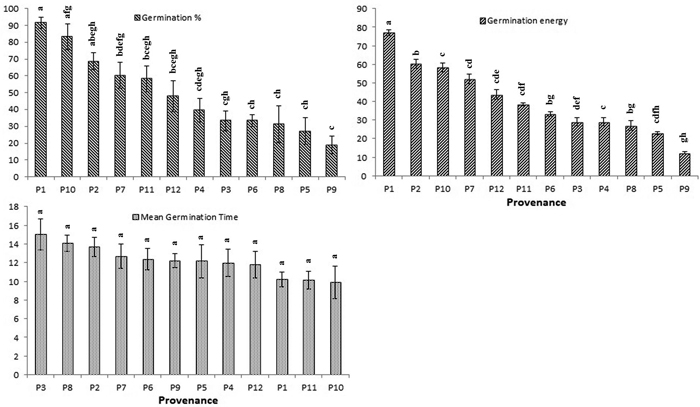
Fig. 3. Effect of different provenance on germination percentage (GP), germination energy (GE) and mean germination time (MGT) of Parkia timoriana. Tukey’s post hoc test was used for pairwise separations. The values with same letter between the provenances are not significantly different at P < 0.05. View larger in new window/tab.
| Table 5. Variance component analysis of seed germination and seedling growth traits of Parkia timoriana. | ||||||
| Source of variation | df | Variance components | Expected mean square | |||
| Germination traits | GP | GE | ||||
| Provenance | 11 | 0.067* | 0.035* | |||
| Error | 48 | 0.021 | 0.013 | |||
| Growth traits | SDL1 | CD1 | SDL2 | CD2 | ||
| Provenance | 11 | 24* | 0.11* | 192.676* | 0.688* | |
| Error | 288 | 38 | 0.032 | 120.113 | 0.141 | |
| df = degree of freedom, GP = germination per cent, GE = germination energy, SDL1 and CD1 = seedling length and collar diameter at 90 days, SDL2 and CD2 = seedling length and collar diameter at 180 days. *Significant at P < 0.05. | ||||||
| Table 6. Broad sense heritability, provenance and environment coefficient of variation for germination and growth characters of Parkia timoriana. | |||
| Characters | Coefficient of variation (%) | Heritability (%) | |
| Provenance | Environment | ||
| Germination Parameters | |||
| GP% | 1.36 | 0.43 | 76.0 |
| GE% | 0.85 | 0.32 | 72.0 |
| Seedling growth parameters | |||
| SDL1 | 8.11 | 10.21 | 38.7 |
| CD1 | 6.98 | 3.77 | 77.5 |
| SDL2 | 13.37 | 10.56 | 61.6 |
| CD2 | 12.39 | 5.61 | 83.0 |
| GP = germination per cent, GE = germination energy, SDL1 and CD1 = seedling length and collar diameter at 90 days, SDL2 and CD2 = seedling length and collar diameter at 180 days. | |||
3.3 Seedling growth
Considerable increase in seedling height, collar diameter and seedling vigour were observed after the 90th day and the 180th day (Table 7). Seedling height calculated by the sum of root length and shoot length was significantly (P < 0.05) higher for P10 compared to the remaining provenances both after the 90th and the 180th day. The slowest rate of growth was observed for P1. However, it was observed that an increase in seedling height does not necessarily follow by increase in its collar diameter. Among all the sites, five provenances namely P1─P2─P7─P10 and P11 displayed high vigour seedling. Highest seedling vigour with an average growth rate of 0.61 cm per day was observed in P10. Correlation analysis between seedling traits with SPT’s and germination traits showed significance for seed weight, pod weight, seed weight per pod and seed number (Table 3).
| Table 7. Seedling growth parameters of Parkia timoriana as affected by different seed sources in Northeast India. | ||||||||
| Provenance/Seed source | Seedling growth parameters | |||||||
| SDL1 ± SEm | CD1 ± SEm | SV1 | SDL2 ± SEm | CD2 ± SEm | SV2 | VI | AGR | |
| P1 | 47.75 ± 0.6 | 5.27 ± 0.04 | 4345.1 | 76.4 ± 0.87 | 7.89 ± 0.05 | 6952.1 | HV | 0.32 |
| P2 | 64.52 ± 1.28 | 4.69 ± 0.02 | 4387.6 | 111.79 ± 2.22 | 6.65 ± 0.03 | 7601.6 | HV | 0.53 |
| P3 | 56.74 ± 1.27 | 4.58 ± 0.02 | 1872.4 | 102.52 ± 20 | 5.62 ± 0.03 | 3383.3 | LV | 0.51 |
| P4 | 56.98 ± 1.15 | 4.33 ± 0.03 | 2279.2 | 100.37 ± 2.22 | 5.86 ± 0.04 | 4014.6 | LV | 0.48 |
| P5 | 53.3 ± 1.1 | 5.01 ± 0.04 | 1385.8 | 91.37 ± 2.12 | 6.78 ± 0.06 | 2375.7 | LV | 0.42 |
| P6 | 54.68 ± 1.14 | 3.44 ± 0.03 | 1804.4 | 87.43 ± 1.52 | 5.11 ± 0.05 | 2885.2 | LV | 0.36 |
| P7 | 70.02 ± 1.97 | 4.69 ± 0.1 | 3991.1 | 120.75 ± 4.17 | 7.56 ± 0.15 | 6882.7 | HV | 0.56 |
| P8 | 62.6 ± 1.46 | 4.32 ± 0.06 | 1940.6 | 111.12 ± 2.80 | 6.94 ± 0.10 | 3444.7 | LV | 0.54 |
| P9 | 59.16 ± 0.99 | 5.45 ± 0.04 | 1064.9 | 102.11 ± 1.96 | 7.13 ± 0.13 | 1837.9 | LV | 0.48 |
| P10 | 72.04 ± 1.02 | 5.31 ± 0.09 | 5979.3 | 126.6 ± 2.01 | 7.23 ± 0.05 | 10507.5 | HV | 0.61 |
| P11 | 67.06 ± 0.82 | 4.7 ± 0.04 | 3889.5 | 113.2 ± 1.41 | 6.52 ± 0.05 | 6565.8 | HV | 0.51 |
| P12 | 61.04 ± 0.45 | 5.19 ± 0.04 | 3296.2 | 102.16 ± 1.06 | 7.04 ± 0.05 | 5516.7 | LV | 0.46 |
| Mean | 60.49 | 4.75 | 3019.7 | 103.82 | 6.69 | 5163.8 | ||
| CV | 14.79 | 12.48 | 50.08 | 16.63 | 13.23 | 50.30 | ||
| SEm | 0.52 | 0.03 | 436.6 | 0.99 | 0.05 | 749.8 | ||
| LSD (P < 0.05) | 3.72 | 0.16 | 1050.2 | 6.98 | 0.25 | 1803.7 | ||
| SDL1 = seedling length (cm) on 90th day, CD1 = collar diameter(mm) on 90th day, SDL2 = seedling length(cm) on 180th day, CD2 = collar diameter(mm) on 180th day, SV = seedling vigour, VI = vigour index, HV = high vigour, LV = low vigour, AGR = Average growth rate (cm/day), SEm = standard error of mean. | ||||||||
3.4 Overall best performing provenances
The studied traits in this experiment were grouped into four categories to give an aggregate rank of performance for each provenance per group. Fig. 4 gives the overall rank of the provenances with respect to their morphological character (seed and pod), germination percentage and seedling vigour. This study found P1 as the best provenance for seed traits and germination traits, P7 showed the highest for pod traits, and P10 got the highest for the overall seedling vigour (SV).
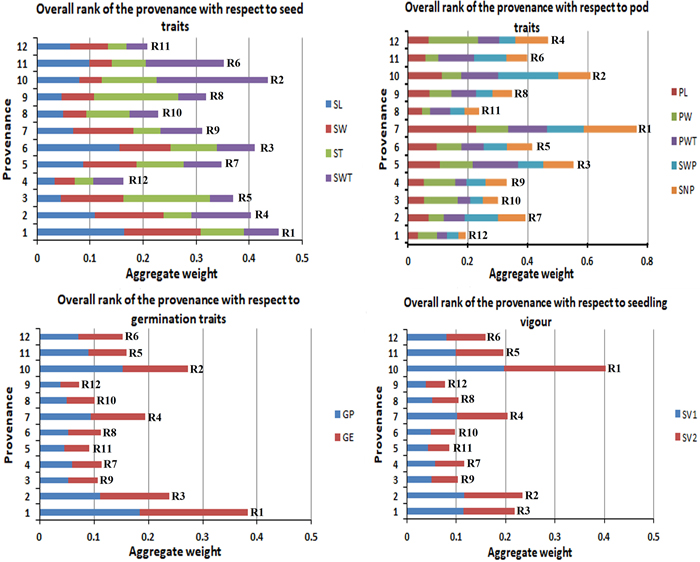
Fig. 4. Overall rank of the provenances with respect to their morphological (seed and pod), germination percentage and seedling vigour.R1 to R12 are the aggregate rank of traits.
4 Discussion
Climatic, topographic, biotic and edaphic factors in each provenance collectively influenced the traits displayed in this study. P. timoriana occurs across a wide geographic range and has concurrently high levels of genetic diversity. In the present study, a substantial variation in the seed and pod morphometric traits (SPT’s) were observed among provenances, with maximum of the variations dominated by provenance effect (except seed thickness). However, the influence of maternal factors such as the position of the seeds in the pod/tree, age of the mother plant, day length, light quality on germinability could not be ruled out for this species as observed by Gutterman (2000). Genetic control of seed and pod morphometric traits has been discussed in many other tree species (e.g. Jayasankar et al. 1999; Gera et al. 2000; Mkonda et al. 2003).
Seed and pod morphometric traits were found to have a significant correlation with rainfall, temperature and latitude. Generally heavier seeds have the advantage to survive under local competition, i.e., higher potential to withstand harsh environment, multiply and advance to next generation. P. timoriana trees grown in regions having drier post monsoon (October to November) and winter season (December to February) have a higher chance of getting longer pod length and pod width with more number of seeds per pod and higher weights of seed, pod and seed weight per pod. However, higher rainfall was associated with longer, wider and thicker seeds in this species. Similarly, temperature had a discernible influence on some pod and seed characters. Higher seed weights were associated with hotter temperature in all the four seasons, while lesser seed thickness was correlated with hotter monsoon and post monsoon temperature. Similar observation between mean annual temperature and seed weights were also reported for Cordia africana (Loha et al. 2006). Correlation of seed and pod morphological traits with the seasonal variation of rainfall and temperature was important, as these factors play a critical role on the overall seed characters during seed development and, subsequently, seedling growth (Wulff 1995). On the contrary, overall synthesis of the effects of rainfall and temperature showed more significant correlation of pod characters towards rainfall and seed characters towards temperature. Since temperature has indirect relationship with altitude and rainfall, all the seed and pod traits that are positively related have negative relation with altitude and rainfall. We also found a significant effect of latitude in determining seed and pod morphology. As latitude increased, there was an increase in seed width, while pod weight, seed weight, seed number per pod and seed weight per pod decreased. Vakshayas et al. (1992) also reported this trend in Dalbergia sissoo, although it was contrary in Albizia lebbeck (Kumar and Toky 1993). However, Winn and Gross (1992) found no significant difference of seed weight across latitudinal gradient. The relationship between seed traits and latitude may be explained with variation in seed disperser assemblages, light availability, plant growth forms and pluviothermic condition (Lord et al. 1997), though other factors could not be ruled out (Moles and Westoby 2003).
There was also a strong correlation among many of the seed and pod morphometric traits. Longer pods of P. timoriana tend to have heavier seeds and more numbers of seeds per pod. Seeds are sinks of photosynthetic assimilates transferred from maternal sources (Alonso-Blanco et al. 1999). Carbohydrates produced in the leaves (source) are transported to developing seeds (Zuo and Li 2014) leading to increase in seed weight. However, leaf senescence in P. timoriana starts as fruit setting begins, and the pigmented pod wall remain as the only functional site of CO2 fixation to support pod growth. Norton and Harris (1975) reported parallel timing of carbon loss in pod wall and growth of seeds. Therefore, during seed developmental stage, the main source of carbon could be the pod wall tissue. Study on the maternal effect of seed weight in Brassica napus (Li et al. 2019) found that differences in pod length changed the photosynthetic area of pod wall, total carbohydrate of pod wall, total carbohydrate of seed and final seed weight. The study also gave the molecular evidence of the association between seed weight and number of seeds per pod by using two different pleiotropic QTLs (Quantitative trait locus). They further suggested that variations in genes causing protein-function changes the expression of the response genes related to pod growth and development, which bring about changes in pod length and finally the photosynthetic area of the pod wall. Simultaneously, the signal from pod wall to seed also changes, affecting the gene expression responsible for seed filling, which finally affect size and weight.
Our findings also correspond with the work of Gera et al. (2000) which states that the degree of germinability varies both within and between populations. A significant difference in germination parameters between provenances was also observed, and the extent of variation was higher for germination percentage than germination energy. Germination of a species is controlled by its genetic origin and its phenotype, i.e. the local conditions in which the seeds set and matured. Out of the total variation, 76% of the germination capacity and 72% of the germination energy were attributed to provenance effect. Under natural conditions, one of the important survival strategies is rapid germination and seedling emergence. Among the 12 provenances, only two provenances took the minimum time for the seeds to germinate. Seeds from these two regions may be a good source for plantations in nutrient poor and highly competitive areas as the chances of survival will be higher with fast-germinating as opposed to slow-germinating seeds. None of the seed and pod morphometric traits were significantly correlated with germination percentage and germination energy; therefore, the seed and pod morphometric traits have little importance in predicting germinability of the seeds of P. timoriana. On the other hand, since the fruits of this species are large and edible, the seed and pod morphology may affect seed dispersal, i.e. endozoochory (Jansen et al. 2002).
Past research of the influence of provenance variation in seedling length and diameter on different tree species has concluded that provenance expression is species-specific (Ibrahim 1996; Jayasankar et al. 1999; Sagth and Nautiyal 2001; Loha et al. 2006). Results from the common environment germination test of P. timoriana indicated a significant difference in seedling length and root collar diameter between the provenances. This suggests genetic control is adequately high for these characters among the provenances. However, a longer measurement period could better explain provenance differences, at least one-third of the rotation of the tree (Loha et al. 2006).
We report that the highest seedling length and vigour was found in Serchhip provenance. This provenance produces a relatively higher seed size and weight than other populations and, presumably, has a higher amount of food reserve contributing to their germination. Positive correlation between seed and pod mass with seedling growth was also observed in this study. This was also reported by Thangjam and Sahoo (2016) for P. timoriana. Another potential determinant used for comparing growth of seedlings between populations is the vigour index. In the present study, 41.6% of the seed source resulted in high vigour seedlings with Serchhip region provided the best seed source in terms of quality seedlings. Although P. timoriana is a self-incompatible tree (Endress 1994), the dwindling populations of its natural pollinators, like fruit bats (Bumrungsri et al. 2008) in these regions, could have resulted in selfing triggered by short-distance pollinators such as fly, ants and bees. This would reduce genetic diversity, vigour and more importantly fruit set of the species population (Koelling et al. 2011). Studies on various woody and non woody species also found that flower abortion and fruit set were corollary of the small number of fertilized ovules caused by insufficient pollination (Shore and Barrett 1984).
Selection is the first stage in classical tree improvement programme. From the various morphometric traits examined in the present study for variation, we found the best provenance representing the highest quality traits. Pherema was selected for seed morphological and seed germination traits while Jiribam for pod morphological traits and Serchhip for seedling vigour trait. These selected provenances may further be used to quantify the trait of importance by using single tree selection or plus tree selection followed by progeny testing.
5 Conclusions
Seed, pod and seedling parameters varied considerably among provenances of P. timoriana. In this study, trees from 12 different provenances were evaluated for morphometric and germinative traits. Further, these traits were correlated with variation in rainfall, temperature and geographical attributes of their origin. Seed quality and seedling growth were highest from trees collected at provenances occurring at low latitude and altitudes. Farmers and breeders are advised to collect seeds from areas that have low winter rainfall, as it associates with longer and broader pods with heavier and more numerous seeds. Since, there were significant differences in seed quality associated with provenance origin, they may be capitalized in the future to develop a tree improvement program with the goal of increasing quality and quantity of seed for this species.
Acknowledgements
UT and PT thank the University Grants Commission, New Delhi and Department of Science & Technology, Government of India respectively for financial help. The Indian Meteorological Department (IMD), Statistical Departments of both Mizoram and Manipur states in Northeast India provided the required climate data used in the present study.
References
Abdul-Baki A.A., Anderson J.D. (1973). Vigor determination in soybean seed by multiple criteria. Crop Science 13(6): 630–633. https://doi.org/10.2135/cropsci1973.0011183X001300060013x.
Alonso-Blanco C., Blankestijn-de Vries H., Hanhart C.J., Koornneef M. (1999). Natural allelic variation at seed size loci in relation to other life history traits of Arabidopsis thaliana Proceedings of the National Academy of Sciences of the United States of America 96(8): 4710–4717. https://doi.org/10.1073/pnas.96.8.4710.
Angami T., Bhagawati R., Touthang L., Makdoh B., Khatri N., Singson L., Bharati K.A., Silambarasan R., Ayyanar M. (2018). Traditional uses, phytochemistry and biological activities of Parkia timoriana (DC.) Merr., an underutilized multipurpose tree bean: a review. Genetic Resources and Crop Evolution 65: 679–692. https://doi.org/10.1007/s10722-017-0595-0.
Bumrungsri S., Harbit A., Benzie C., Carmouche K., Sridith K., Racey P. (2008). The pollination ecology of two different species of Parkia (Mimosaceae) in southern Thailand. Journal Tropical Ecology 24(5): 467–475. https://doi.org/10.1017/S0266467408005191.
Endress P.K. (1994). The diversity and evolutionary biology of tropical flowers. Cambridge University Press, Cambridge, UK. 311 p. https://doi.org/10.1046/j.1420-9101.1996.9010120.x.
Gera M., Gera N., Ginwal H.S. (2000). Seed trait variations in Dalbergia sissoo Roxb. Seed Science and Technology 28: 467–475.
Gutterman Y. (2000). Maternal effects on seeds during development. In: Fenner M. (ed.). Seeds: the ecology of regeneration in plant communities. 2nd ed. CABI Publishing, Wallingford. p. 59–84. https://doi.org/10.1079/9780851994321.0059.
Hopkins H.C.F. (1986). Parkia (Leguminosae: Mimosoidae), Flora neotropica Monograph 43. The New York Botanical Garden, New York.
Hopkins H.C.F. (1994). The Indo-Pacific species of Parkia (Leguminosae: Mimosoidae). Kew Bulletin 49(2): 181–234. https://doi.org/10.2307/4110261.
Ibrahim A.M. (1996). Genetic variation in Faidherbia albida: implications for conservation of genetic resources and tree improvement. Ph.D Thesis, University of Helsinki. 86 p.
ISTA (1999). International rules for seed testing. Rules 1999. Seed Science and Technology 27 Supplement. p. 201–244.
Jansen J.S., Mtika J., Iversen P. (2002). Assessment of provenance trials with Azadirachta species on multiple sites in Tanzania. Forest Genetics 11(1): 63–72.
Jayasankar S., Babu L.C., Sudhakar K., Kumar P.D. (1999). Evaluation of provenances for seedling attributes in teak (Tectona grandis L.F.). Silvae Ganetica 48: 115–122.
Koelling V.A., Hamrick J.L., Mauricio R. (2011). Genetic diversity and structure in two species of Leavenworthia with self-incompatible and self-compatible populations. Heredity 106: 310–318. https://doi.org/10.1038/hdy.2010.59.
Kumar N., Toky O.P. (1993). Variations in pod and seed size among Albizia lebbek provenances. Nitrogen Fixing Tree Research Report 2: 64–67.
Li N., Song D., Peng W., Zhan J., Shi J., Wang X., Liu G., Wang H. (2019). Maternal control of seed weight in rapeseed (Brassica napus L.): the causal link between the size of the pod (mother, source) and seed (offspring, sink). Plant Biotechnology Journal 17(4): 736–749. https://doi.org/10.1111/pbi.13011.
Loha A., Tigabu M., Teketay D., Lundkvist K., Fries A. (2006). Provenance variation in seed morphological traits, germination, and seedling growth of Cordia africana Lam. New Forest 32: 71–86. https://doi.org/10.1007/s11056-005-3872-2.
Longvah T., Deosthale Y.G. (1998). Nutrient composition and food potential of Parkia roxburghii a less known tree legume from northeast India. Food Chemistry 62(4): 477–481. https://doi.org/10.1016/S0308-8146(97)00179-9.
Lord J., Egan J., Clifford H.T., Jurado E., Leishman M.R., Williams D., Westoby M. (1997). Larger seeds in tropical floras: consistent patterns independent of growth form and dispersal mode. Journal of Biogeography 24(2): 205–211. https://doi.org/10.1046/j.1365-2699.1997.00126.x.
Lu P., Parker W.H., Cherry M., Colombo S., Parker W.C., Man R., Roubal N. (2014). Survival and growth patterns of white spruce (Picea glauca [Moench] Voss) range wide provenance and their implications for climate change adaptation. Ecology and Evolution 4(12): 2360–2374. https://doi.org/10.1002/ece3.1100.
Luckow M., Hopkins H.C.F. (1995). A cladistics analysis of Parkia (Leguminosae: Mimosoideae). American Journal of Botany 82(10): 1300–1320. https://doi.org/10.1002/j.1537-2197.1995.tb12664.x.
Mckay J.K., Christian C.E., Harrison S., Rice K.J. (2005). How local is local? A review of practical and conceptual issues in the genetics of restoration. Restoration Ecology 13(3): 432–440. https://doi.org/10.1111/j.1526-100X.2005.00058.x.
Mkonda A., Lungu S., Maghembe J.A., Mafongoya P.L. (2003). Fruit and seed-germination characteristics of Strychnos cocculoides an indigenous fruit tree from natural populations in Zambia. Agroforestry Systems 58: 25–31. https://doi.org/10.1023/A:1025454231002.
Moles A.T., Westoby M. (2003). Latitude, seed predation and seed mass. Journal of Biogeography 30(1): 105–128. https://doi.org/10.1046/j.1365-2699.2003.00781.x.
Norton G., Harris J. (1975). Compositional changes in developing rape seed (Brassica napus L.). Planta 123: 163–174. https://doi.org/10.1007/BF00383865.
Pitcher J.A., Dorn D.E. (1967). A new form for reporting hardwood superior tree candidate. Proceedings of 5th Central States Forest Tree Improvement Conference. Wooster, Ohio, USA. p. 7–12.
Rocky P., Sahoo U.K. (2004). Livelihood generation through tree bean (Parkia roxburghii G. Don) in Imphal West district of Manipur. Journal of Non-Timber Forest Products 11: 135–139.
Sagth H.C., Nautiyal S. (2001). Growth performance and genetic divergence of various provenances of Dalbergia sissoo Roxb. at nursery stage. Silvae Genetica 50(3): 93–99.
Salam J.S., Singh P.K., Dutta B.K., Sahoo U.K. (2009). Chemical composition and nutritive indices in Parkia roxburghii G. Don, a leguminous plant of India. Indian Journal of Agricultural Biochemistry 22: 87–93.
Salam J.S., Singh P.K., Dutta B.K., Sahoo U.K. (2010). Effect of processing and cooking methods on some anti-nutritive toxic components and nutritional constituents in stink bean (Parkia roxburghii G. Don) seeds. Indian Journal of Agricultural Biochemistry 23: 97–102.
Sahoo U.K. (2007). Effect of pretreatments on seed germination and seedling vigour of four different species of Albizzia. Seed Research 35: 124–128.
Sahoo U.K., Upadhyaya K., Lalrempuia H. (2007). Effect of pretreatment and temperature on the germination behaviour of seeds of Parkia roxburgii G Don. Forests Trees and Livelihoods 17(4): 345–350. https://doi.org/10.1080/14728028.2007.9752609.
Savolainen O., Kujala S.T., Sokol C., Pyhäjärvi T., Avia K., Knürr T., Kärkkäinen K., Hicks S. (2011). Adaptive potential of northern most tree populations to climate change, with emphasis on Scots Pine (Pinus sylvestris L.). The Journal of Heredity 102(5): 526–536. https://doi.org/10.1093/jhered/esr056.
Scott S.J., Jones R.A., Williams W.A. (1984). Review for data analysis methods for seed germination. Crop Science 24(6): 1192–1633. https://doi.org/10.2135/cropsci1984.0011183X002400060043x.
Seltmann R., Hensen I., Renison D., Wesche K., Ploch S., Dueñas J.R., Cocucci A., Jung K. (2009). Biparental inbreeding depression, genetic relatedness and progeny vigour in a wing-pollinated treeline species in Argentina. Plant Ecology 205: 155–164. https://doi.org/10.1007/s11258-009-9605-4.
Shore J.S., Barrett S.C.H. (1984). The effect of pollination intensity and incompatible pollen on seed set in Turnera ulmifolia (Turneraceae). Canadian Journal of Botany 62(6): 1298–1303. https://doi.org/10.1139/b84-175.
Thangjam R. (2016). Biotechnological applications for characterization, mass production and improvement of a tree legume [Parkia timoriana (DC.) Merr.]. In: Ahmad N., Anis M., (eds). Plant tissue culture: propagation, conservation and crop improvement. Springer, Singapore. p. 83–99. https://doi.org/10.1007/978-981-10-1917-3.
Thangjam U., Sahoo U.K. (2016). Effect of seed mass on germination and seedling vigour of Parkia timoriana (D.C.) Merr. Current Agriculture Research Journal 4(2): 171–178. https://doi.org/10.12944/CARJ.4.2.06.
Thangjam U., Sahoo U.K., Thong P. (2019). Developing tree volume equation for Parkia timoriana grown in home gardens and shifting cultivation areas of North-East India. Forests Trees and Livelihoods 28(4): 227–239. https://doi.org/10.1080/14728028.2019.1624200.
Vakshayas R.K., Rajora O.P., Rawat M.S. (1992). Seed and seedling traits of Dalbergia sissoo Roxb.: seed source variation studies among ten sources in India. Forest Ecology and Management 48(3–4): 265–275. https://doi.org/10.1016/0378-1127(92)90149-4.
Winn A.A., Gross K.L. (1993). Latitudinal variation in seed weight and flower number in Prunella vulgaris. Oecologia 93:55–62. https://doi.org/10.1007/BF00321191.
Wulff R.D. (1995). Environmental maternal effects on seed quality and germination. In: Kigel J., Galili G. (eds.). Seed development and germination. Marcel Dekker, Inc., New York. p. 491–505. https://doi.org/10.1201/9780203740071-18.
Yan X.F., Cao M. (2007). Effect of light intensity on seed germination and seedling early growth of Shorea wantianshuea. The Journal of Applied Ecology 18: 23–29.
Zar J.H. (1996). Biostatistical analysis. 3rd edition. Upper Saddle River, Prentice-Hall, New Jersey.
Zobel B., Talbert J.J. (1984). Applied forest tree improvement. John Wiley and Sons, New York, p. 75–116.
Zuo J., Li J. (2014). Molecular genetic dissection of quantitative trait loci regulating rice grain size. Annual Review of Genetics 48: 99–118. https://doi.org/10.1146/annurev-genet-120213-092138.
Total of 46 references.
