Franz Holzleitner  ,
Magdalena Langmaier,
Eduard Hochbichler,
Bernhardt Obermayer,
Karl Stampfer,
Christian Kanzian
,
Magdalena Langmaier,
Eduard Hochbichler,
Bernhardt Obermayer,
Karl Stampfer,
Christian Kanzian
Effect of prior tree marking, thinning method and topping diameter on harvester performance in a first thinning operation – a field experiment
Holzleitner F., Langmaier M., Hochbichler E., Obermayer B., Stampfer K., Kanzian C. (2019). Effect of prior tree marking, thinning method and topping diameter on harvester performance in a first thinning operation – a field experiment. Silva Fennica vol. 53 no. 3 article id 10178. https://doi.org/10.14214/sf.10178
Highlights
- No effect on harvester performance due to prior tree marking detected
- Operator selection versus prior tree marking was assessed
- Operator could apply two different thinning methods
- Prior tree marking seems to have a positive effect on residual stand damage.
Abstract
The effect of harvester operator tree selection or prior tree marking in thinning operations on satisfactory results and performance has been widely discussed. In harvester operator tree selection, the machine operator decides on the fly which trees are selected to remain or cut. The objective of the study was to analyze the effect of prior tree marking, thinning method and topping diameter on harvester performance in low-diameter thinning operations. The entire thinning operation was captured using video technology. Overall, 2.36 ha divided into 48 plots with 5202 trees were thinned with an average diameter at breast height (dbh) over bark for all plots of between 12.5 and 14.7 cm. In total, 3122 trees were harvested, resulting in 60% removal of stem number over all plots. The harvester achieved a mean productivity of 7.38 m3 PMH0–1 with 1.48 m3 PMH0–1 SEM, with stem volume having the major influence on harvesting productivity. Prior tree marking, topping and thinning method did not significantly affect productivity. Without prior tree marking by the foresters, harvesting removal was shifted toward lower diameters. Within the unmarked plots, 7.0% of the residual trees were damaged compared with 3.2% in marked plots.
Keywords
productivity;
time study;
harvester;
prior tree marking;
thinning method;
topping diameter;
video analysis
-
Holzleitner,
University of Natural Resources and Life Sciences Vienna, Department of Forest and Soil Sciences, Institute of Forest Engineering, Peter-Jordan-Straße 82/3, A-1190 Vienna, Austria
 https://orcid.org/0000-0001-8489-3050
E-mail
franz.holzleitner@boku.ac.at
https://orcid.org/0000-0001-8489-3050
E-mail
franz.holzleitner@boku.ac.at
- Langmaier, University of Natural Resources and Life Sciences Vienna, Department of Forest and Soil Sciences, Institute of Silviculture, Peter-Jordan-Straße 82/3, A-1190 Vienna, Austria; Austrian Research Centre for Forests, Department of Forest Growth and Silviculture, Seckendorff Gudent Weg 8, A-1130 Vienna, Austria E-mail magdalena.langmaier@bfw.gv.at
- Hochbichler, University of Natural Resources and Life Sciences Vienna, Department of Forest and Soil Sciences, Institute of Silviculture, Peter-Jordan-Straße 82/3, A-1190 Vienna, Austria E-mail eduard.hochbichler@boku.ac.at
- Obermayer, University of Natural Resources and Life Sciences Vienna, Department of Forest and Soil Sciences, Institute of Forest Engineering, Peter-Jordan-Straße 82/3, A-1190 Vienna, Austria; Agricultural Technical School of Pyhra, Kyrnbergstraße 4, A-3143 Pyhra, Austria E-mail bernhardt.obermayer@lfs-pyhra.ac.at
-
Stampfer,
University of Natural Resources and Life Sciences Vienna, Department of Forest and Soil Sciences, Institute of Forest Engineering, Peter-Jordan-Straße 82/3, A-1190 Vienna, Austria
http://orcid.org/0000-0001-9350-2859
E-mail
karl.stampfer@boku.ac.at
-
Kanzian,
University of Natural Resources and Life Sciences Vienna, Department of Forest and Soil Sciences, Institute of Forest Engineering, Peter-Jordan-Straße 82/3, A-1190 Vienna, Austria
http://orcid.org/0000-0002-1198-9788
E-mail
christian.kanzian@boku.ac.at
Received 23 April 2019 Accepted 17 September 2019 Published 25 September 2019
Views 78416
Available at https://doi.org/10.14214/sf.10178 | Download PDF

1 Introduction
Essential silvicultural treatments in young, even-aged stands with small mean diameters and a rather low proportion of high quality saw logs have been postponed during the last few decades. Low or even negative profit margins in thinning operations has caused increasing standing volume and a rising number of unattended young stands (BMLFUW 2015). The growing demand for roundwood in Austria’s timber industry and other woody biomass for heat and power plants increases the chance for a positive profit margin in thinning operations. Furthermore, the emerging bioeconomy industry could boost the demand for woody biomass even more, which is closely associated with increasing prices.
The results of harvester operator tree selection compared with prior tree marking in thinning operations have been widely debated (Bort 2005; Self and Parker 2017; Yeo and Stewart 2001). The selection of trees in fully mechanized cut-to-length (CTL)-thinning operations could be done either by the machine operator during the operation or by marking the trees beforehand. In the past, tree marking prior to harvesting was a common task performed by experienced foresters. To save time and costs, tree marking, which was normally done by a forester, was omitted and performed by the machine operator on the fly.
Prior tree marking in thinning operations could be either done using the leave-tree or selective-marking technique. With the leave-tree method only potential future crop trees which have to be left are marked whereby at selective-marking all trees to be cut are marked. Especially in young dense stands where more trees are to be cut than left, the leave-tree method might be an appropriate alternative as less trees have to be marked. However, this approach also requires clearly outlined harvesting instructions including which not marked trees to cut and experienced operators as they need to select the trees to harvest by themself. Only after first thinning or second thinning is it reasonable to use selective marking techniques owing to the low tree density resulting in less effort for marking (Self and Parker 2017).
Yeo and Stewart (2001) investigated effects on harvester productivity using prior tree marking or operator selection in Pinus radiata D. Don plantations in detail. The overall results did not indicate any differences in harvesting productivity regardless which system were chosen. This is confirming the findings by Kellog and Bettinger (1994), who also had higher total costs for the marked stand than the unmarked when considering both, harvesting costs and additional costs for marking.
Bergström et al. (2010) compared boom-corridor thinning and thinning from below, which resulted in 16% higher harvesting productivity in energy wood production out of young dense stands. The main advantage results from reducing nonlinear and time-consuming crane movements to avoid felling future crop trees owing to one meter wide corridors. The quality of a thinning operation using prior selection or not was investigated by Yeo and Stewart (2000). They evaluated residual stocking and spacing, basal area and tree-related parameters when applying prior tree marking or not in comparable stands. All operators achieved the same stand density and tree diameter distribution with or without prior marking. Even operator selection resulted in a better stand quality than with prior marking.
The effect of prior tree marking on harvester productivity within the scope of thinning operations has already been analyzed in previous studies. Petersons (2010) demonstrated that conducting thinning operations at night, marking trees using a fluorescent color, increased productivity by 15%. In contrast, Kuitto and Mäkelä (1988) reported that operator selection in thinning operations with harvesters is the preferable alternative. Prior tree marking even decreased harvester productivity and concurrently increased damage to the residual stand. However, focusing on the quality of thinning operations, Lageson (1997) stated that a skilled and motivated machine operator is indispensable, especially for keeping stand damage low and reaching the desired stand densities.
For thinning operations in young stands, Eliasson (1999) and Bergström et al. (2007) showed effects on harvester productivity caused by the level of harvesting removal using simulation models. Bergström et al. (2007) documented the benefits of applying area-harvesting systems in young dense stands, especially for biomass supply. Thus, harvesting productivity can be increased by not only handling a single tree per crane movement cycle but also by harvesting all trees in a predefined area. Similar findings are presented by Sängstuvall et al. (2011) showing the advantage of multiple-tree-handling and boom-corridor thinning in young stands based on a simulation study. In this study selective multiple-tree-handling increased harvesting productivity by 20–46% compared to single-tree-handling. Moreover, boom-corridor thinning has increased it up to 199%.
In recent years, heavy thinning from above and final crop tree thinning are mainly discussed thinning methods to be applied in coniferous dominated forests in Austria (Hochbichler et al. 2013). Heavy thinning from above is characterized by selecting 650–800 trees per hectare and removing all other trees. In final crop tree thinning, 350–400 trees per hectare are selected and only main competitors of these trees are harvested. The method used is determined by the forest owner, the responsible forester or the machine operator.
The rapid growth in demand for woody biomass for energy production in Europe resulted in the search for innovative harvesting systems to thin young dense stands. This search includes testing alternative bucking strategies and shifting to lower topping diameter to increase produced volumes and mobilize additional resources for energy production (Bergström et al. 2010, 2012; Jylhä and Bergström 2016).
With the increasing number of thinning operations, the need for prior marking is being discussed frequently. The focus has been on the additional costs for prior tree marking by the forester, but these figures vary widely and are not well documented. Prior tree marking could also increase machine productivity, which directly influences overall timber harvesting costs. Further, tree marking, combined with the geometrical layout of skid trails and their width, influences stand parameters. However, the marking of trees without knowing the technical limitations of the machine can lead to limited productivity. In particular, edge trees along the skid trail could have major effects on the work of harvesters by influencing the optimal positioning of the harvester head (Ovaskainen 2006).
The costs for prior tree marking and the potential efficiency gap because of higher machine productivity could be compared and costs could be compensated. Additionally, prior tree marking could also ensure the quality of the residual stand in terms of stand damage, spatial distribution of residual trees or mean tree diameter distribution of the stand.
The objective of the study was to analyze the effect of tree marking (prior tree marking vs. operator tree selection), thinning method and topping diameter on harvester performance in a first thinning operation.
2 Material and methods
2.1 Thinning methods, tree marking and topping diameter
Two different thinning methods have been implemented. The future crop tree or final crop tree method (FC), which is well applied at the Austrian Federal Forest (Weinfurter 2004) and a variant of heavy thinning method (HA), which was also established at a silvicultural experimental site by Hochbichler et al. (2013) in Austria. In FC 350–400 trees per hectare with an average tree spacing of 5–6 m are selected and 1 to 2 or 3 of the strongest competitors of these trees are removed. HA is characterized by selecting 650–800 trees per hectare, primarily dominant and/or codominant trees with a spatial distribution at a mean distance of 3.5–4.0 m and removing all other trees. For both methods, selection criteria for future crop trees or remaining trees are vitality, stability, quality and spatial distribution.
In the stand used in this study, half of the plots were treated using HA (orange plots) and FC (green plots). Tree selection was determined either as prior tree marking by a forester with ribbons (marked) or by the driver during the working from the cabin of the machine (not marked). Additionally, the set of plots was split into two topping options. On half of the plots, the topping diameter was fixed at eight centimeters and the remaining plots were fixed at four centimeters. The topping diameter was controlled via the onboard software of the machine, which controls the bucking process.
In addition, tree damage, which is defined as the removal of bark and the exposure or destruction of cambium (Howard 1996), was measured in all sample plots before and after the operation. Within these plots, all damage of residual trees bigger than 1 cm2 was examined and classified according to size, location and intensity of the damage using the classification system of Meng (1978). Location was denoted as root, stump, lower part of the trunk (35–100 cm) or upper part of the trunk (>100 cm). The severity of a wound was recorded in the following classes: (1) bark removed and cambium exposed, and (2) bark removed and cambium destroyed. Wound size on the roots, stumps and on the lower part of the trunk was recorded according to the size classes 1–10 cm2, 11–50 cm2, 51–200 cm2 and >200 cm2. Damage located on the upper part of the trunk was estimated by eye.
2.2 Layout and study site
Topping diameter, together with the marking and thinning method, resulted in an experimental layout with 48 plots. Each plot was 20 m wide, from the middle of the strip road to the middle of the next strip road (boom reach), and 25 m long (slope distance), and each plot was labeled with a unique code linking it to recorded plot data and individual tree data (Fig. 1).
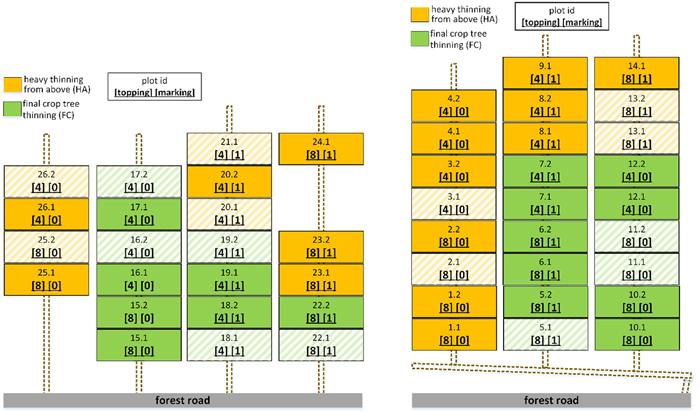
Fig. 1. Scheme of the study sites with harvested plots showing unique parcel ID, topping diameter either [8] cm or [4] cm and if marking was applied [1] or not [0]. Within green plots, final crop tree thinning was performed and in orange plots, heavy thinning from above was done. View larger in new window/tab.
The plots were located on seven skid trails. Colored pegs and ribbons marked plot boundaries and skid trails. Within each plot, every tree above 8 cm diameter at breast height (dbh) was recorded with its tree dimensions, including social tree class according to Kraft (1884) and damage according to the predefined form. The dbh was measured with a classic diameter caliper (Mantax Blue from Haglöf, Sweden). All measurements were recorded in millimeters. Additionally, every tree was marked on the stem using a predefined number code, facing the estimated location of the skid trail. Thus, the number of each tree could be determined exactly during postprocessing using the recorded video data (Fig. 2 and Fig. 3).
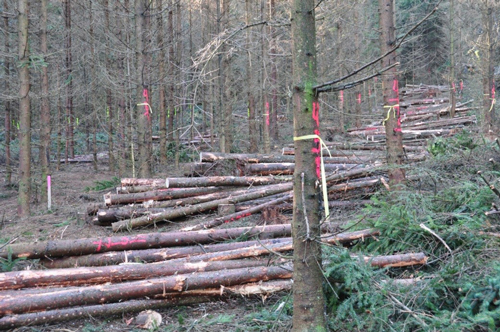
Fig. 2. Thinned plot showing marked trees that remained including pegs for marking boundaries of plots with the center of the skid trail on the right and already bucked assortments on the left.
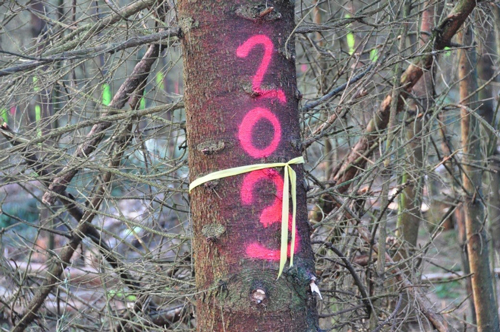
Fig. 3. Marked tree at the study site selected for remaining (yellow ribbon) with its unique identification number at breast height for postprocessing purposes and assigning stand and tree related data.
A fully randomly distributed layout on the site was impossible to implement for two reasons. First, to avoid training effects of the machine operator in term of thinning method, not marked plots were placed such that they would be harvested first. Second, the plots with the same topping diameter were placed adjacently to prevent switching machine settings too often. Shaded boxes represent plots where the captured video data was analyzed in detail for the time study.
The thinning operation took place in the first week of November 2014 under dry weather conditions. The study site was located in northern Austria at Münichreith (48°16´N, 15°06´E), in the southern part of the province Lower Austria, owned by the Austrian Federal Forests. The terrain had a moderate slope with an average inclination of 17% (11–24%) and was without major obstacles. The stand was composed of coniferous (Picea abies (L.) H. Karst. and Larix decidua Mill.) and single broadleaf (Fagus sylvatica L.) trees. The dominant tree species at 98.2% was Norway spruce (P. abies) and scheduled for the first thinning operation. Stem volumes were calculated according to Pollanschütz (1974) using dbh and the estimated tree height, which was based on the developed stand height curve. The stem volume is the entire volume including bark from the fell cut to the top of the tree. Branches are not included. Diameter measurements and estimates of volume were conducted over the bark. The height curve was derived from randomly selected trees covering all plots from the study site. Tree heights were measured with the Vertex IV to decimeters.
In total, 5202 trees on 48 plots with an area of 2.36 ha were recorded with an average dbh over all plots between 12.5 and 14.7 cm. The mean height of 12.58 m results in an average volume over all plots of 0.116 m3 over bark per individual stem (Table 1).
| Table 1. Description of the stand stocking on the 48 studied plots by applied thinning method – heavy thinning from above (HA) or final crop tree thinning (FC), marking and topping diameter. | ||||||||
| thinning method | marking | topping diameter (cm) | mean | std. dev. | 0.05% | 0.95% | mean | number of trees |
| dbh (cm) | dbh (cm) | dbh (cm) | dbh (cm) | stem volume (m3) over bark | ||||
| HA | yes | 4 | 14.3 | 4.5 | 8.4 | 22.4 | 0.126 | 615 |
| no | 4 | 14.4 | 4.6 | 8.3 | 22.4 | 0.128 | 600 | |
| FC | yes | 4 | 13.2 | 3.4 | 8.4 | 19.2 | 0.103 | 753 |
| no | 4 | 14.2 | 3.7 | 8.5 | 20.3 | 0.119 | 615 | |
| HA | yes | 8 | 14.7 | 4.6 | 8.4 | 23.1 | 0.135 | 592 |
| no | 8 | 13.5 | 4.2 | 8.3 | 20.8 | 0.111 | 670 | |
| FC | yes | 8 | 12.5 | 3.7 | 8.0 | 19.5 | 0.093 | 761 |
| no | 8 | 14.4 | 4.3 | 8.5 | 22.2 | 0.127 | 596 | |
The stocking volume at the site ranged from 238 to 260 m3 ha–1. Stand density was between 2024 and 2545 trees ha–1 before harvesting started. Removal differed between 45.6% and 71.1% for cut volume per hectare. The number of trees harvested ranged from 49.6% to 80.5% (Table 2).
| Table 2. Summary of stocking and harvested volumes including stand density and basal area for the studied 48 plots by the applied thinning method and marking treatment. | ||||||||
| thinning method | marking | topping diameter (cm) | volume | stand density | basal area | |||
| stocking (m3 ha-1) | harvested (%) | stocking (n ha-1) | harvested (%) | stocking (m2 ha-1) | harvested (%) | |||
| HA | yes | 4 | 260.2 | 71.1 | 2.034 | 80.5 | 36.3 | 72.8 |
| no | 4 | 261.2 | 48.4 | 2.077 | 62.8 | 36.5 | 51.1 | |
| FC | yes | 4 | 248.2 | 47.5 | 2.077 | 50.1 | 34.9 | 48.0 |
| no | 4 | 261.4 | 46.6 | 2.545 | 50.5 | 37.0 | 47.1 | |
| HA | yes | 8 | 246.9 | 65.1 | 2.263 | 74.4 | 35.1 | 66.4 |
| no | 8 | 270.2 | 48.0 | 2.005 | 60.3 | 37.6 | 50.1 | |
| FC | yes | 8 | 256.9 | 51.5 | 2.024 | 54.7 | 35.7 | 51.9 |
| no | 8 | 233.3 | 45.6 | 2.563 | 49.6 | 34.0 | 46.2 | |
2.3 Machine and operator
For the harvesting operation, a standard three-axle harvester 1170E with a common harvester head H414 was used, both manufactured by John Deere Forestry Oy (Fig. 4). In Austria, it is not compulsory to have any training to work as a harvester operator. This operator, 25 years old, completed vocational training as a forestry worker, which included silvicultural topics, especially how to apply different thinning methods. He was experienced in running harvesters and forwarders and had more than 8000 machine hours, which means that he had already reached the end of his learning curve (Purfürst 2010).
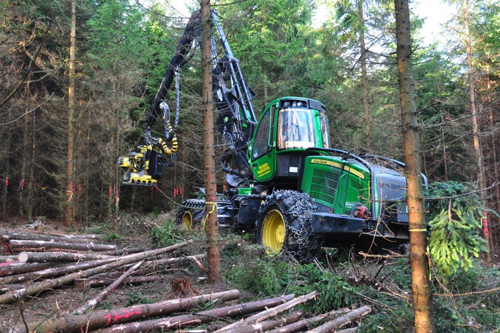
Fig. 4. Harvester John Deere 1170E with H414 harvester head-unit at the thinning operation on the skid trail with already processed logs along the skid trail and the stand to be thinned in front of the harvester.
Before the harvesting operation started, the experiment was explained to the driver. The harvesting instructions also included the mandatory brush mat on the skid trail, which requires processing of trees mainly on the skid trail and bunching of assortments nearby. Because of his education, as he was already familiar with the planned thinning methods in this experiment, only a short briefing was necessary.
Regarding his experience, the driver had worked in 90% of all thinning operations without any prior tree marking. For the applied thinning methods, 80–90% of his past operations could be assigned to heavy thinning from above (HA) whereas the rest were final crop tree thinnings (FC).
Prior tree marking was carried out by the Institute of Silviculture and was not done before the driver had finished all plots without marking to avoid looking at the neighbor plot, comparing, and training himself on the already marked plots. Based on a list of future crop trees and checking of distances between trees by eye, the quality of prior marking was checked during the marking of the site, including the technical limitations for the machine. In this study, only the effect of different thinning methods or marking treatments was tested; the overall productivity of the driver was out of the scope of this study.
2.4 Time and motion study
Owing to high stand densities paired with low visibility of the machinery during the harvesting operation and high workflow rates, an on-site and manually detailed time study at the process level was technically not feasible and risky in terms of safety-related issues. Therefore, the entire thinning operation was recorded using video capturing technology, which was installed above the front windscreen at the protective grating of the machine. Thus, accurate repeatability of all harvesting processes and activities, especially postprocessing, of all recorded data was assured, and the potential risk for research staff owing to active machinery was kept low. Video data was useful for identifying number codes on individual trees because during the field study, the observer standing at a safe distance from the operating machinery had low visibility (Brewer et al. 2018).
After the operation was finished, 16 randomly selected plots were used for carrying out detailed time studies. Selected video data covered the harvesting of all selected plots and was analyzed using the spreadsheet-based tool for carrying out video-based time studies using a desktop computer, which was first developed and programmed by Ari Lauren from Luke (Former METLA) and adapted by the authors. For the time and motion study and the following stem-based analysis, effective working time phases were defined, priorities assigned and recorded (Table 3). All times were measured as effective (net) time without delay (PMH0).
| Table 3. Description of defined work phases with its starting and end point. | ||
| Working phase | Starting point | End |
| driving & catching | starts when the head is fully opened and the top is released | ends with the beginning of the next fell cut |
| felling, delimbing & bucking of logs | starts with the fell cut | ends with the opening of the felling head after processing is finished |
| other work | all activities which are not associated with a tree having a unique identification number | |
| delay | time not related to effective work (e.g., breaks, repairs, etc.) | |
The recorded cycle time study data derived from the video-based analysis was combined with the tree database including stem volumes. All process data were assigned to single stems with its time consumption and additional parameters, such as diameter, volume or lengths.
2.5 Statistical analysis
The productivity was calculated as cubic meters per hour productive time (m3 PMH0–1) excluding delay time (Magagnotti and Spinelli 2012). The underlying hypothesis for all statistics assumes that efficiency (e) is a function of stem volume, tree marking, thinning method and topping diameter (Eq. 1). In all tests, stem volume is considered a continuous variable and all others are treated as factors.
![]()
Using scatter- and boxplots, effects of factors on efficiency were visually evaluated before statistical methods, such as analysis of covariance (ANCOVA) and linear models (lm), were applied to verify the hypothesis. Stem volume as a major effect on harvesting productivity is a well-accepted concept and is known as the “piece-size law”, whereby the relationship between the volume and the productivity can be complex and nonlinear as shown by Visser and Spinelli (2012). To account for nonlinearity of the stem volume, two approaches were used. The first approach used power transformation of stem volume before linear modeling and ANCOVA. To estimate the most appropriate power value, log-likelihoods were computed with the boxcox function of the R package MASS (Venables and Ripley 2002). The power value with the highest log-likelihood was used to transform stem volume before ANCOVA and lm. In addition to power transformation of the stem volume, log-transformation was tested on the dependent variable efficiency. The second approach used generalized additive modeling (GAM), which uses smooth functions, to fit nonlinear data piecewise. For GAM, the function of the same name from the mgcv packages was used (Wood 2011). Diagnosis plots helped to identify outliners. To compare the models, Akaike’s “An Information Criterion” (AIC) was used. Finally, the analysis of residual stand damage was performed following the logistic regression modeling approach using the R package STATS. All data sets were analyzed with the statistical software R (R Core Team 2018).
3 Results
3.1 Implementation of thinning methods
The manner by which both thinning methods were applied is assessed by stand density, volume and basal area. In total, 3122 trees were harvested, which results in 60% removal over all plots. In heavy thinning from above (HA), removal in terms of volumes and numbers of trees was higher. If marking was applied, 65.1% to 71.1% of the stocking volume was removed compared to the operator’s decision with a range of 48.0% to 48.4%. This result is reflected in the number of trees harvested and in the basal area removed within the same treatment (Table 2). From examination of the volume distribution of removed versus remaining trees within HA plots, mainly small trees were cut independent from marking (Fig. 5).
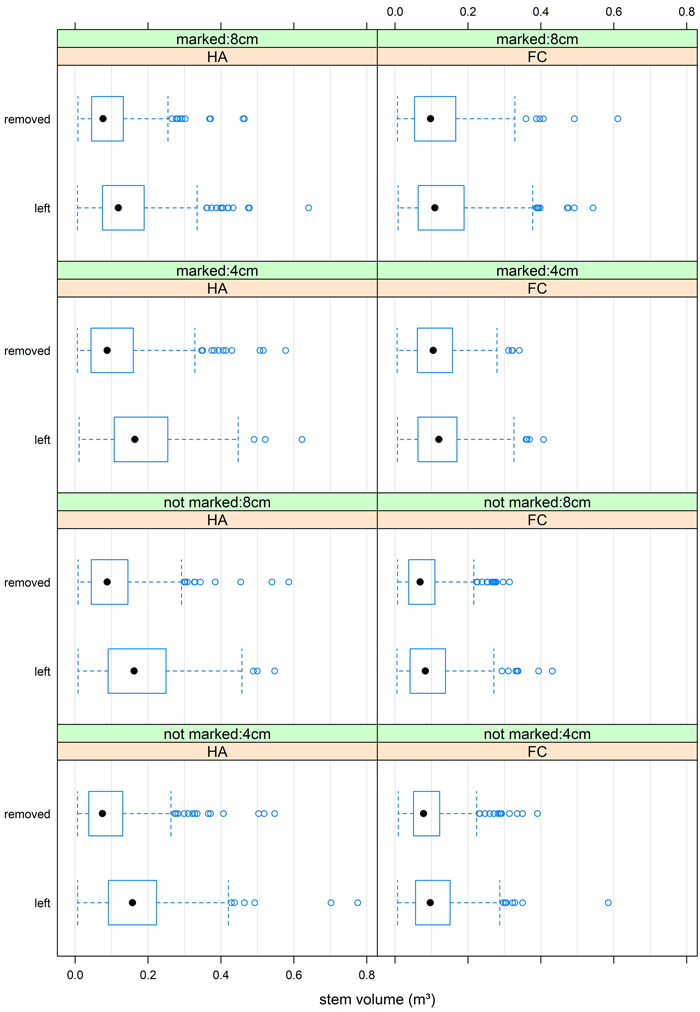
Fig. 5. Single stem volume for removed, as well as left trees, over all plots separated by marking, thinning methods and topping diameter – heavy thinning from above (HA) or final crop tree thinning with removal of the 1–2 strongest competitors (FC).
If selection of final crop trees (FC) was implemented, the driver tended to remove trees with lower volume than in the plots with marking (Fig. 5). Without prior marking, removal was shifted toward lower diameters, but harvested volume ranged from 45.6% to 46.6% (Fig. 5 and Table 2).
Assuming that topping diameter does not influence harvesting removal, number of stems over dbh grouped by marking and thinning method was plotted. Before harvesting the number of trees having low dbh was higher within HA marked compared to HA not marked. Nevertheless marking shows more even distributed dbh after thinning. Stand density in FC not marked was approximately 25% higher than in all other plots. As the amount of stocking volume is like in all the other plots, consequently, dbh distribution shows higher number of low diameter trees. In the not marked FC plots, more trees above 15 cm have been left than in the marked FC plots (Fig. 6).
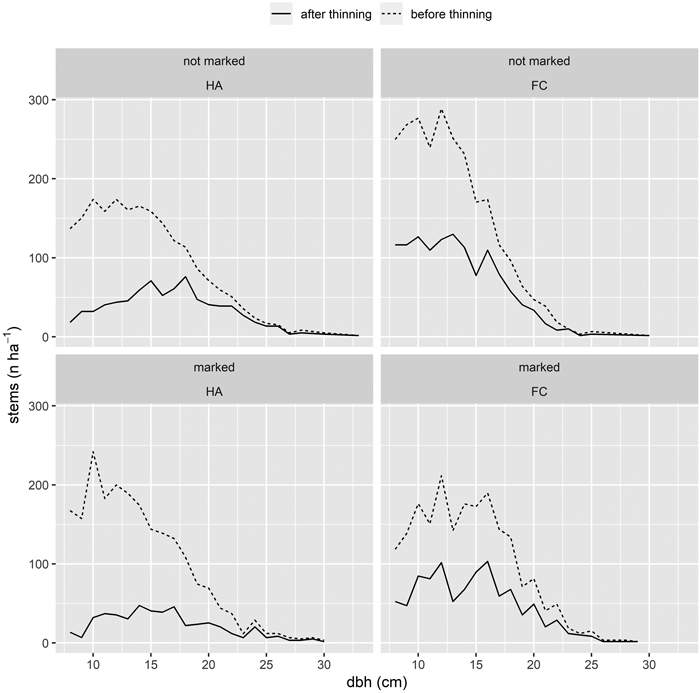
Fig. 6. Diameter at breast height (cm) distributions for marked and not marked and both thinning methods HA and FC before and after harvesting.
3.2 Harvester performance
In total, 1546 cycles were recorded with the video-based time study resulting in 14.03 hours of net time without delays (PMH0) and an average cycle time of 32.7 seconds. Thereof 1039 cycles (68.87%) represent trees with merchantable logs, reaching 33.1 seconds per stem in average. The remaining 507 cycles (31.13%) were used for trees having a dbh lower than 8 cm representing undergrowth. These trees were only felled, cut into pieces and placed directly on the skid trail. The harvester achieved a mean productivity of 7.38 m3 PMH0–1 with a standard error of 1.48 m3 PMH0–1. Out of 1039 harvested trees, 705 could be clearly identified through the numbering during the video analysis. Cycles having a productivity of more than 40 m3 PMH0–1 were treated as outliers and excluded from the analyses, resulting in 685 useable cycles.
Across all treatments, the number of cycles differed slightly. Prior marking reduced the driving and catching times because the operator did not need to search and decide which tree to cut. Within thinning method HA and topping at 4 cm, driving and catching time was lower for marked plots. Topping diameter should not have an effect on driving and catching time per stem and the reason for this difference is unknown. However, this result was not evident for all other plots (Fig. 7).
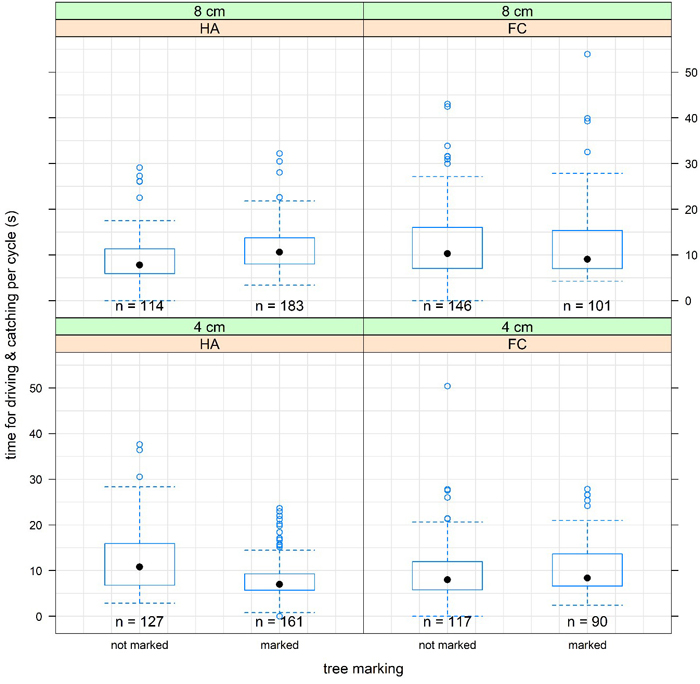
Fig. 7. Time consumption for driving and catching per cycle separated by the factors tree marking, thinning type and bucking instructions. Here, only cycles where numbered trees had been cut are shown.
Similarly, the productivity related to stem volume differed somewhat, although not significantly. Clearly, low volume trees are the majority of harvested trees in all plots, which is typical for a first thinning operation having a high proportion of small trees. Contrary to the expectation that the influence of stem volume on productivity is nonlinear, the scatterplots suggested a linear relationship (Fig. 8).
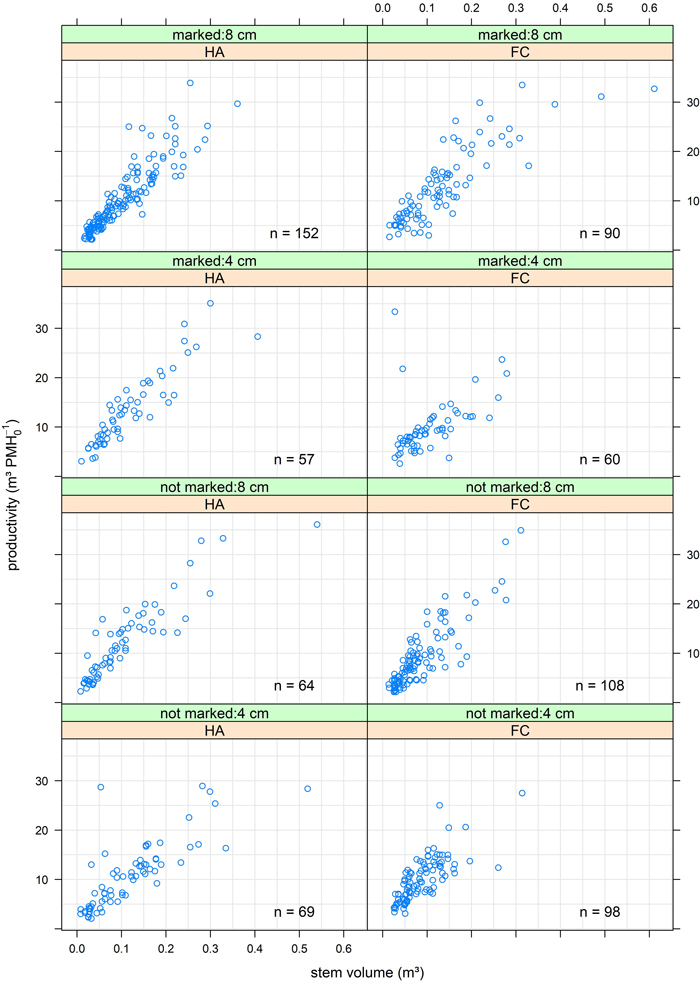
Fig. 8. Productivity as a function of stem volume and experiment option. FC = final crop tree thinning, HA = heavy thinning from above, tree marking “not marked” or “marked” and topping diameter “4 cm” or “8 cm”.
Although there was no clear nonlinearity visible for the stem volume, the stem volume itself was not distributed normally. To obtain a normal distribution for the ANCOVA, a boxcox analysis was done to find the optimal power value (e = 0.424).
An analysis of covariance using transformed stem volume revealed that stem volume had the major effect on harvesting productivity as it explained 70.2% of the variance. Marking, topping and thinning method did not significantly affect productivity. All significant interactions, according to the ANOVA table, explained only 2% of the variance (Table 4).
| Table 4. Analysis of variance of the fitted model (lm) for the listed independent variables and their effect on harvesting productivity (m3 PMH0–1). | ||||||
| Variable | DF | SS | Mean Sq | F-value | p-value | |
| stem volumee | 1 | 21130.0 | 21130.0 | 1757.9586 | <2.2e-16 | *** |
| marking | 1 | 10.1 | 10.1 | 0.8363 | 0.36077 | |
| topping | 1 | 9.2 | 9.2 | 0.7663 | 0.38168 | |
| thinning | 1 | 40.6 | 40.6 | 3.3779 | 0.06651 | . |
| stem volumee × marking | 1 | 25.5 | 25.5 | 2.1198 | 0.14586 | |
| stem volumee × topping | 1 | 237.1 | 237.1 | 19.7243 | 1.043e-05 | *** |
| stem volumee × thinning | 1 | 46.3 | 46.3 | 3.8549 | 0.05001 | . |
| marking × thinning | 1 | 1.6 | 1.6 | 0.1361 | 0.71232 | |
| marking × topping | 1 | 75.2 | 75.2 | 6.2539 | 0.01262 | * |
| topping × thinning | 1 | 5.7 | 5.7 | 0.4704 | 0.49302 | |
| marking × topping × thinning | 1 | 290.9 | 290.9 | 24.2018 | 1.087e-06 | *** |
| Residuals | 685 | 8233.5 | 12.0 | |||
| DF = Degrees of freedom, SS = Sums of squares Signif. codes: *** = 0, ** = 0.001, * = 0.01, . = 0.05 | ||||||
In addition, the data were further analyzed using generalized additive model fitting to detect possible effects fully. With GAM, separate fitted lines for the thinning method were added to the scatterplots, including the standard error. For the cycle times depending on stem volume, there was no difference between HA and FC (Fig. 9). Focusing on marking and stem volume, cycle time fitted lines also did not differ. However, with increasing stem volume, fitted lines diverged (Fig. 10).
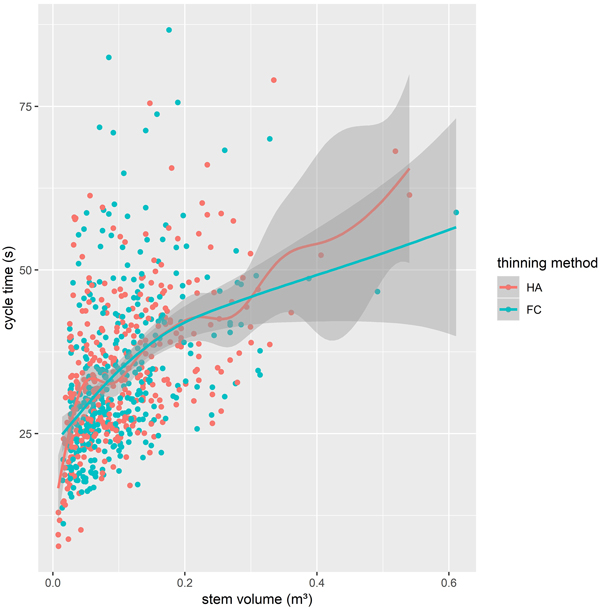
Fig. 9. Dependency of cycle time on the stem volume and thinning method with generalized additive model fitted lines and standard error of the fitted models.
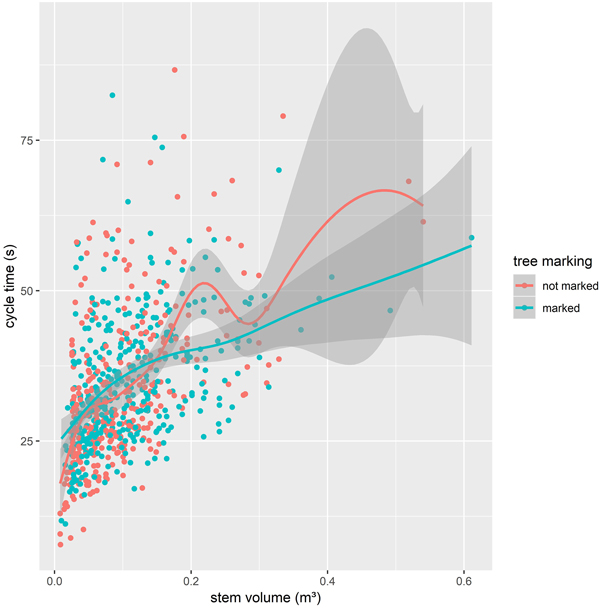
Fig. 10. Dependency of cycle time on the stem volume and marking with generalized additive model fitted lines and standard error of the fitted models.
The GAM analyse shows that for the work phase driving and catching, time needed per stem does not differ between prior marking or harvester operator selection. The same goes for the different thinning methods HA or FC and different topping options.
For net productivity, no real influences of marking, thinning method and topping were detected using GAM analysis (Table 5). Based on the variance results, only marking had a significant effect. For example, the scatterplot showing observed productivity over stem volume grouped by marking emphasizes this finding. Due to the low number of larger trees and independent model fitting in the not marked plots, the GAM fitted lines oscillated (Fig. 11).
| Table 5. Analysis of variance of the fitted generalized additive model (GAM) for harvesting productivity (m3 PMH0–1) as dependent variable showing the significance of the listed effects. | |||||
| Effects | edf | Ref. df | DF | F-value | p-value |
| marking | 2 | 905.211 | <2e-16 | ||
| topping | 1 | 1.773 | 0.1835 | ||
| thinning | 1 | 0.024 | 0.8768 | ||
| marking × thinning | 1 | 1.184 | 0.2769 | ||
| marking × topping | 1 | 3.220 | 0.0732 | ||
| Approximate significance of smooth terms | |||||
| S(stem volume) | 4.254 | 5.253 | 329.9 | <2e-16 | |
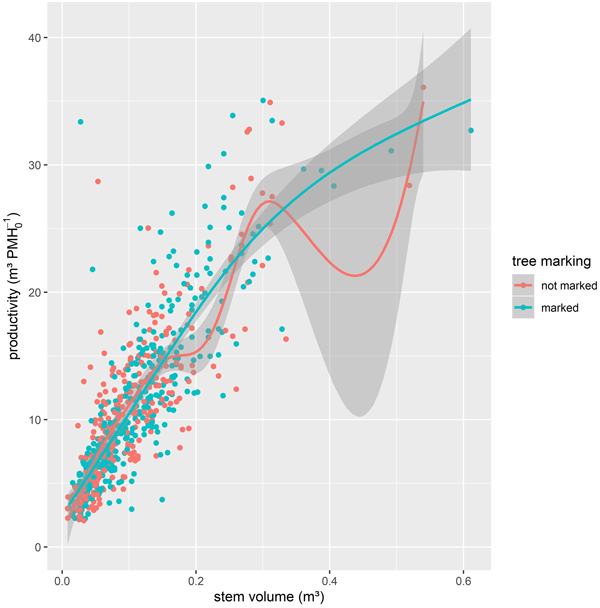
Fig. 11. Harvesting productivity depending on the stem volume and marking with generalized additive model smoothed lines and standard error of the fitted models.
In the next step, the nonsignificant factors thinning and topping were no longer considered. Unexpectedly, this change led to a model with tree marking slightly decreasing productivity. Based on the GAM-model for the mean stem volume of 0.11 m3, an average productivity of 11.11 m3 PMH0–1 on marked plots and 11.25 m3 PMH0–1 on plots without marking was achieved. This result indicates that there was a decrease from marking of 0.14 m3 PMH0–1 (1.2%) compared to harvester operator tree selection. By doubling the mean stem volume, harvesting productivity increased by 69% up to 18.78 m3 PMH0–1 using marking. At this level, the difference was still small at 0.13 m3 PMH0–1 (Fig. 12).
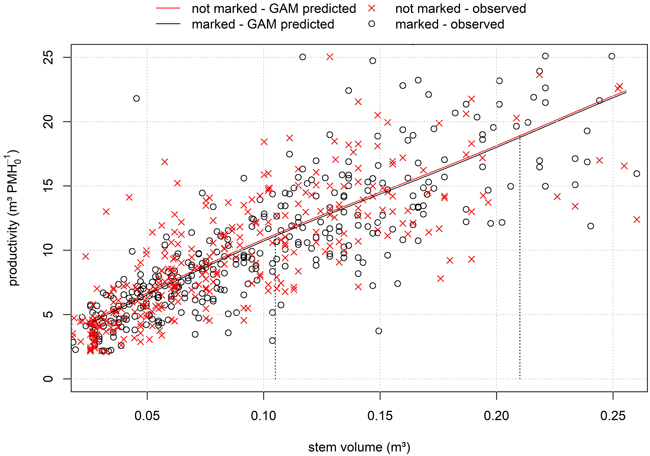
Fig. 12. Productivity depending on stem volume and tree marking using the GAM-model within the 5 and 95% quantiles of measured stem volume.
In addition to harvesting productivity, the residual trees were assessed for harvesting damage because this is of major importance to the future development of the treated stand. Within the not marked plots, 7.0% of the residual trees were damaged. In marked plots, only 3.2% of remaining trees showed damage. Visual interpretation allows the conclusion that marking had an advantage in terms of damage intensity. This advantage was emphasized using logit regression analysis, where marking was highly significant (Table 6).
| Table 6. Modelled probability of a harvest damage to single residual trees (dependent variable) - analysis of coefficients for logit-model. | |||||
| Coefficients | Estimate | Std. error | z-value | Pr(>|z|) | |
| (Intercept) | –2.87919 | 0.40642 | –7.084 | 1.4e-12 | *** |
| marking | –0.78766 | 0.22322 | –3.529 | 0.000418 | *** |
| thinning | –0.20998 | 0.20826 | –1.008 | 0.313332 | |
| topping | 0.09812 | 0.04961 | 1.978 | 0.047930 | * |
| stem volume | –1.51966 | 1.13909 | –1.334 | 0.182172 | |
| Signif. codes: *** = 0, ** = 0.001, * = 0.01, .= 0.05 | |||||
4 Discussion
The objective of this study was to evaluate the effect of prior tree marking, thinning method and topping diameter on harvester’s performance in thinning operations. The main question was how prior tree marking will influence the harvester’s work. However, during the study, the time needed for tree marking was estimated at 10.5 hours ha–1 on average based on field records made during the study. In this study, the experiment was extended by applying two different thinning methods and topping diameters. Both forest owners and entrepreneurs should be consulted during planning of thinning operations based on the obtained results.
As expected, stem volume had the dominant effect on harvesting productivity, as reported in many other studies. However, tree marking was not identified as a key factor affecting productivity. This result is consistent with the findings of Spinelli and Magagnotti (2013) where marking also did not show any increase in harvesting productivity using different marking patterns. Contrary to these findings, Bort (2005) showed an increase of harvester performance by prior marking of 20% and recommended stand preparation by marking future crop trees to ensure silvicultural quality and reduce the ergonomic stress for the machine operator.
However, this result could change significantly with less experienced drivers or drivers poorly meeting the stated harvesting requirements. Similar considerations apply to different thinning methods. Suadicani and Fjeld (2001) reported that only tree size was the main effect in a study of harvesting productivity comparing single-tree selection and group selection.
An influence on time consumption per tree by choosing different topping diameters of 4 cm (selected minimum diameter over bark for energy wood) or 8 cm over bark (minimum top diameter for industrial roundwood in Austria) was not detected in the present study. Determining and analyzing produced volumes of different assortments was not the aim of this study. However, Pasanen et al. (2014) investigated in an early thinning operation the influence of different bucking diameters with 6 and 9 cm over bark on harvestable assortments and volumes. A bucking diameter of 9 cm decreases the accumulation of roundwood by more than 50% compared to 6 cm diameter. Effects on harvesting efficiency in terms of time consumption per tree itself due to adjusted bucking instructions were not discussed. Nevertheless, an integrated recovery of round- and energy-wood resulted in the highest predicted revenues. Thus, future studies could include recording of produced assortments and volumes per tree. This would enable to analyze the impact of different bucking instructions onto produced volumes and harvesting productivity. It has to be mentioned, that lowering topping diameters down to 4 cm could lead to an increasing number of broken logs, as it was observed in the field and video data.
The overall damage to the residual stand is an additional indicator of harvesting performance and confirmed the operator’s capabilities in thinning operations. The stated difference in residual stand damage due to tree marking could be offset by reduced tree damage and high quality saw logs in final fellings and robust stands. The distribution of damage within the present study (3% with prior marking and 7% without marking) is quite low and comparable to the findings of Limbeck-Lilienau (2003) with 3–6% for the winter season for cut-to-length thinning operations with damage increasing to 12–15% in summer. This difference due to prior tree marking could also been caused by the harvesting removal intensity due to prior marking and lower number of future crop trees compared to harvester operator tree selection.
The findings of Jäghagen and Lageson (1996) with 12.7% to 17.0% damaged trees in a thinning operation carried out in Scots pine dominated stands are consistent with the results of Limbeck-Lilienau (2003). Bort (2005) recorded 1.8% damaged future crop trees for prepared thinning operations and 10.7% for harvester operator tree selection. McNeel and Ballad (1992) had similar findings in a thinning operation applying harvester operator tree selection with 5% residual stand damage. In contrast to these low numbers, Bettinger and Kellogg (1993) reported up to 39.8% damaged residual trees after harvester-forwarder operations. Han and Kellogg (1997) found the same damage level of 31.9% to 41.3% in second growth thinning operations applying the cut-to-length method.
However, a skilled machine operator with high performance levels in applying different thinning methods without marking could probably counterbalance the possible differences in harvesting productivity and stand damage. However, this prediction could differ for a less experienced operator or stands that are more diverse. In addition, the high density paired with high removal in this study could mask differences.
Nevertheless, postprocessing of video captured during harvesting activities, using a spreadsheet-based tool, was shown to be of most value. This technology provided detailed and accurate time and motion studies with an opportunity to review sequences as often as needed to clarify fast or unclear sequences and enabled combination with additional data. Following Giles (2006) discussion on the importance of replication in scientific studies, the use of video documentation highly improved reproducibility in comparison to field studies carried out on-site with handheld computers. Furthermore, video documentation of time and motion studies enabled several research questions to be addressed using the same data.
Nuutinen et al. (2008) stated that due to high variability of field study data and its results in intensive time studies of harvesting operations, it is important to consider the skills and experience of the observer. They suggested the use of automated data collection directly from the machine could be a possible future solution to this problem. However, automatically recorded machine data could support time intensive investigations and decrease on-site efforts during field tests or even save time for data recording of stand- or tree-related data. These data should still be compared with manually recorded data to validate it and assess the quality.
In this study, all tree- and stand-related data were recorded before the operation started. This effort could be decreased in the near future by only taking measurements from randomly selected plots as was done during the spreadsheet-based time and motion study. Future studies could benefit from directly using StanForD-data machine data to carry out these kind of studies as was done by Strandgard et al. (2013). Nevertheless, automatically recorded machine data compared with on-site measurements for verification is still valuable to determine the reliability of a dataset.
Acknowledgements
This work has received funding by The Austrian Federal Ministry of Agriculture, Forestry, Environment and Water Management. The authors want to thank the Austrian Federal Forests for providing the studied operation site and the entrepreneur Huber and Tazreiter GmbH including his team for supporting the study. Furthermore, the authors want to thank all reviewers and responsible editors for their valuable input during the preparation of this article.
References
Austrian Federal Ministry of Agriculture, Forestry, Environment and Water Management (BMLFUW) (2015). Datensammlung zum Österreichischen Waldbericht 2015 [Austrian forest report 2015 data collection]. (Online). [In German].
Bergström D., Bergsten U., Nordfjell T., Lundmark T. (2007). Simulation of geometric thinning systems and their time requirements for young forests. Silva Fennica 41(1): 137–147. https://doi.org/10.14214/sf.311. https://doi.org/10.14214/sf.311.
Bergström D., Bergsten U., Nordfjell T. (2010). Comparison of boom-corridor thinning and thinning from below harvesting methods in young dense Scots pine stands. Silva Fennica 44(4): 669–679. https://doi.org/10.14214/sf.134.
Bergström D., Bergsten U., Hörnlund T., Nordfjell T. (2012). Continuous felling of small diameter trees in boom-corridors with a prototype felling head. Scandinavian Journal of Forest Research 27(5): 474–480. https://doi.org/10.1080/02827581.2012.663404.
Bettinger P., Kellogg L.D. (1993). Residual stand damage from cut-to-length thinning of second-growth timber in the Cascade Range of western Oregon. Forest Products Journal 43(11–12): 59–64.
Bort U. (2005). Preparation of stands in mechanized wood harvesting – effects on performance, costs and silviculture. Special Issue of the Journal Nova mehanizacija sumarstva 26(2).
Brewer J., Talbot B., Belbo H., Ackerman P., Ackerman S. (2018). A comparison of two methods of data collection for modelling productivity of harvesters: manual time study and follow-up study using on-board-computer stem records. Annals of Forest Research 61(1): 109–124. https://doi.org/10.15287/afr.2018.962.
Eliasson L. (1999). Simulation of thinning with a single-grip harvester. Forest Science 45(1): 26–34.
Fjeld D., Granhus A. (1998). Injuries after selection harvesting in multi-stored spruce stands – the influence of operating systems and harvest intensity. International Journal of Forest Engineering 9: 33–40.
Giles J. (2006). The trouble with replication. Nature 442: 344–347. https://doi.org/10.1038/442344a.
Han H.-S., Kellogg L.D. (1997). Comparison of damage characteristics to young Douglas-fir stands from commercial thinning using four timber harvesting systems. Proceedings of the Council on Forest Engineering, Rapid City, South Dakota, USA. July 28–30, 1997. 10 p.
Hochbichler E., Lick E., Langmaier M. (2013). Versuchsanlage Bundschuh (Durchforstungsvarianten in hochmontanen Fichtenbeständen). Versuchsanlage und Datenmanagement. Unveröffentlicht. [Experimental design Bundschuh – thinning methods in high montane spruce stands. Experimental design and data management]. Unpublished.
Howard A.F. (1996). Damage to residual trees from cable yarding when partial cutting second-growth stands in coastal British Columbia. Canadian Journal of Forest Research 26(8): 1392–1396. https://doi.org/10.1139/x26-155.
Jäghagen K., Lageson H. (1996). Timber quality after thinning from above and below in stands of Pinus Sylvestris. Scandinavian Journal of Forest Research 11(1–4): 336–342. https://doi.org/10.1080/02827589609382944.
Jylhä P., Bergström D. (2016). Productivity of harvesting dense birch stands for bioenergy. Biomass and Bioenergy 88: 142–151. https://doi.org/10.1016/j.biombioe.2016.03.016.
Kellog L.D., Betting P. (1994). Thinning productivity and cost for a mechanized cut-to-length system in the Northwest Pacific Coast region of the USA. Journal of Forest Engineering 5(2): 43–54. https://doi.org/10.1080/08435243.1994.10702659.
Kraft G. (1884). Beiträge zur Lehre von den Durchforstungen, Schlagstellungen und Lichtungshieben. [Contributions to the teaching of thinnings, clear cutts and shelter wood cuttings]. Klindorth´s Verlag, Hannover. 147 p. [In German].
Kuitto P., Mäkelä M. (1988). Kuormainharvesteri ensimmäisessä ja toisessa harvennuksessa. [Boom-mounted harvester in first and second thinnings]. Metsätehon katsaus. [In Finnish].
Lageson H. (1997). Effects of thinning type on the harvester productivity and on the residual stand. Journal of Forest Engineering 8(2): 7–14.
Limbeck-Lilianau B. (2003). Residual stand damage caused by mechanized harvesting systems. Porceedings of Austro2003: High Tech Forest Operations for Mountainous Terrain, October 5–9, 2003, Schlaegl, Austria.
Magagnotti N., Spinelli R. (eds.) (2012). COST action FP0902 – good practice guideline for biomass production studies. CNR IVALSA, Florence, Italy. 41 p. ISBN 978-88-901660-4-4.
McNeel J.F., Ballard T.M. (1992). Analysis of site stand impacts from thinning with a harvester-forwarder system. Journal of Forest Engineering 4(1): 23–29. https://doi.org/10.1080/08435243.1992.10702641.
Meng W. (1978). Baumverletzungen durch Transportvorgänge bei der Holzernte - Ausmaß und Verteilung. [Tree damages due to transport processes in timber harvesting – extent and distribution]. Landesforstverwaltung Baden-Württemberg, Stuttgart. [In German].
Nuutinen Y., Väätäinen K., Heinonen J., Asikainen A., Röser D. (2008). The accuracy of manually recorded time study data for harvester operation shown via simulator screen. Silva Fennica 42(1): 63–72. https://doi.org/10.14214/sf.264.
Ovaskainen H., Uusitalo J., Sassi T. (2006). Effect of edge trees on harvester positioning in thinning. Forest Science 52(6): 659–669.
Pasanen K., Laitila J., Pykäläinen J., Anttila P. (2014). Using the ComBio decision support system to assess whether energy wood and/or pulpwood should be harvested in young forests. International Journal of Forest Engineering 25(1): 51–65. https://doi.org/10.1080/14942119.2014.903614.
Peterson J. (2010). Factors affecting harvester productivity in forest thinning in Latvia. Annual 16th International Scientific Conference Proceedings, Research for rural development 2010. Jelgava, Latvia, 19–21 May 2010. Volume 1. p. 183–187. ISSN 1691-4031
Pollanschütz J. (1974). Formzahlfunktionen der Hauptbaumarten Österreichs. [Taper curve functions for the main tree species of Austria]. Allgemeine. Forstzeitung Wien 85: 341–343.
Purfürst F.T. (2010). Learning curves of harvester operators. Croatian Journal of Forest Engineering 32(2): 89–97.
R Core Team (2018). R: a language and environment for statistical computing. R Foundation for Statistical Computing, Vienna, Austria. https://www.R-project.org/.
Sängstuvall L., Bergström D., Lämas T., Nordfjell T. (2011). Simulation of harvester productivity in selective and boom-corridor thinning of young forests. Scandinavian Journal of Forest Research 27(1): 56–73. https://doi.org/10.1080/02827581.2011.628335.
Self A.B., Paker R.C. (2017). Thinning pine trees by the leave-tree method. Mississippi State University. Extension. Publication 2832 (POD-05-17).
Spinelli R., Magganotti M. (2013). The effect of harvest tree distribution on harvesting productivity in selection cuts. Scandinavian Journal of Forest Research 28(7): 701–709. https://doi.org/10.1080/02827581.2013.821517.
Strandgard M., Walsh D., Acuna M. (2013). Estimating harvester productivity in Pinus radiata plantations using StanForD stem files. Scandinavian Journal of Forest Research 28(1): 73–80. https://doi.org/10.1080/02827581.2012.706633.
Suadicani K., Fjeld D. (2001). Single-tree and group selection in montane norway spruce stands: factors influencing operational efficiency. Scandinavian Journal of Forest Research 16(1): 79–87. https://doi.org/10.1080/028275801300004433a.
Venables W.N., Ripley B.D. (2002). Modern applied statistics with S. Fourth edition. Springer, New York. ISBN 0-387-95457-0.
Visser R., Spinelli R. (2012). Determining the shape of the productivity function for mechanized felling and felling-processing. Journal of Forest Research 17(5): 397–402. https://doi.org/10.1007/s10310-011-0313-2.
Weinfurter P. (2004). Waldbauhandbuch. Eine Orientierungshilfe für die Praxis. Österreichische Bundesforste AG, Purkersdorf, Austria. [Silvicultural handbook. A guidance for practice]. [In German].
Wood S.N. (2011). Fast stable restricted maximum likelihood and marginal likelihood estimation of semiparametric generalized linear models. Journal of the Royal Statistical Society (B) 73(1): 3–36. https://doi.org/10.1111/j.1467-9868.2010.00749.x.
Yeo B.J., Stewart M. (2000). Thinning Pinus radiata plantation by operator selection: 1. Effects on the residual forest. Australian Forestry 63(4): 284–292. https://doi.org/10.1080/00049158.2000.10674843.
Yeo B.J., Stewart M. (2001). Thinning Pinus radiata plantations by operator selection: 2. Effect on harvesting productivity. Australian Forestry 64(4): 220–225. https://doi.org/10.1080/00049158.2001.10676192.
Total of 41 references.
