Lasse Aro  ,
Anssi Ahtikoski,
Jyrki Hytönen
,
Anssi Ahtikoski,
Jyrki Hytönen
Profitability of growing Scots pine on cutaway peatlands
Aro L., Ahtikoski A., Hytönen J. (2020). Profitability of growing Scots pine on cutaway peatlands. Silva Fennica vol. 54 no. 3 article id 10273. https://doi.org/10.14214/sf.10273
Highlights
- The potential wood production on cutaway peatlands can be high
- Afforestation with seeding or planting was profitable at 3% rate of interest
- In northern Finland, the afforestation method, ditch spacing and fertilization affected the bare land value.
Abstract
A major after-use option for former peat harvesting areas has been afforestation. The profitability of afforestation with Scots pine trees (Pinus sylvestris L.) was studied in two 31–32-year old experiments in southern and northern Finland. The stands were established by seeding and planting, and various fertilization treatments and drainage intensities were tested. The financial performance for each plot was assessed in three steps. First, the costs occurred during the measurement time were summed up according to their present value. Then, for the rest of the rotation (i.e., from the age of 31/32 onwards) the stand management was optimized in order to maximize the net present value (MaxNPV). Finally, bare land values (BLVs) were calculated by summing up the present value of costs and the MaxNPV and converting the sum of the series into infinity. The afforestation method did not affect the mean annual increment (MAI; 9.2–9.5 m3 ha–1 a–1) in the southern experiment. In the northern experiment the afforestation method, ditch spacing and fertilization had significant effects on the MAI of the stands. The average MAI of the planted pines was 8.9 m3 ha–1 a–1, and for seeded pines it was 7.5 m3 ha–1 a–1. The BLV at an interest rate of 3% was positive for all stands in both regions. In the northern region afforestation method, ditch spacing and fertilization also had a significant effect on the BLV. When the interest rate was 5%, almost two thirds of the stands had a negative BLV in both regions.
Keywords
Pinus sylvestris;
afforestation;
bare land value;
financial performance;
peat cutaway area;
stand-level optimization
-
Aro,
Natural Resources Institute Finland (Luke), Bioeconomy and environment, Itäinen Pitkäkatu 4A, FI-20520 Turku, Finland
E-mail
lasse.aro@luke.fi
-
Ahtikoski,
Natural Resources Institute Finland (Luke), Natural resources, Paavo Havaksentie 3, FI-90570 Oulu, Finland
 https://orcid.org/0000-0003-1658-3813
E-mail
anssi.ahtikoski@luke.fi
https://orcid.org/0000-0003-1658-3813
E-mail
anssi.ahtikoski@luke.fi
-
Hytönen,
Natural Resources Institute Finland (Luke), Natural resources, Teknologiakatu 7, FI-67100 Kokkola, Finland
http://orcid.org/0000-0001-8475-3568
E-mail
jyrki.hytonen@luke.fi
Received 18 November 2019 Accepted 24 June 2020 Published 30 June 2020
Views 115060
Available at https://doi.org/10.14214/sf.10273 | Download PDF

1 Introduction
The current peat production area in Finland is about 68 000 hectares, from which annual peat harvesting area covers about 50 000 hectares. In addition, some tens of thousands of hectares are reserved for peat production in the future. Considerable amounts of peatlands will be released from peat harvesting in Finland as well as in other countries. In Finland, it has been estimated that more than 100 000 ha of former peat bogs will have been transferred to new means of land use by 2020. In Ireland approximately 50 000 ha of peatlands will be released for afforestation within 30 years (Renou and Farrell 2005) and in the Baltic countries (Estonia, Latvia and Lithuania) over 26 200 ha of cutaway peatlands have already been abandoned today (Karofeld et al. 2017).
Forestry is considered to be the major re-use option for cutaway peatlands in the main peat producing countries, Finland (Selin 1999; Laasasenaho et al. 2017), Ireland (Renou and Farrell 2005) and Sweden (Hånell et al. 1996). Afforestation is also accepted as a suitable after-use scenario in Estonia (Ramst et al. 2006 as cited by Kikamägi et al. 2014), Latvia (Priede and Gancone 2019) and Lithuania (Karofeld et al. 2017). However, cutaway peatlands differ considerably from conventional peatland forests in regard to their soil properties (Hytönen and Aro 2012; Hytönen et al. 2018). They are characterized by variation in peat thickness (from zero to more than one meter), a low pH level, high nitrogen (N) amounts, and low phosphorus (P) and potassium (K) amounts in the remaining peat layer (Aro et al. 1997; Kikamägi et al. 2014; Hytönen et al. 2018). Unbalanced nutrition makes afforestation challenging, often requiring soil amelioration. Without soil improvement measures, cutaway peatlands can remain unvegetated for a long time, natural regeneration is slow and thus not practicable, and cultivated tree seedlings will grow weakly until death (Salonen 1992; Aro et al. 1997; Hytönen et al. 2016). Forestry is favored by shallow, well humified bottom peat with a good carrying capacity and an existing road network. Fine-textured sub-soil is nutritionally an advantage, but can lead to additional ditch network maintenance due to silting of ditches. Low-lying peat cutaway areas which are not possible to be drained using conventional ditching, are not suitable for forestry.
Scots pine (Pinus sylvestris L.) has been the most common tree species used for afforestation of cutaway peatlands in Finland. In peat cutaway areas, pine plantations can be established by seeding, planting and in some cases even from natural regeneration (Kaunisto 1987; Aro et al. 1997). Due to the challenging conditions, the recommended planting density has been higher than in normal forestry (2500 seedlings ha–1 or even more, Aro et al. 1997; Aro and Kaunisto 2003). Due to the low amounts of mineral nutrients (e.g., K and P) in the residual peat, fertilization is usually required for successful afforestation (Kaunisto 1981; Hytönen et al. 1995; Aro et al. 1997; Aro and Kaunisto 2003; Renou-Wilson and Farrell 2007; Renou-Wilson et al. 2008; Bussières et al. 2008; Huotari et al. 2008, 2009; Kikamägi et al. 2013, 2014). If the thickness of the remaining peat layer is more than 30–40 cm, fertilization may need to be repeated several times (Aro and Kaunisto 2003) because the trees are seldom able to grow their roots into the underlying mineral sub-soil and uptake mineral nutrients from the sub-soil in such conditions (Aro 2000).
The profitability of afforestation is hampered by the need for fertilization or soil preparation and drainage, as well as planting costs and young stand treatment. However, due to the high nitrogen content of the peat, the wood production potential can be high if a shortage of mineral nutrients does not limit the tree growth (Aro and Kaunisto 2003). However, lack of knowledge on profitability of afforestation with Scots pine trees can be a hindrance to the decision making by land owners.
Our main aim was to investigate the profitability of afforestation with Scots pine trees on cutaway peatlands. Technically, the past silvicultural costs and stand projections (achieved through stand-level optimization) were combined and further converted to a sum of series into infinity, i.e., the bare land value (BLV, interchangeably the soil expectation value SEV). This measure was needed in order to commensurate the financial performance since the rotation periods of the ongoing rotation fluctuated considerably between plots. We analyzed the best practice forest management alternatives and evaluated the most important factors impacting the profitability of growing Scots pine stands on former peat harvesting areas.
2 Material and methods
2.1 Study sites and experimental design
Two old Scots pine afforestation experiments on cutaway peatlands were chosen for this study in northern and southern Finland (Table 1). They represent site conditions which are typical for currently released former peat production areas in Finland, e.g., the topography is flat, the remaining peat layer is shallow having high N content, and the drainage is in good condition. The northern experiment (Exp-N) is located on the Hirvineva mire in Liminka (64°43´N, 25°17´E) and the southern experiment (Exp-S) is located on the Satamakeidas mire in Honkajoki (62°01´N, 22°19´E). The long-term (1981–2010) mean annual temperature and precipitation were 2.6 °C and 486 mm in the northern experiment, respectively. The temperature sum (+5 °C threshold) was 1107 degree days (d.d.). Corresponding values for the southern experiment were 4.0 °C, 624 mm and 1222 d.d., respectively.
| Table 1. Basic information on the afforestation experiments (Exp-N and Exp-S) of Scots pine on cutaway peatlands. Timing of treatments: month/year. | |||
| Treatment /Experiment | Exp-N | Exp-S | Comment |
| Ditching and mounding | 10/1986 | 10/1987 | |
| Ditch spacing | 15 and 40 m | 40 m | |
| Planting | 6/1987 | 5/1988 | density 2500 seedlings/ha |
| Seeding | 5/1987 | 5/1988 | density 2500 seeding points/ha |
| Afforestation fertilization | 6/1987 | 5/1988 | P 1.8 and K 3.4 g/seedling |
| 1st re-fertilization | No | 5/1993 | P 4.5 and K 8.0 g/seedling |
| Seedling stand clearing | 5/2003 | 10/1998 | naturally born birch removed |
| 2nd re-fertilization | No | 5/2002 | P 45 and K 80 kg ha–1 |
| Tending of seeded stands | No | 4/2003 | |
| Stand measurement | 11/2018 | 9/2018 | |
| No. of replications | 3 | 5–6 | n = 5 for seeding in Exp-S |
Both sites were prepared for afforestation via ditching and soil preparation (lifting and spreading soil from ditches onto nearby peat surfaces) during the autumns of 1986 and 1987 (Table 1). Scots pine stands were established by planting (1-year-old container seedlings) or seeding (ca. 15 seeds per seeding point) during the springs of 1987 and 1988. Half (Exp-N) or all (Exp-S) of the planting and seeding points were fertilized with small amounts of phosphorus and potassium during their establishment (Table 1). In addition, Scots pine stands of the Exp-S were re-fertilized twice before stand measurements. Until the age of 31 or 32 years, no commercial thinnings were carried out in either of the experiments. Exp-S was established according to a completely randomized design where the plot size was either 20 m × 60 m or 20 m × 95 m. The ditch spacing was 40 m in the Exp-S, and strips of 40 m in width were divided in half in order to get 20 m wide plots before randomizing treatments. Exp-N had a randomized block design. In Exp-N the ditch spacing was 15 or 40 m, and the size of the plots was either 15 m × 40 m or 20 m × 40 m.
According to present knowledge, phosphorus fertilization in peatland forests has a long-lasting effect, often extending over 30 years (Silfverberg and Hartman 1999; Silfverberg and Moilanen 2008; Moilanen et al. 2015). A second re-fertilization was thus considered to be unnecessary in Exp-S. The first re-fertilization, according to present knowledge, should have been done as a broadcast application (PK fertilizer 500 kg ha–1) and not as a spot treatment (Table 1). Therefore in our calculations we also included a management option with only one re-fertilization before the first commercial thinning.
The mineral soil type under the remaining peat layer was sorted silt and medium sand in the Exp-N and Exp-S, respectively (Aro et al. 1997). At the afforestation stage, the thickness of the remaining peat layer varied from 2 to 59 cm at the Exp-N site (mean 27 cm) and from 0to 91 cm at the Exp-S site (mean 27 cm, Aro et al. 1997). The concentrations of extractable (extracted with acid ammonium acetate, pH 4.65) P, K and calcium (Ca) were 2.3 mg l–1, 24.7 mg l–1 and 181.6 mg l–1 in the 10-cm-thick mineral sub-soil layer beneath the peat layer of the Exp-N site (Aro et al. 1997). Corresponding concentrations of P, K and Ca of the Exp-S site were 2.8 mg l–1, 3.4 mg l–1 and 23.1 mg l–1, respectively (Aro et al. 1997). Prior to the fertilization treatments, the concentrations of total N, P and K in the surface peat layer were 21.0, 0.483 and 0.102 g kgdw–1 in the Exp-N, respectively (Aro et al. 1997). Corresponding concentrations of total N, P and K were 15.6, 0.374 and 0.039 g kgdw–1 at the Exp-S site, respectively (Aro et al. 1997). Both sites were classified as Vaccinium myrtillus site types (Mtkg) according to the Finnish classification system (Laine et al. 2012).
2.2 Stand measurements and tree data
Tree stands were measured 31 (Exp-S) or 32 (Exp-N) growing seasons after their establishment. For the measurement of the trees at the Exp-N site, one sub-sample plot (216 m2) extending from the drainage ditch to the middle of the strip was established in each plot (sampling density 27%). At the Exp-S site two or three sub-sample plots (200 m2) were established on each plot (sampling density 32–33%). The tree species, survival and the diameter (mm) at a height of 1.3 m (DBH) were recorded or measured for each of the trees. However, on the Exp-N site a few naturally born trees (downy birch, Betula pubescens Ehrh., silver birch, B. pendula Roth and Norway spruce, Picea abies (L.) Karst.) were measured when the DBH exceeded 45 mm. In addition, the height (precision of measurement, one dm) and the height of the lower living crown limit of the same tree (precision one dm) were measured from sample trees (every 10th Scots pine). For other Scots pine trees, the height was calculated using site-specific height functions (Näslund 1936). The height of naturally born downy birches was measured for every tree on the Exp-S site. On the Exp-N site, the height of naturally born birches was calculated using functions developed from similar aged birch stands at Hirvineva (Hytönen et al. 2018). The DBH and height distributions of trees according to the species and treatments are presented in Fig. 1 and 2. For each plot the last measurement data (biological age of 31 or 32 years for seeded pines, 32–33 years for planted pines) constitute an initial stand structure which was further fed into the MOTTI growth simulator producing stand projections (see below). There was no fertilization effect on tree growth left at the time of the last measurement since the time after the 1st or 2nd re-fertilization was too long (Hökkä et al. 2012).
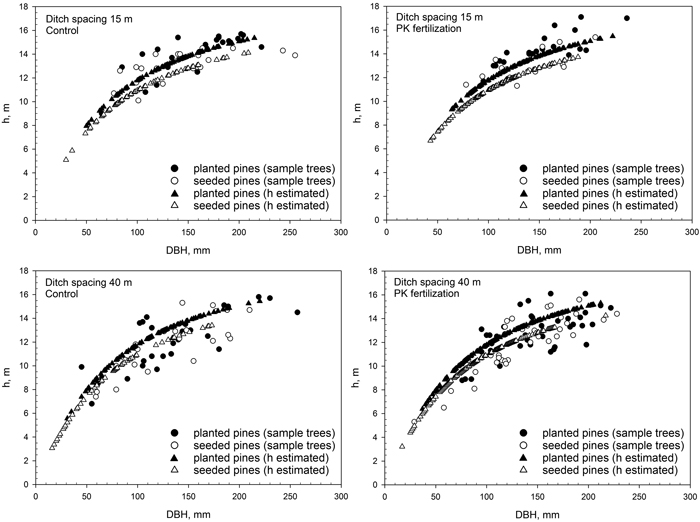
Fig. 1. The height and DBH distribution of Scots pine trees according to treatments in the afforestation experiment at the Exp-N site after 32 growing seasons since the stand establishment (naturally born trees included). Fertilization treatments: Control and PK fertilization with phosphorus and potassium during the afforestation stage. The ditch spacing is 15 or 40 m. The number of replications was three for all treatments. View larger in new window/tab.
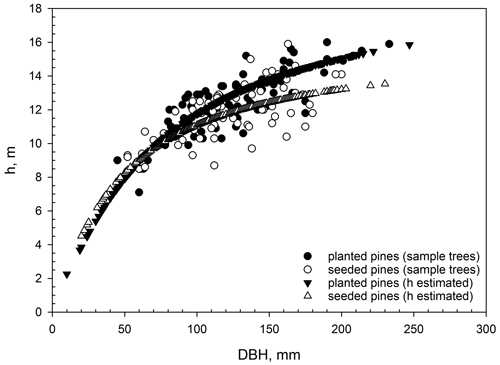
Fig. 2. The height and DBH distribution of Scots pine trees according to treatments in the afforestation experiment at the Exp-S site after 31 growing seasons since the stand establishment (naturally born trees included). The ditch spacing is 40 m.
2.3 Financial analyses
The financial performance of each plot was assessed in three stages. First, the costs which occurred during the measurement time (i.e., between 0and 31/32 years) were summed up according to their present value so that the point of decision was the time of the stand establishment. We applied the following formula:
![]()
, where PVcosts = the present value of the silvicultural cost ck, k = 1,…,m, € ha–1, l = the time after establishment, in years (Note L refers to the biological age of a plot at the beginning of the simulation s.t. L ≤ 32 years), b = the discrete time discount factor, i.e., b = 1/(1+r) and r is the annual interest rate (here either 3% or 5%).
Then, for the rest of the rotation (i.e., from the age of 31/32 onwards to full rotation) we applied the landowner’s optimization problem as a discrete-time system of state and control variables (Tahvonen et al. 2013; Juutinen et al. 2018). Let ![]() describe a stand state before the ith thinning at stand age ti, i = 1,…,T (so that tT corresponds to Tth thinning which is a clearcut). Further,
describe a stand state before the ith thinning at stand age ti, i = 1,…,T (so that tT corresponds to Tth thinning which is a clearcut). Further, ![]() denotes growing stock (expressed as m3 ha–1), which is further affected by silvicultural measures
denotes growing stock (expressed as m3 ha–1), which is further affected by silvicultural measures ![]() such as ditch network maintenance and/or fertilization occurring in time tn = 0,…,M. Then, k presents timber assortments (k = 1, …,K) and a stumpage price (€ m–3) for each timber assortment k is denoted by pk. The removal (in m3) of each timber assortment k in ith thinning is denoted by hki. Thinning intensity (removal relative to growing stock) in ith thinning is gi. For a private forest owner the net present value was maximized as follows:
such as ditch network maintenance and/or fertilization occurring in time tn = 0,…,M. Then, k presents timber assortments (k = 1, …,K) and a stumpage price (€ m–3) for each timber assortment k is denoted by pk. The removal (in m3) of each timber assortment k in ith thinning is denoted by hki. Thinning intensity (removal relative to growing stock) in ith thinning is gi. For a private forest owner the net present value was maximized as follows:
![]()
, where the optimized variables are the number of thinnings,T; the timing of thinnings, ti, i = 1,…,T; the intensity of thinnings, gi, i = 1,…,T; and the number, M, and timing ,tn, n = 1,…,M, of silvilcultural measures. Thinning profile was described by three thinning points determining the relative diameter distribution for remaining stock, and timings of thinnings were set to fluctuate between –20% and +20% relative to silvicultural recommendations (for further details, see Ahtikoski and Hökkä 2019, p. 1104–1105). Thinning intensity as well as number of thinnings were set to be unconstrained. The revenues (in Eq. 2; pkhki) are valued at stumpage since stumpage prices are shown to reflect adequately e.g. logging conditions and the strength of end-product markets (Brown et al. 2012). Further, the profitability was here assessed from the viewpoint of a private forest owner who is eventually paid the stumpage price.
Since the timing of the clear-cut of the ongoing rotation fluctuated due to stand-level optimization, a soil expectation value, SEV (interchangeably bare land value, BLV or land expectation value; see Straka 2010; Chang 2013) as a criterion was applied. This enables a solid comparison between different management schedules involving different rotation lengths (Bettinger et al. 2009). Technically this was done by summing up the present value of the costs during the measurement time (Eq. 1) with the discounted MaxNPV value (Eq. 2) and converting this to a sum of series into infinity (Tahvonen et al. 2013). Thus, we assumed that future generations would be established according to practice applied in the ongoing rotation, although this might not be an optimal solution for the early development (years 0–31/32). However, measured observations provided reliable information on the early development of trees on cutaway peatlands. Currently, such information is not included in any growth model. Finally, the aim was to maximize the present value of bare land (Faustmann 1849):

, where BLV = the bare land value for plot, € ha–1, PVcosts = the present value of silvicultural costs, € ha–1 (see Eq. 1) and MaxNPV = the maximum net present value obtained through stand-level optimization, € ha–1 (see Eq. 2), t0 = the time point when the simulation of the ongoing rotation was initiated, here either in year 31 or 32, ts = the time for final cut, years and b = the discrete time discount factor, i.e. b = 1/(1+r) and r is the annual interest rate.
Stand projections were generated using the MOTTI stand simulator. MOTTI is a stand-level decision-support tool for assessing the effects of forest management on stand dynamics (Salminen et al. 2005; Hynynen et al. 2015; Juutinen et al. 2018). The MOTTI consists two sets of models: stand-level and individual-tree level models, both based on an empirical-statistical modelling approach (e.g., Hynynen et al. 2015). In this study, however, only individual-tree level models were utilized because after the last inventory (stand age of either 31 or 32 years) the plots had passed the phase for which the stand-level models were designed. In the MOTTI there are six individual-tree-level model sets to capture the growth dynamics (for a detailed description of the MOTTI, see Juutinen et al. 2018, Appendix B). So far the MOTTI stand simulator has been widely applied in stand-level growth and yield analyses (Hynynen et al. 2005; Kojola et al. 2012; Haapanen et al. 2016; Huuskonen et al. 2020) and for stand-level optimization (Ahtikoski et al. 2018; Juutinen et al. 2018; Ahtikoski and Hökkä 2019).
The interaction between the growth simulator and the optimization algorithm (PIKAIA; see below) worked as follows. The MOTTI generated stand projections providing the objective function values (see Eq. 1) for the optimization algorithm in return for decision variables (see a similar approach in Valsta 1992 and Niinimäki et al. 2012). Technically, the Pikaia optimization is a public domain software based on a genetic algorithm (Charbonneau and Knapp 1995; Metcalfe and Charbonneau 2003). Genetic algorithms (first introduced and developed by Holland 1975) use computer programs to simulate the evolutionary process. They are based on the mechanics of natural selection and natural genetics (Darwin’s evolution principle) and combine an artificial survival of the fittest algorithm with genetic operators abstracted from nature (Holland 1975; Goldberg 1989; Li et al. 2010; Hayyolalam and Kazem 2020).
In the optimization procedure the parameter space included seven parameters, i.e. decision variables (see Pukkala 2009; Arias-Rodil et al. 2015) representing a7th dimensional multimodal function. For a detailed description of these seven parameters, see Ahtikoski and Hökkä (2019, p. 1105, Table 2; excluding ditch network maintenance and fertilization). Technical details related to the MOTTI stand simulator and PIKAIA algorithm applied for stand-level optimization are reported in Ahtikoski et al. (2012), Ahtikoski and Hökkä (2019) and Juutinen et al. (2018).
| Table 2. Applied stumpage prices (€ m–3) and silvicultural costs (€ ha–1) in real terms. | ||
| Stumpage prices | ||
| Felling method | Saw logs ,€ m–3 | Pulpwood, € m–3 |
| First commercial thinning | 41.75 – 41.84 – 37.26 a) | 12.69 – 14.88 – 12.11 |
| Other thinnings | 50.08 – 49.73 – 41.40 | 15.62 – 19.32 – 14.80 |
| Final cut | 59.13 – 58.94 – 48.66 | 18.29 – 23.48 – 17.83 |
| Silvicultural costs, € ha–1 | ||
| Ditch network maintenance | 185.80 | |
| Manual planting | 697.60 | |
| Manual seeding | 217.60 | |
| Fertilization | 314.50 | |
| Early pre-commercial thinning | 356.50 | |
| a) In each line the first value (e.g., 41.75) applies for pine, the second (41.84) for spruce and the third (37.26) for other tree species, in most cases birches. | ||
Price and cost data were obtained from the official statistics for the years 2002–2016 (Luke Statistics 2018). These time series present a long enough time period to capture business cycles so that the derived averages would include both peak and bottom prices and costs. The original and nominal time series (Luke Statistics 2018) was deflated by the cost-of-living index (Statistics Finland 2018, base year 2017) in order to attain real prices and costs. Both the stumpage prices and silvicultural costs in real terms are presented in Table 2.
2.4 Statistical analyses
The effects of treatments on the tree stand yield and financial profitability were tested using ANOVA with the IBM SPSS Statistics 25 software.
3 Results
3.1 Mean annual increment and rotation period
Depending on afforestation method and rate of interest, the mean annual increment (MAI) of stem wood varied from 9.2 to 9.5 m3 ha–1 a–1 and the MAI of the saw logs varied from 4.9 to 5.5 m3 ha–1 a–1 in southern Finland (Exp-S, Table 3). The corresponding rotation periods were 69–72 years in the optimized growing of Scots pine stands. The afforestation method did not significantly affect the MAI or rotation period (Table 3). In the total yield of the stands, the proportion of downy birch was negligible during the rotation. Growing planted Scots pine stands according to Finnish silvicultural recommendations (Äijälä et al. 2014) resulted in an MAI of 7.5 m3 ha–1 a–1 and the MAI of the saw logs was 4.2 m3 ha–1 a–1.
| Table 3. The effect of the afforestation method on the rotation period, mean annual increment of stem wood (MAI) and saw logs (MAI_saw logs), and bare land value (BLV) with two rates of interest at the site in southern Finland (Exp-S; sd = standard deviation). In the financial analysis, 1rf includes one and 2rf two re-fertilizations before the first commercial thinning. | ||||
| Variable | Rate of interest (%) | Treatment (mean ± sd) | p-value | |
| Planted | Seeded | |||
| Rotation (a) | 3 | 71.0 ± 0.9 | 71.8 ± 1.3 | 0.259 |
| 5 | 70.3 ± 0.5 | 68.6 ± 3.2 | 0.220 | |
| MAI (m3 ha–1 a–1) | 3 | 9.5 ± 0.6 | 9.4 ± 0.6 | 0.756 |
| 5 | 9.3 ± 0.7 | 9.2 ± 0.8 | 0.812 | |
| MAI_saw logs (m3 ha–1 a–1) | 3 | 5.5 ± 0.2 | 5.3 ± 0.3 | 0.227 |
| 5 | 5.3 ± 0.2 | 4.9 ± 0.2 | 0.014 | |
| BLV_2rf (€ ha–1) | 3 | 2519.0 ± 405.5 | 2993.4 ± 389.0 | 0.081 |
| 5 | –380.5 ± 211.7 | 40.6 ± 157.0 | 0.005 | |
| BLV_1rf (€ ha–1) | 3 | 2742.5 ± 405.6 | 3216.0 ± 388.2 | 0.081 |
| 5 | –235.3 ± 207.0 | 190.0 ± 157.4 | 0.004 | |
The afforestation method, ditch spacing and fertilization had significant effects on the MAI of Scots pine dominated stands in northern Finland with both of the used interest rates (Exp-N; Table 4, Fig. 3). The average MAI for the planted pines was 8.9 (with both discount rates) and for seeded pines it was 7.3–7.5 m3 ha–1 a–1 (with the interest rates of 5 and 3%, respectively). The average MAI for pines was 8.8 m3 ha–1 a–1 (with both rates of interest) with ditch spacing of 15 m. When the ditch spacing was 40 m, the average MAI for pines was 7.4 m3 ha–1 a–1 (discount rate 5%) and 7.6 m3 ha–1 a–1 (3%). Fertilization significantly increased the MAI of the seeded pines (Fig. 3): from 6.6 to 8.4 m3 ha–1 a–1 (discount rate 3%) and from 6.4 to 8.3 m3 ha–1 a–1 (discount rate 5%). With an interest rate of 3%, the MAI of the saw logs was significantly higher for the planted pines (4.9 m3 ha–1 a–1) than for the seeded pines (3.6 m3 ha–1 a–1, Table 4). With a discount rate of 5% both afforestation methods and ditch spacing significantly increased the MAI of the saw logs: for seeded and planted pines they were 3.6 and 4.7 m3 ha–1 a–1, and with ditch spacings of 40 and 15 m 3.7 and 4.3 m3 ha–1 a–1, respectively. The corresponding mean rotation periods for optimized growing of the stands ranged from 65 to 84 years, and they were not affected by the treatments (Table 4). Depending on the treatments and the rate of interest, growing the stands based on silvicultural recommendations (Äijälä et al. 2014) resulted in the overall MAI and the MAI of the saw logs 77–89% and 63–87% of those obtained by the optimized growing alternative, respectively. In general, the shortest rotation periods were obtained by using Finnish silvicultural recommendations (Fig. 4).
| Table 4. The effect of the afforestation method, ditch spacing and fertilization on the rotation period (a), mean annual increment of stem wood (MAI, m3 ha–1 a–1) and saw logs (MAI_saw logs, m3 ha–1 a–1), and bare land value (BLV, € ha–1) with two rates of interest (%) for the Exp-N site (ANOVA p-values). | ||||||||
| Source/variable | Rotation | MAI | MAI_sawlogs | BLV | ||||
| Interest rate | 3 | 5 | 3 | 5 | 3 | 5 | 3 | 5 |
| Afforestation (A) | 0.247 | 0.180 | <0.001 | <0.001 | <0.001 | <0.001 | 0.003 | 0.327 |
| Ditch spacing (D) | 0.350 | 0.693 | 0.001 | <0.001 | 0.309 | 0.006 | 0.002 | <0.001 |
| Fertilization (F) | 0.504 | 0.278 | 0.001 | 0.009 | 0.176 | 0.058 | 0.050 | 0.009 |
| Block | 0.206 | 0.170 | 0.100 | 0.128 | 0.109 | 0.054 | 0.021 | 0.024 |
| A*D | 0.079 | 0.262 | 0.268 | 0.520 | 0.808 | 0.637 | 0.552 | 0.529 |
| A*F | 0.937 | 0.555 | 0.008 | 0.005 | 0.545 | 0.830 | 0.174 | 0.147 |
| D*F | 1.000 | 0.693 | 0.081 | 0.268 | 0.433 | 0.094 | 0.138 | 0.036 |
| A*D*F | 0.722 | 0.782 | 0.872 | 0.667 | 0.627 | 0.830 | 0.745 | 0.836 |
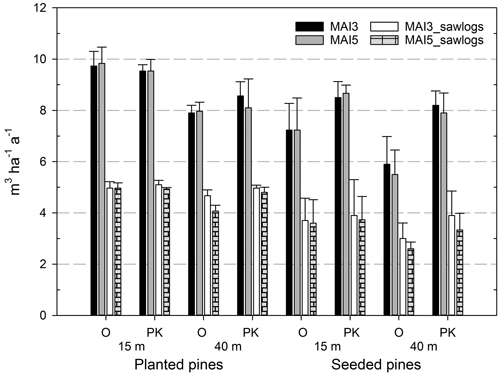
Fig. 3. Mean annual increment of stem wood (MAI) and saw logs (MAI_sawlogs) of Scots pine dominated stands at the northern Finland site (Exp-N) during a rotation period. The fertilization treatments consisted of a control (O) and fertilization with phosphorus and potassium during the afforestation stage (PK, see Table 1), and with ditch spacing of 15 and 40 m. The rates of interest are 3 and 5% (e.g., MAI3 and MAI5). The standard deviation is shown on top of the bars.
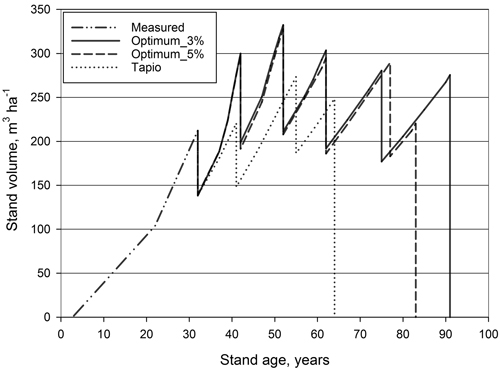
Fig. 4. Measured and predicted stand volume as a function of stand age, ongoing rotation (an example for a seeded pine stand, with ditch spacing of 15 m and no fertilization during the afforestation stage). Steeper curves are associated with the optimum (compared to Finnish recommendations, i.e. Tapio; Äijälä et al. 2014) and are due to repeated fertilizations.
3.2 Bare land value
Depending on the number of fertilizations before the first commercial thinning, the bare land value (BLV, 3% rate of interest) was 2519–2743 € ha–1 for the planted Scots pine stands and 2993–3216 € ha–1 for the seeded pine stands in southern Finland (Exp-S). Further, the BLVs were not significantly affected by the afforestation method at an interest rate of 3% (Table 3). However, at a 5% rate of interest the BLV for the seeded Scots pine plantations was significantly higher than the BLV for the planted pines (with both one and two re-fertilizations, Table 3). However, increasing the interest rate to 5% led to very small or even negative financial results.
The BLV (with a rate of interest of 3%) was significantly affected by the afforestation method, ditch spacing and fertilization at the site in northern Finland (Exp-N) (Table 4, Fig. 5). The maximum BLV (3087 € ha–1) was obtained for planted pine stands which had been drained intensively but not fertilized during the afforestation stage. The weakest financial result (1102 € ha–1) was achieved by seeding pine stands and using 40 m ditch spacing without fertilization. Thus, all the stand management alternatives produced positive financial results. Generally, the BLVs were higher in planted than in seeded pine stands, and higher for those stands with a ditch spacing of 15 m rather than 40 m (Fig. 5).
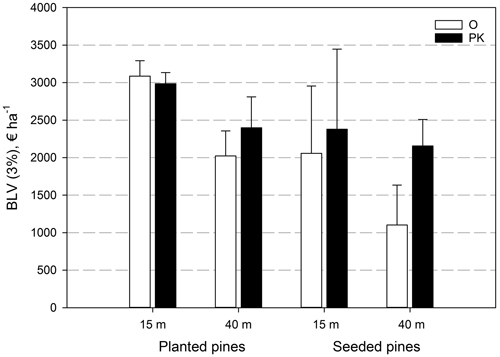
Fig. 5. The bare land value (BLV) of different growing alternatives of Scots pine dominated stands on the test sites in northern Finland (Exp-N) at a 3% rate of interest. The fertilization treatments consisted of a control (O) and fertilization with phosphorus and potassium during the afforestation stage (PK, see Table 1), and with ditch spacing of 15 and 40 m. The standard deviation is shown on top of the bars.
With an interest rate of 5%, the BLVs were significantly higher for those stands with a ditch spacing of 15 m than for those with ditch spacing of 40 m (Table 4). However, the BLV was only positive for two growing alternatives of intensive drainage: planted pine stands without fertilization (10 € ha–1) and seeded and fertilized pine stands (79 € ha–1). In those stands with a ditch spacing of 40 m, fertilization significantly increased the BLVs although they remained negative (from –456 to –232 € ha–1 for planted pine stands and from –461 to –22 € ha–1 for the seeded stands).
Depending on the treatments and climatic region, the BLV of growing options based on silvicultural recommendations (Äijälä et al. 2014) was 40–68% of the optimized growing alternative (with a rate of interest of 3%).
4 Discussion
This study demonstrated the financial feasibility of growing Scots pine trees on cutaway peatlands and management options affecting the profitability at the stand level. Since the oldest afforestation experiments were only 31–32 years old, the rest of the rotation period was simulated using a stand growth simulator including variables for ditch network maintenance, fertilization and thinnings to achieve stand level optimization. During the afforestation stage, soil preparation if the site has a shallow peat layer or fertilization using mineral nutrients is needed to ensure the establishment and early growth of tree seedlings (Kaunisto 1979, 1987; Aro et al. 1997; Huotari et al. 2008; Hytönen et al. 2016). Later, one or on thick-peated cutaway peatlands even two re-fertilizations are possibly needed (Aro and Kaunisto 2003). However, the experimental sites of our study had a shallow peat layer (mean peat thickness 27 cm), which would allow tree roots to grow into the mineral subsoil (Aro 2000). Therefore, based on present day knowledge, some of the fertilization treatments in the southern experiment were repeated too often before the first commercial thinning, i.e., before the initiation of the simulation in this study. This was taken into account by deleting the costs of such treatments in one of the studied growing alternatives. We also assumed that first refertilization (4.5 g P per seedling) did not increase growth.
Depending on the treatments and the rate of interest used in the calculations (either 3% or 5%), the mean annual increment (MAI) varied from 5.9 to 9.8 m3 ha–1 a–1 at the sites during the rotation. On the southern site the results indicated very fertile site conditions corresponding to herb-rich or herb-rich heath forests of the same region in the 11th National Forest Inventory (9.0 m3 ha–1 a–1 in southwestern Finland, Korhonen et al. 2017). Undoubtedly, this was due to the high nitrogen content of the site and repeated PK fertilization. In nitrogen rich peatland forests, PK or wood ash fertilization has also increased stand growth considerably (Moilanen et al. 2002, 2004, 2005, 2015; Hökkä et al. 2012). At the southern test site the coarse-textured mineral sub-soil had a low mineral nutrient content and thus fertilization was the main source of mineral nutrients during the first 15 years. Later on, fertilization was repeated for stand level optimization if it affected financial results positively. On the northern site, the MAIs also revealed fertile site conditions corresponding to herb-rich forest, herb-rich or mesic heath forests, depending on the treatments, in comparison to the 11th National Forest Inventory (6.5–9.1 m3 ha–1 a–1 in the coastal areas of Northern Ostrobothnia in Finland; Korhonen et al. 2017).
The MAI for the Scots pine stands which had undergone similar treatments (with a ditch spacing of 40 m and afforestation fertilization) were almost similar on the northern (7.9–8.6 m3 ha–1 a–1) and southern sites (9.2–9.5 m3 ha–1 a–1). However, on the northern site (Exp-N) the mineral sub-soil was more fertile with a higher content of fine particles than the southern site (Exp-S). Since both sites had a shallow peat layer, tree roots were probably able to penetrate the bottom mineral soil (Aro 2000). Thus pines were able to extract more mineral nutrients on the site of the northern experiment than on the site of the southern experiment. Consequently, the tree growth was almost as good on the northern site as on the southern site. On the other hand, the pines on the southern site, but not on the northern site had been re-fertilized before the first simulated commercial thinning. Thus the results indicate that the quality of the bottom mineral soil can have a significant influence on the wood production potential of the site if the peat layer is shallow.
Prior to concluding the financial results one essential point needs to be highlighted. Namely, in this study the revenues were based on stumpage prices, which are basically a natural-resource rent that can be directly observed as a market price (Hultkrantz et al. 2014). Earlier studies on stand-level maximization and BLVs in Finland are in majority based on roadside prices subtracted logging costs (Hyytiäinen et al. 2006; Cao et al. 2010; Tahvonen et al. 2013; Tahvonen and Rämö 2016). The bare land value (BLV) at a 3% interest rate was positive for all stands in both regions, in southern and northern Finland. With a 3% interest rate, the optimized growing of Scots pine was less profitable in northern (2157–2400 € ha–1) than in southern (2519–2993 € ha–1) Finland with similar treatments (i.e., with ditch spacing of 40 m and afforestation with fertilization). These positive financial results will promote the willingness of landowners to afforest cutaway peatlands. Possible incentives for afforestation (e.g., subsidies) could further improve the financial results. Increasing the interest rate from 3% to 5%, resulted in negative BLVs for 63–64% of the stands in both southern and northern Finland. With respect to optimal rotation period associated with increasing interest rate, our results indicate only minor shortening in years, slightly contradicting earlier studies (c.f. Tahvonen and Rämö 2016; Parkatti et al. 2019). There are two possible reasons for that. First, in this study the stand-level optimization started with an ongoing rotation, 31 or 32 years after stand establishment. Thus, in a narrow sense “optimal rotation” here indicates only the rest of the rotation period, corresponding on average 38–44 years. This presents just over a half rotation. Another reason for the relatively unresponsive optimal rotation period to interest rates might be the fact that the timings of thinnings were set to a range (–20% and +20% relative to silvicultural recommendations) which might have been an actual constraint when optimizing with high interest rates. In other words, with high interest rates the lower limit (–20%) could have been a threshold preventing earlier thinnings and thus shorter rotation period.
According to our results, profitable afforestation of cutaway peatlands can be made either by seeding or planting in southern Finland. However, due to the coarse-textured mineral sub-soil which had an especially low potassium concentration (Aro et al. 1997), PK or wood ash fertilization is needed during the afforestation stage and one re-fertilization should take place before the first commercial thinning.
In northern Finland it seems that the most profitable option would be to establish Scots pine stands by planting with efficient drainage (with ditch spacing of 15 m) without afforestation fertilization. This may be explained by the fine-textured silty sub-soil with a high mineral nutrient content, especially if the mineral soil from the ditches is spread onto the strips in connection with the drainage. Wider 40 m ditch spacing may be too sparse in order to maintain sufficient drainage in a humid climate during the first 20–30 years of the rotation. In addition, because the site had a shallow remaining peat layer, it is possible that the amount of ditch spoil spread on the strips was larger with the 15 m than in the 40 m ditch spacing. If pine stands are established by seeding, it is obvious that the seeding points should be fertilized during the afforestation stage, especially if the site has been drained with a ditch spacing of 40 m. Similarly, planted pine seedlings benefitted from afforestation fertilization if the drainage was carried out with a ditch spacing of 40 m. Drainage is a prerequisite for afforestation of cutaway peatlands, and there also might arise a need for ditch network maintenance during the rotation. Here, drainage has only been considered from tree growth point of view, although possible long-term negative impacts of ditching on water quality have recently been reported (Nieminen et al. 2017, 2018).
On the southern site, optimized growing increased the overall MAI and the MAI of the saw logs by 23–27% and 17–31% (interest rate from 3 to 5%), respectively, compared to Finnish silvicultural recommendations (Äijälä et al. 2014). Depending on the interest rate and management options on the northern site, optimized management increased the overall MAI and the MAI of the saw logs by 13–30% and 15–58%, respectively, compared to Finnish silvicultural recommendations (Äijälä et al. 2014). Depending on the treatments and climatic region, the BLV of the growing option based on silvicultural recommendations (Äijälä et al. 2014) was 40–68% of that achieved by the optimized growing alternative (rate of interest 3%).
With regard to optimized management, one should bear in mind that the optimization did not start from the bare land; instead stand-level optimization was combined with the existing stand characteristics from the time point of 31–32 years after establishment. Thus, the stand development until then would most likely to be off the optimal path since it is based merely on the best practice prevailing at that time. On the other hand, the measurement data between the stand establishment and the 31–32 years enabled the detailed tracking of actual, realized costs, which could not have been included in the analysis had we optimized the stand development from the bare land. Further, for cutaway peatland sites there are no existing early-development growth models to be incorporated into growth simulators.
With the assumptions made in this study, we reasonably expect to achieve solid financial performance for growing Scots pine trees on cutaway peatlands even in northern climatic conditions without subsidies. When comparing these BLV results to BLVs in earlier studies in Finnish growth conditions, one can argue that these BLVs tend to be a bit higher than what have been reported earlier (cf. Pukkala et al. 2010, p. 139, Table 4; Tahvonen and Rämö 2016, p. 898, Table 5). However, earlier studies were based on mineral soils whereas this study focused on cutaway peatlands – the exact correspondence between mineral and peatland soil productivity is, however, a disputable issue. From the point of view of the landowner, the production of Scots pine timber on cutaway peatlands is an attractive option. However, the yield of stands and their financial performance strongly depend on the substrate properties, and thus the management alternatives should be selected accordingly.
Acknowledgements
Jorma Pasanen, Eero Saari, Heikki Vesala and Seppo Vihanta took care of tree stand measurements. Seppo Vihanta also assisted in the data management.
References
Ahtikoski A., Hökkä H. (2019). Intensive forest management – does it pay off financially on drained peatlands? Canadian Journal of Forest Research 49(9): 1101–1113. https://doi.org/10.1139/cjfr-2019-0007.
Ahtikoski A., Salminen H., Hökkä H., Kojola S., Penttilä T. (2012). Optimising stand management on peatlands: the case of northern Finland. Canadian Journal of Forest Research 42(2): 247–259. https://doi.org/10.1139/x11-174.
Ahtikoski A., Haapanen M., Hynynen J., Karhu J., Kärkkäinen K. (2018). Genetically improved reforestation stock provides simultaneous benefits for growers and a sawmill, a case study in Finland. Scandinavian Journal of Forest Research 33(5): 484–492. https://doi.org/10.1080/02827581.2018.1433229.
Äijälä O., Koistinen A., Sved J., Vanhatalo K., Väisänen P. (eds.) (2014). Metsänhoidon suositukset. [Silvicultural recommendations]. The Forestry Centre Tapio, Helsinki, Finland. 180 p. [In Finnish].
Arias-Rodil M., Pukkala T., Gonzalez-Conzalez J.M., Barrio-Anta M., Dieguez-Aranda U. (2015). Use of depth-first search and direct search methods to optimize even-aged stand management: a case study involving maritime pine in Asturias (northwest Spain). Canadian Journal of Forest Research 45(10): 1269–1279. https://doi.org/10.1139/cjfr-2015-0044.
Aro L. (2000). Root penetration of Scots pine and silver birch on cut-away peatlands. In: Rochefort L., Daigle J.-Y. (eds.). Sustaining our peatlands. Proceedings of the 11th International Peat Congress. Volume II. CSPP and IPS, Edmonton, Alberta. p. 932–936. ISBN 951-97744-4-0.
Aro L., Kaunisto S. (2003). Jatkolannoituksen ja kasvatustiheyden vaikutus nuorten mäntymetsiköiden ravinnetilaan sekä puuston ja juuriston kehitykseen paksuturpeisella suonpohjalla. [Effect of refertilisation and growing density on the nutrition, growth and root development of young Scots pine stands in a peat cutaway area with deep peat layers]. Suo 54(2): 49–68. [In Finnish]. http://www.suo.fi/article/9826.
Aro L., Kaunisto S., Saarinen M. (1997). Suopohjien metsitys. Hankeraportti 1986–1995. [Afforestation of peat cutaway areas. Project report in 1986–1995]. Finnish Forest Research Institute, Research papers 634. 51 p. [In Finnish]. http://urn.fi/URN:ISBN:951-40-1558-4.
Bettinger P., Boston K., Siry J.P., Grebner D.L. (2009). Forest management and planning. 1st edition. Elsevier, Amsterdam. 360 p. eBook. ISBN 9780080921587.
Brown R.S., Kilgove M.A., Coggins J.S., Blinn C.R. (2012). The impact of timber-sale tract, policy and administrative characteristics on state stumpage prices: an econometric analysis. Forest Policy and Economics 21: 71–80. https://doi.org/10.1016/j.forpol.2011.10.001.
Bussières J., Boudreau S., Rochefort L. (2008). Establishing trees on cut-over peatlands in eastern Canada. Mires and Peat 3 article 10. 12 p. http://mires-and-peat.net/pages/volumes/map03/map0310.php.
Cao T., Valsta L., Mäkelä A. (2010). A comparison of carbon assessment methods for optimizing timber production and carbon sequestration in Scots pine stands. Forest Ecology and Management 260(10): 1726–1734. https://doi.org/10.1016/j.foreco.2010.07.053.
Chang S.J. (2013). Forest valuation under generalized Faustmann formula. Canadian Journal of Forest Research 44(1): 56–63. https://doi.org/10.1139/cjfr-2013-0298.
Charbonneau P., Knapp B. (1995). A user’s guide to PIKAIA 1.0, NCAR Technical Note 418+IA. High Altitude Observatory, National Center for Atmospheric Research, Boulder, Colorado. 121 p.
Faustmann M. (1849). Berechnung des Werthes, welchen Waldboden, sowie noch nicht haubare Holzbestände für die Waldwirthschaft besitzen. [Calculation of the value which forest land and immature stands possess for forestry]. Allgemeine Forst- und Jagd-Zeitung 25: 441–455. [In German].
Goldberg D.E. (1989). Genetic algorithms in search, optimization and machine learning. Boston, MA. Addison-Wesley Longman Publishing Co., Inc. 372 p. ISBN 0201157675.
Haapanen M., Hynynen J., Ruotsalainen S., Siipilehto J., Kilpeläinen M.L. (2016). Realised and projected gains in growth, quality and simulated yield of genetically improved Scots pine in southern Finland. European Journal of Forest Research 135: 997–1009. https://doi.org/10.1007/s10342-016-0989-0.
Hånell B., Svensson J., Magnusson T. (1996). Efterbehandling av torvtäkter – en litteraturstudie med tonvikt på alternativet beskogning. [Reclamation of peat winning fields – a literature review with special reference to the establishment of forest stands]. Swedish University of Agricultural Sciences, Department of Forest Soils. Reports in Forest Ecology and Forest soils 70. 34 p. [In Swedish].
Hayyolalam V., Kazem A.A.P. (2020). Black Widow optimization algorithm: a novel meta-heuristic approach for solving engineering optimization problems. Engineering Applications of Artificial Intelligence 87 article 103249. https://doi.org/10.1016/j.engappai.2019.103249.
Hökkä H., Repola J., Moilanen M. (2012). Modelling volume growth response of young Scots pine (Pinus sylvestris) stands to N, P, and K fertilization in drained peatland sites in Finland. Canadian Journal of Forest Research 42(7): 1359–1370. https://doi.org/10.1139/x2012-086.
Holland J.H. (1975). Adaptation in natural and artificial systems. AnnArbor, Michigan. The University of Michigan Press.
Hultkrantz L., Andersson L., Mantalos P. (2014). Stumpage prices in Sweden 1909-2012: Testing for non-stationarity. Journal of Forest Economics 20(1): 33–46. https://doi.org/10.1016/j.jfe.2013.07.003.
Huotari N., Tillman-Sutela E., Pasanen J., Kubin E. (2008). Ash-fertilization improves germination and early establishment of birch (Betula pubescens Ehrh.) seedlings on a cut-away peatland. Forest Ecology and Management 255(7): 2870–2875. https://doi.org/10.1016/j.foreco.2008.01.062.
Huotari N., Tillman-Sutela E., Kubin E. (2009). Ground vegetation exceeds tree seedlings in early biomass production and carbon stock on an ash-fertilized cut-away peatland. Biomass and Bioenergy 333(9): 1108–1115. https://doi.org/10.1016/j.biombioe.2009.05.009.
Huuskonen S., Haikarainen S., Sauvala-Seppälä T., Salminen H., Lehtonen M., Siipilehto J., Ahtikoski A., Korhonen K.T., Hynynen J. (2020). Benefits of juvenile stand management in Finland – impacts on wood production based on scenario analysis. Forestry: An international journal of forest research 93(3): 458–470. https://doi.org/10.1093/forestry/cpz075.
Hynynen J., Ahtikoski A., Siitonen J., Sievänen R., Liski J. (2005). Applying the MOTTI simulator to analyse the effect of alternative management schedules on timber and non-timber production. Forest Ecology and Management 207(1–2): 5–18. https://doi.org/10.1016/j.foreco.2004.10.015.
Hynynen J., Salminen H., Ahtikoski A., Huuskonen S., Ojansuu R., Siipilehto J., Lehtonen M., Eerikäinen K. (2015). Long-term impacts of forest management on biomass supply and forest resource development: a scenario analysis for Finland. European Journal of Forest Research 134: 415–431. https://doi.org/10.1007/s10342-014-0860-0.
Hytönen J., Aro L. (2012). Biomass and nutrition of naturally regenerated and coppiced birch on cutaway peatland during 37 years. Silva Fennica 46(3): 377–394. https://doi.org/10.14214/sf.48.
Hytönen J., Saarsalmi A., Rossi P. (1995). Biomass production and nutrient uptake of short-rotation plantation. Silva Fennica 29(2): 117–139. https://doi.org/10.14214/sf.a9202.
Hytönen J., Aro L., Issakainen J., Moilanen M. (2016). Peat ash and biotite in fertilization of Scots pine on an afforested cutaway peatland. Suo 67(2): 53–66. http://www.suo.fi/article/10094.
Hytönen J., Aro L., Jylhä P. (2018). Biomass production and carbon sequestration of dense downy birch stands on cutaway peatlands. Scandinavian Journal of Forest Research 33(8): 764–771. https://doi.org/10.1080/02827581.2018.1500636.
Hyytiäinen K., Ilomäki S., Mäkelä A., Kinnunen K. (2006). Economic analysis of stand establishment for Scots pine. Canadian Journal of Forest Research 36(5): 1179–1189. https://doi.org/10.1139/x06-023.
Juutinen A., Ahtikoski A., Lehtonen M., Mäkipää R., Ollikainen M. (2018). The impact of a short-term carbon payment scheme on forest management. Forest Policy and Economics 90: 115–127. https://doi.org/10.1016/j.forpol.2018.02.005.
Karofeld E., Jarašius L., Priede A., Sendžikaite J. (2017). On the after-use and restoration of abandoned extracted peatlands in the Baltic countries. Restoration Ecology 25(2): 293–300. https://doi.org/10.1111/rec.12436.
Kaunisto S. (1979). Alustavia tuloksia palaturpeen kuivatuskentän ja suonpohjan metsityksestä. [Preliminary results on afforestation of sod peat drying fields and peat cut-over areas]. Folia Forestalia 404. 14 p. [In Finnish]. http://urn.fi/URN:ISBN:951-40-0408-6.
Kaunisto S. (1981). Rauduskoivun (Betula pendula) ja hieskoivun (Betula pubescens) luontainen uudistuminen turpeennoston jälkeisellä suonpohjan turpeella Kihniön Aitonevalla. [Natural regeneration of Betula pendula and B. pubescens on a peat cut-away area]. Suo 32(3): 53–60. [In Finnish]. http://www.suo.fi/article/9523.
Kaunisto S. (1987). Lannoituksen ja muokkauksen vaikutus männyn ja rauduskoivun istutustaimien kasvuun suonpohjilla. [Effect of fertilization and soil preparation on the development of Scots pine and silver birch plantations on peat cutover areas]. Folia Forestalia 681. 23 p. [In Finnish]. http://urn.fi/URN:ISBN:951-40-0773-5.
Kikamägi K., Ots K., Kuznetsova T. (2013). Effect of wood ash on the biomass production and nutrient status of young silver birch (Betula pendula Roth) trees on cutaway peatlands in Estonia. Ecological Engineering 58: 17–25. https://doi.org/10.1016/j.ecoleng.2013.06.014.
Kikamägi K., Ots K., Kuznetsova T., Pototski A. (2014). The growth and nutrients status of conifers on ash-treated cutaway peatland. Trees 28: 53–64. https://doi.org/10.1007/s00468-013-0929-2.
Kojola S., Ahtikoski A., Hökkä H., Penttilä T. (2012). Profitability of alternative management regimes in Scots pine stands on drained peatlands. European Journal of Forest Research 131: 413–426. https://doi.org/10.1007/s10342-011-0514-4.
Korhonen K.T., Ihalainen A., Ahola A., Heikkinen J., Henttonen H., Hotanen J.-P., Nevalainen S., Pitkänen J., Strandström M., Viiri H. (2017). Suomen metsät 2009–2013 ja niiden kehitys 1921–2013. [Finnish forests 2009–2013 and their development 1921–2013]. Luonnonvara- ja biotalouden tutkimus 59/2017. 86 p. [In Finnish]. http://urn.fi/URN:ISBN:978-952-326-467-0.
Laasasenaho K., Lensu A., Rintala J., Lauhanen R. (2017). Landowners’ willingness to promote bioenergy production on wasteland – future impact on land use of cutaway peatlands. Land Use Policy 69: 167–175. https://doi.org/10.1016/j.landusepol.2017.09.010.
Laine J., Vasander H., Hotanen J.-P., Nousiainen H., Saarinen M., Penttilä T. (2012). Suotyypit ja turvekankaat – opas kasvupaikkojen tunnistamiseen. [Mire site types – a guide to site classification]. Metsäkustannus, Hämeenlinna. 160 p. [In Finnish].
Li M.J., Chen D.S., Wang F., Li Y., Zhou Y., Lang J.L. (2010). Optimizing emission inventory for chemical transport models by using genetic algorithm. Atmospheric Environment 44(32): 3926–3934. https://doi.org/10.1016/j.atmosenv.2010.07.010.
Luke Statistics (2018). Statistics database, Natural Resources Institute Finland. http://statdb.luke.fi. [First choose English as the language, then Forest Statistics, and further Economy for stumpage prices or Structure and Production for silvicultural costs]. [Cited 29 Sept 2018].
Metcalfe T.S., Charbonneau P. (2003). Stellar structure modeling using a parallel genetic algorithm for objective global optimization. Journal of Computational Physics 185(1): 176–193. https://doi.org/10.1016/S0021-9991(02)00053-0.
Moilanen M., Silfverberg K., Hokkanen T. (2002). Effects of wood-ash on the tree growth, vegetation and substrate quality of a drained mire: a case study. Forest Ecology and Management 171(3): 321–338. https://doi.org/10.1016/S0378-1127(01)00789-7.
Moilanen M., Silfverberg K., Hökkä H., Issakainen J. (2004). Comparing effects of wood ash and commercial PK fertilizer on the nutrient status and stand growth of Scots pine on drained mires. Baltic Forestry 10(2): 2–10. https://www.balticforestry.mi.lt/bf/PDF_Articles/2004-10[2]/2_10%20Moilanen%20et%20al.pdf.
Moilanen M., Silfverberg K., Hökkä H., Issakainen J. (2005). Wood ash as a fertilizer on drained mires – growth and foliar nutrients of Scots pine. Canadian Journal of Forest Research 35(11): 2734–2742. https://doi.org/10.1139/x05-179.
Moilanen M., Hytönen J., Hökkä H., Ahtikoski A. (2015). Fertilization increased growth of Scots pine and financial performance of forest management in a drained peatland in Finland. Silva Fennica 49(3) article id 1301. 18 p. https://doi.org/10.14214/sf.1301.
Näslund M. (1936). Skogsförsöksanstaltens gallringsförsök i tallskog. [Thinning experiments in pine forests undertaken by the Forest experiment institute]. Meddelanden från Statens Skogsförsöksanstalt 29(1). 169 p. [In Swedish].
Nieminen M., Sallantaus T., Ukonmaanaho L., Nieminen T.M., Sarkkola S. (2017). Nitrogen and phosphorus concentrations in discharge from drained peatland forests are increasing. Science of the Total Environment 609: 974–981. https://doi.org/10.1016/j.scitotenv.2017.07.210.
Nieminen M., Palviainen M., Sarkkola S., Laurén A., Marttila H., Finér L. (2018). A synthesis of the impacts of ditch network maintenance on the quantity and quality of runoff from drained boreal peatland forests. Ambio 47(5): 523–534. https://doi.org/10.1007/s13280-017-0966-y.
Niinimäki S., Tahvonen O., Mäkelä A. (2012). Applying a process-based model in Norway spruce management. Forest Ecology and Management 265: 102–115. https://doi.org/10.1016/j.foreco.2011.10.023.
Parkatti V.-P., Assmuth A., Rämö J., Tahvonen O. (2019). Economics of boreal conifer species in continuous cover and rotation forestry. Forest Policy and Economics 100: 55–67. https://doi.org/10.1016/j.forpol.2018.11.003.
Priede A., Gancone A. (eds.) (2019). Sustainable and responsible after-use of peat extraction areas. Baltijas krasti, Riga, Latvia. 256 p.
Pukkala T. (2009). Population-based methods in the optimization of stand management. Silva Fennica 43(2): 261–274. https://doi.org/10.14214/sf.211.
Pukkala T., Lähde E., Laiho O. (2010). Optimizing the structure and management of uneven-sized stands of Finland. Forestry 83(2): 129–142. https://doi.org/10.1093/forestry/cpp037.
Ramst R., Orru M., Salo V., Halliste L. (2006). Revision of Estonian abandoned peat production areas. The second phase. Ida-Viru, Lääne-Viru, Jogeva, Järva ja Tartu Counties. Geological Survey of Estonia, Department of Geology and Mineral Resources, Tallinn.
Renou F., Farrell E.P. (2005). Reclaiming peatlands for forestry: the Irish experience. In: Stanturf J.A., Madsen P. (eds.). Restoration of boreal and temperate forests. CRC Press, London. p. 541–557.
Renou-Wilson F., Farrell E.P. (2007). The use of foliar and soil information for optimising the nutrition of Sitka spruce and Norway spruce on cutaway peatlands. Silva Fennica 41(3): 409–424. https://doi.org/10.14214/sf.281.
Renou-Wilson F., Keane M., Farrell E.P. (2008). Establishing oak woodland on cutaway peatlands: effects of soil preparation and fertilization. Forest Ecology and Management 255(3–4): 728–737. https://doi.org/10.1016/j.foreco.2007.09.059.
Salminen H., Lehtonen M., Hynynen J. (2005). Reusing legacy FORTRAN in the MOTTI growth and yield simulator. Computers and Electronics in Agriculture 49(1): 103–113. https://doi.org/10.1016/j.compag.2005.02.005.
Salonen V. (1992). Plant colonization of harvested peat surfaces. Biological research reports from the University of Jyväskylä, No. 29. 29 p.
Selin P. (1999). Turvevarojen teollinen käyttö ja suopohjien hyödyntäminen Suomessa. [Industrial use of peatlands and the re-use of cutaway areas in Finland]. University of Jyväskylä. Jyväskylä studies in biological and environmental sciences 79. 239 p. [In Finnish]
Silfverberg K., Hartman M. (1999). Effects of different phosphorus fertilisers on the nutrient status and growth of Scots pine stands on drained peatlands. Silva Fennica 33(3): 187–206. https://doi.org/10.14214/sf.656.
Silfverberg K., Moilanen M. (2008). Long-term nutrient status of PK fertilized Scots pine stands on drained peatlands in North-Central Finland. Suo 59(3): 71–88. http://www.suo.fi/article/9862.
Statistics Finland (2018). Consumer price index release, appendix table 3, cost-of-living index 1951:10=100. https://www.stat.fi/til/khi/2018/10/khi_2018_10_2018-11-14_tau_003_en.html. [Cited 29 Sept 2018].
Straka T.J. (2010). Financial breakeven for competition control in longleaf pine (Pinus palustris Mill.) reestablishment. New Forests 40: 165–173. https://doi.org/10.1007/s11056-010-9191-2.
Tahvonen O., Rämö J. (2016). Optimality of continuous cover vs. clear-cut regimes in managing forest resources. Canadian Journal of Forest Research 46(7): 891–901. https://doi.org/10.1139/cjfr-2015-0474.
Tahvonen O., Pihlainen S., Niinimäki S. (2013). On the economics of optimal timber production in boreal Scots pine stands. Canadian Journal of Forest Research 43(8): 719–730. https://doi.org/10.1139/cjfr-2012-0494.
Valsta L. (1992). An optimization model for Norway spruce management based on individual-tree growth models. Acta Forestalia Fennica 232. 20 p. https://doi.org/10.14214/aff.7678.
Total of 72 references.
