Mateusz Liziniewicz,
Ignacio Barbeito,
Andis Zvirgzdins  ,
Lars-Göran Stener,
Pentti Niemistö,
Nils Fahlvik,
Ulf Johansson,
Bo Karlsson,
Urban Nilsson
,
Lars-Göran Stener,
Pentti Niemistö,
Nils Fahlvik,
Ulf Johansson,
Bo Karlsson,
Urban Nilsson
Production of genetically improved silver birch plantations in southern and central Sweden
Liziniewicz M., Barbeito I., Zvirgzdins A., Stener L.-G., Niemistö P., Fahlvik N., Johansson U., Karlsson B., Nilsson U. (2022). Production of genetically improved silver birch plantations in southern and central Sweden. Silva Fennica vol. 56 no. 1 article id 10512. https://doi.org/10.14214/sf.10512
Highlights
- The basal area development of genetically improved birch in Sweden was modeled using a generalized algebraic difference approach
- The best model fit, both graphically and statistically was delivered by the Korf base model
- The analysis of realized gain trial showed a stability of relative differences in basal area between tested genotypes.
Abstract
Investing in planting genetically improved silver birch (Betula pendula Roth) in Swedish plantations requires understanding how birch stands will develop over their entire rotation. Previous studies have indicated relatively low production of birch compared to Norway spruce (Picea abies (L.) Karst.) and Scots pine (Pinus sylvestris L.). This could result from using unrepresentative basic data, collected from unimproved, naturally-regenerated birch (Betula spp.) growing on inventory plots often located in coniferous stands. The objective of this study was to develop a basal area development function of improved silver birch and evaluate production over a full rotation period. We used data from 52 experiments including planted silver birch of different genetic breeding levels in southern and central Sweden. The experimental plots were established on fertile forest sites and on former agricultural lands, and were managed with different numbers of thinnings and basal area removal regimes. The model best describing total stand basal area development was a dynamic equation derived from the Korf base model. The analysis of the realized gain trial for birch showed a good stability of the early calculated relative differences in basal area between tested genotypes over time. Thus, the relative difference in basal area might be with cautious used as representation of the realized genetic gain. On average forest sites in southern Sweden, improved and planted silver birch could produce between 6–10.5 m3 ha–1 year–1, while on fertile agriculture land the average productivity might be higher, especially with material coming from the improvement program. The performed analysis provided a first step toward predicting the effects of genetic improvement on total volume production and profitability of silver birch. However, more experiments are needed to set up the relative differences between different improved material.
Keywords
Betula pendula;
planting;
generalized algebraic difference approach;
genetic gain;
stand basal area starting function
- Liziniewicz, The Forestry Research Institute of Sweden, Ekebo, SE-268 90 Svalöv, Sweden E-mail mateusz.liziniewicz@skogforsk.se
- Barbeito, Southern Swedish Forest Research Centre, Swedish University of Agricultural Sciences, Alnarp, Sweden; Université de Lorraine, AgroParisTech, INRAE, UMR Silva, Nancy, France E-mail ignacio.barbeito@slu.se
-
Zvirgzdins,
Southern Swedish Forest Research Centre, Swedish University of Agricultural Sciences, Box 49, 23053 Alnarp, Sweden
E-mail
andis.zvirgzdins@slu.se
- Stener, The Forestry Research Institute of Sweden, Ekebo, SE-268 90 Svalöv, Sweden E-mail lg.stener@telia.com
- Niemistö, Natural Resources In-stitute Finland (Luke), Natural resources, Seinäjoki, Finland E-mail pentti.niemisto@luke.fi
- Fahlvik, The Forestry Research Institute of Sweden, Ekebo, SE-268 90 Svalöv, Sweden E-mail nils.fahlvik@skogforsk.se
- Johansson, Tönnersjöheden Experimental Forest, SLU, Simlångsdalen, Sweden E-mail ulf.johansson@slu.se
- Karlsson, The Forestry Research Institute of Sweden, Ekebo, SE-268 90 Svalöv, Sweden E-mail curly.birch@gmail.com
- Nilsson, Southern Swedish Forest Research Centre, Swedish University of Agricultural Sciences, Box 49, 23053 Alnarp, Sweden E-mail urban.nilsson@slu.se
Received 8 January 2021 Accepted 21 January 2022 Published 28 January 2022
Views 104764
Available at https://doi.org/10.14214/sf.10512 | Download PDF

Supplementary Files
1 Introduction
Climate change is predicted to harm productivity of Norway spruce (Picea abies L. Karst) which has been the most commonly planted species in southern Scandinavia during the last century due to its economic potential (Kellomäki et al. 2008; Linnakoski et al. 2017). This potential is threatened by drought stress due to more frequent summer heat waves, which is likely to cause bark beetle outbreaks (Netherer et al. 2014). In addition, milder winters without frozen soil may increase the risk of windstorm damage and increase timber loss caused by root rot (Heterobasidion spp.). Consequently, broadleaved tree species, which may be more resistant to climate change, could be a valuable complement for the forest industry. Silver birch (Betula pendula Roth) is an obvious alternative to Norway spruce and Scots pine (Pinus sylvestris L.) since it is the third most abundant tree species in Swedish forests after these two conifers. Ecologically, silver birch has the broadest natural range of all European broadleaved species with extremely high phenotypic plasticity (Dubois et al. 2020). In addition, silver birch, like other deciduous tree species, whether in pure stands or mixed with other deciduous tree species, is less susceptible to wildfire damage than conifers (Pääkkönen et al. 1998; Ascoli and Bovio 2010; Terrier et al. 2013).
In the Nordic countries, birch (Betula spp.) is among the most productive of all commercially important native broadleaved species (Hynynen et al. 2010). The proportion of birch in the total standing volume of Swedish forests has continuously increased in recent decades due to the implementation of different environmental policies and certification schemes. Currently, birch makes up about 12.9% of the total volume in Sweden (Nilsson et al. 2021). Silver birch, the most abundant birch species in Sweden, often regenerates spontaneously and is retained in small proportions in forest stands dominated by Norway spruce or Scots pine. Naturally regenerated birch is of rather poor growth and quality as its management is often sub-optimal. For this reason, birch-wood is mainly used for pulp or fuel-wood in Sweden (Stener and Hedenberg 2003; Kilpeläinen et al. 2011), while only a very small proportion of birch wood is used as timber. Naturally regenerated birch is not usually managed for production of high-quality timber but to preserve the species throughout coniferous stands’ rotation. Active management of birch could improve growth and timber quality, resulting in higher sawtimber production. This would economically offset its lower productivity compared to Norway spruce (Stener et al. 2017). The high-quality timber could also create a base for an industry for high-quality birch products as veneer industry in many countries of the Baltic Sea region, e.g. Finland (Viherä-Aarnio and Velling 2017), Latvia (Gailis et al. 2020) and Lithuania (Araminienė and Varnagirytė-Kabašinskienė 2014).
Using genetically improved birch is one way to increase growth and stem quality. Both traits have been significantly improved by the Swedish long-term breeding program (Stener and Jansson 2005) which started in the late 1980s (Rosvall 2011). The predicted genetic gain from the currently available seed-orchards is between 15% and 18% with significant improvement of the stem quality. However, interest in planting birch remains low. The annual production of birch seedlings in Sweden is marginal (ca. 1.3 million), compared to 400 million seedlings of Norway spruce and Scots pine combined (Skogsstyrelsen Statistical Database 2021). The low interest is mainly due to higher establishment costs and less production compared to Norway spruce. High establishment costs are mainly due to browsing pressure from large herbivores, especially moose (Alces alces L.) (Bergqvist et al. 2014). Studies using Swedish National Forest Inventory (NFI) data have shown that volume production capacity of naturally regenerated birch can be 40–60% lower compared to planted Norway spruce (Ekö et al. 2008). An estimation of productivity of planted birch stands have not been done in Sweden. The observation in the scattered birch experiments suggest that differences in relation to Norway spruce might be much lower than indicated by Ekö et al. (2008).
Better estimation of the productivity in the planted silver birch stands with improved material is essential for developing appropriate recommendation for the forest owners and for designing optimal management strategies (Bergquist et al. 2005). Better recognition of the production capacity might increase an interest in birch planting. The quantitative demonstration of the effect of breeding activities is also of great importance. Such quantification might be done by an implementation of the genetic gain from breeding programs into growth and yield models. The proposed alternatives that have been tested over the world are calculation of genetic gain multipliers, adjustment of site index (SI), and calibration of the model parameters (Weiskittel et al. 2011; Deng et al. 2020). These implementation efforts are strongly dependent on the availability of the proper experimental data that has been very rare in most of the breeding programs due to high costs of establishment, especially for species of low commercial interest such as birch (Sun et al 2004; Weiskittel et al. 2011). In addition, new generations of improved material are likely to be available before results from the experiments are available (Burkhart and Thome 2012; Egbäck et al. 2017; Deng et al. 2020). Consequently, by the time the tested genetic material reaches maturity, it might already be vanishing from commercial use (Haapanen et al. 2016).
However, other tools such as forest growth models can be used to show the effects of the breeding program, and to make long-term growth forecasts using a wide range of underlying experimental data. In this study, we analyzed the data from 52 available trials of silver birch in southern and central Sweden. The data set contained data from genetic trials from different phases of the breeding program as well as experiments established with a primary purpose of assessing growth and production with unknown genetic origin but with the high probability of being improved. The goal of the study was to develop a basal area development function for planted silver birch from this diverse material. The new function will be the first function for planted birch in Sweden. The currently available function has been fitted with data from the national forest inventory plots which often contain naturally regenerated and unmanaged birch and may underestimate volume production in the planted stands (Fahlvik et al. 2014; Elfving 2011). The secondary goal of the study was to present the stability of the genetic gain over time for silver birch. The hypothesis was that the gain calculated for volume and basal area later in rotation is at least of the same magnitude as early calculated gains in the selection age for height, diameter, basal area, and volume.
2 Material and methods
2.1 Data
The material for this study originated from 52 experiments with silver birch planted in southern and central Sweden between 1990 and 2010 on forest sites and former agricultural land (Table 1, Fig. 1). The average planting density was ca. 2500 trees ha–1. The experiments were established using different statistical designs (single- and multi-tree plots), as they were established for different purposes, including studies of genetics, production and thinning. The calculations in this study were done on an experimental-plot level. The plot size ranged from 0.04 ha to 0.1 ha. Data from the plots established both on forest sites and former agricultural land was used as input for construction of the models (Fig. 2). In total, there were 228 experimental plots. Each experiment was re-measured 2 to 7 times at 3–12 year intervals.
| Table 1. Mean, minimum (Min), maximum (Max) and standard deviation (SD) for variables describing the 52 thinned and unthinned periods from the silver birch experiments used in this study. Variables: BA is basal area; H0 is the dominant height; SI is site index – the mean height of the 100 thickest trees per hectare at 50 years. | ||||||||
| Variable | Unthinned (n = 301) | Thinned (n = 380) | ||||||
| Mean | Min | Max | S.D. | Mean | Min | Max | S.D. | |
| t (years) | 21 | 7 | 63 | 11 | 22 | 11 | 59 | 9 |
| N (trees ha–1) | 1506 | 302 | 2850 | 718 | 987 | 342 | 2160 | 387 |
| BA (m2 ha–1) | 12.8 | 1.0 | 56.3 | 8.7 | 15.4 | 4.4 | 50.5 | 6.4 |
| H0 (m) | 14.7 | 5.0 | 24.5 | 4.6 | 15.5 | 8.3 | 23.5 | 3.2 |
| SI (m) | 24.5 | 11.7 | 31.6 | 3.6 | 23.9 | 12.9 | 29.7 | 4.0 |
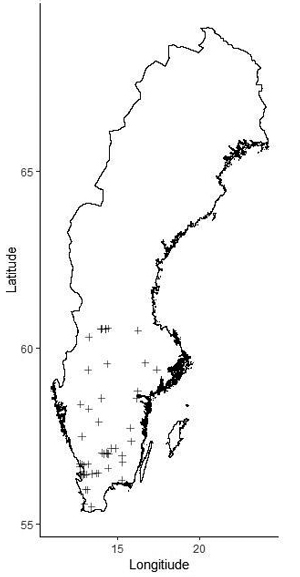
Fig. 1. Location of the silver birch study sites in Sweden.
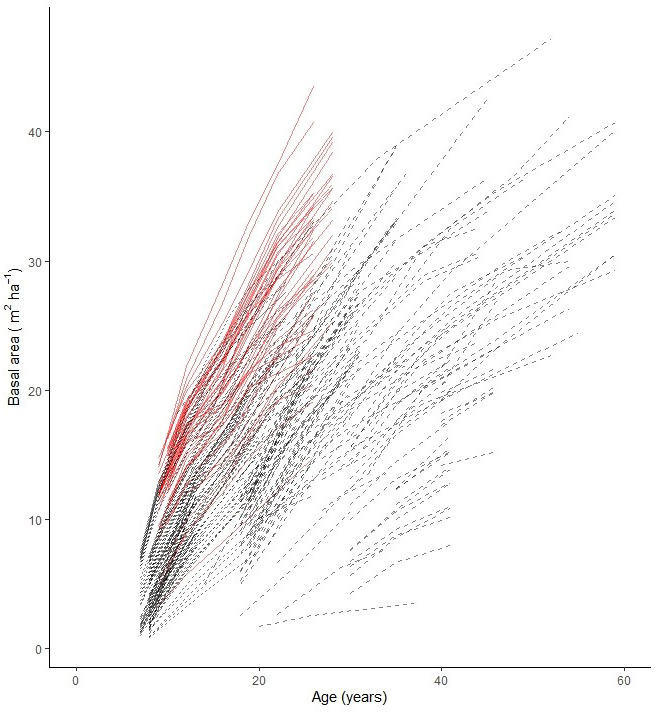
Fig. 2. Stand basal area growth data used for modelling basal area development of planted silver birch in Sweden. Experiments on former agriculture land are shown with solid (red) lines and on forest sites with dashed (black) lines.
Stem diameter at breast height was registered for all trees at all measuring occasions. Height was recorded for the sample trees but not for all measurement occasions. Because of lack of data on heights, stand basal area was chosen as a dependent variable in the model as volume could not have been calculated for the intervals without height measurements.
The estimations of basal area and volume per hectare were based on the single tree measurements. A single tree height was estimated for the trees with measured diameter. The height estimation was based on the height-diameter functions developed by Näslund (1936) with the power of three that resulted in the smallest residuals for the measured sample trees. The parameters of the Näslund (1936) function were calculated separately for plot or experiment depending on the number of sample trees available. The height of single tree with measured diameter have been consecutively estimated with the calculated parameters of the Näslund (1936) function. The volume of single tree was calculated with the functions developed by Brandel (1990).
Site index at the reference age of 50 years (Johansson et al. 2013) was calculated from age at breast height and top height (100 thickest trees ha–1) for each experimental plot if heights of sample trees were measured. Top height was calculated out of the previously estimated heights. In general, the thinnings aimed to reduce the stem density by removing low-quality stems or competing trees but without a common pattern among the selected experiments. All the stands considered in this study have been thinned at least once as this is a common practice in birch plantation supporting the optimal stand growth. The thinning intensity ranged between 7% to 56% of basal area with the mean of 23%. Thinnings were done in the age between 11 to 26 years. The number of thinning were often three or less during the observation time, however, there was a variation both between experiments and between plots within experiments. Thus, it was assumed, that such thinnings resulted in negligible mortality. In addition, almost no mortality has been observed in the genetic field trials planted with an initial density of 2500 trees ha–1 at the time of diameter measurement between age of 7 and 12 years.
2.2 Overall approach
In this study we constructed a set of models to forecast the stand development of planted silver birch. We first developed a function to predict starting values (SV) of stand basal area in 7- to 12-year-old stands. This is the age when tree diameters are usually measured for the first time. Second, we developed a basal area development function using generalized algebraic difference approach (GADA). The best basal area development function was selected by statistically and graphically evaluating their goodness-of-fit. The starting values produced by the SV function were used to simulate basal area development over the full rotation with the selected basal area development function.
Lastly, we constructed a model to calculate stand form height (a ratio between total volume and basal area production) to estimate total volume production.
2.3 Stand basal area starting function (SV)
We developed a function to estimate the initial stand basal area at the starting age (between 7 and 12 years). At that age birch stands are usually well established and are approaching their first thinning. The linear model for prediction of initial basal area included independent variables of age (years), stand density (square root-transformed number of trees ha–1) and site index in meters at the reference age of 50 years (Johansson et al. 2013). The dependent variable was logarithmically transformed such that the model error terms were normally distributed and to reduce heteroscedasticity of the error variance. The starting values of the estimated basal area were then used as input for further basal area development.
2.4 Basal area projection function (BAP)
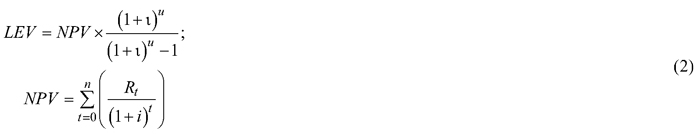
Three different well known growth functions were tested and selected for evaluation during the process of stand basal area function development. Among the candidate functions were: Korf (BA1 and BA2) (Korf 1939), Hossfeld (BA3 and BA4) (Cieszewski and Zasada 2002 as cited in Cieszewski et al. 2007 and McDill and Amateis 1992 as cited in Anta et al. 2006), and Bertalanffy-Richards (BA5 and BA6) (von Bertalanffy 1949 as cited in Liziniewicz et al. 2016) (Table 2). The tested functions included recently developed dynamic equations with two site-specific parameters and frequently used dynamic equations with only one site-specific parameter (Castedo-Dorado et al. 2007). As all the plots were thinned at least once, the functions were fitted to all the growth intervals.
| Table 2. Base models and Generalized Algebraic Difference Approach (GADA) forumulations selected for basal area development of silver birch. View in new window/tab. |
The fitting procedure followed the dummy variable method proposed by Cieszewski and Bailey (2000) which models site index and stand development with the algebraic difference approach (ADA) and generalized algebraic difference approach (GADA). The fitting procedure was programmed in R version 3.6.1 using the nls procedure (R core Team 2019).
2.5 Volume function (VF)
A function incorporating stand height was developed to estimate volume (m3 ha–1) from basal area (m2 ha–1) values (Eq. 1). This allowed making the basal area development model more useful, as volume is the fundamental unit used in forestry practice. To develop this function, we used data from experimental plots, where total volume production per hectare was estimated. The ratio between total volume production per hectare and total basal area production per hectare (response variables) was modelled as a linear function against top height (average height of 100 thickest trees per ha–1) and age (explanatory variables X1 and X2):
![]()
where Vol is volume per hectare (m3 ha–1); BA is basal area per hectare (m2 ha–1), a1 is the intercept, a1 is the coefficient for independent variable X1, a2 is the coefficient for independent variable X2, and ε is a random error term N (0, σ2). In the simulation, we transformed basal area into volume by multiplying the right side of the equation by basal area.
2.6 Model fitting and model evaluation
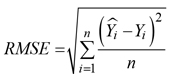
The quality of the fitted BAP, SV and VF functions was evaluated both graphically and numerically. For the models, standardized residuals were visually assessed to detect any remaining pattern with respect to the explanatory variables. The numerical analysis consisted of calculation of goodness-of-fit statistics: the root mean squared error (RMSE), which gives the accuracy of the estimates in the same units as the dependent variable, and the coefficient of determination (e.g. pseudo-R2 when applied in non-linear regression), which is the proportion of the total variance of the dependent variable explained by the model.
Validation of the models was carried out using an independent dataset from experiments in Finland. The dataset originated from thinning experiments established on twelve different experimental sites in southern and central Finland with observation periods of 16–48 years. Different thinning practices were applied to plots within the experiments. Measurements of the thinning experiments were similar to the Swedish data used for the construction of the models. Stem diameter was measured at breast height for all trees within the experimental plots. Total basal area production per hectare including harvested trees and mortality was calculated for individual plots. Models were validated by both statistical and graphical inspection of basal area development in the thinning experiments compared to the projected basal area development from the best BA development function. The following numerical statistics were calculated:
Root mean square (RMSE):
Mean absolute error (MAE):
![]()
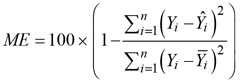
Modelling efficiency coefficient:
where ![]() is a trait value,
is a trait value, ![]() is a mean value of the trait,
is a mean value of the trait, ![]() is an estimate of the trait and i is an indication of the measurement.
is an estimate of the trait and i is an indication of the measurement.
With the developed functions a simulation of the results for four sites at site indices B22, B25, B28 and B32 defined as a top height in meters in the age of 50 years were done. The stocking of the simulated stands were 2200 stems per hectare in the initial age of 10 years. The initial basal area was calculated using the SV model. Subsequently, the BAP function was used to project stand development followed by a transformation of basal area into volume using VF function. Three thinnings were applied to each stand and thinning time differed depending on SI and were applied earlier for higher site index. In each thinning 30% of basal area was removed. The basal area predictions were done until the Land Expectation Value (LEV) reached the maximum:
where NPV is net present value (Eq. 2), Rt is net cash inflow-outflow during a single period t, n is the number of time periods, i is the discount rate and u is rotation age. The LEV as well as other monetary values were first calculated in SEK, and converted to EUR by using an exchange rate 0.096 (European Central Bank 2020).
The cost of establishment was set to 1440 EUR ha–1. All volume produced was treated as pulpwood with a price of 33.6 EUR m–3. Harvesting costs (in EUR m–3) of thinning operations and final felling were estimated based on average costs of these activities in southern Sweden between 2005–2015 (Nilsson et al. 2016).
2.7 Realized gain
The experiment S21S9331222 in Jordkull in southern Sweden (59°34´N, 14°15´E) is the only one Swedish birch experiment where clones of 10 genotypes were planted plot wise i.e. a single plot contains just one genotype. The experiment might be considered as a realized gain trial. Such type of trials is also rare for other tree species. It was planted in 1993 with cloned plants with known genetic background. However, planted genotypes in the trial have not been intended for a deployment to the operational forestry.
In this study, the experiment was used to investigate if between genotype variation in different stand properties is stable over time. The relative differences between genotypes were calculated for height, diameter and stand basal area at the age of 9 years and were presented in relation to the relative differences in total basal area production, total volume production and site index in the last measurement occasion i.e., 26 years. The worst performing genotype has been used as a reference for testing the realized gain of the other genotypes, resulting in an approach of the gain over unimproved material.
3 Results
3.1 Basal area starting function and the volume function
The initialization function consisting of age (years), stand density (square root-transformed number of trees ha–1) and site index as independent variables explained 64% of the total variance of basal area with an RMSE of 0.38 m2 ha–1 (Table 3). Model residuals were normally distributed with some detectable trends especially for for the lower predicted values of basal area and site index (Supplementary file S1). Despite of a range of applied transformation, the heteroscedasticity could not be removed.
| Table 3. Parameter estimates of initial conditions in the stand values of silver birch. SE is standard error, t-values and p-values demonstrate the statistical performance of the parameters. The model is based on a dependent variable of logarithmically transformed basal area for stands between 7 and 12 years old and several independent variables: age (years), quadratic square root-transformed number of trees (N ha–1) and site index (SI) at 50 years (Johansson et al. 2013). | ||||
| Estimate | SE | t-value | p-value | |
| Intercept | –7.3193 | 0.8710 | –8.40 | 3.19e–14 |
| Age (years) | 0.2138 | 0.0151 | 14.11 | 2e–16 |
| (N ha–1) | 0.0643 | 0.0188 | 3.42 | 0.000814 |
| Site index (m) | 0.1555 | 0.0152 | 10.23 | < 2e–16 |
The linear model predicting stand form height i.e., ratio between total volume and basal area production, explained 94% of the total variance with an RMSE of 0.49 m (Table 4). Residual analysis revealed no trends over the dependent or independent variables (top height and age) (Suppl. file S2).
| Table 4. Parameter estimates for the model converting basal area into volume for silver birch. The dependent variable is a ratio between total volume production and total basal area production. Independent variables are top height (m) and age (years). SE is standard error, t-values and p-values demonstrate the statistical performance of the parameters. | ||||
| Estimate | SE | t-value | p-value | |
| Intercept | –0.4044 | 0.063 | –6.45 | <0.05 |
| Top height (m) | 0.4286 | 0.006 | 75.2 | <0.05 |
| Age (years) | 0.0085 | 0.002 | 3.65 | <0.05 |
3.2 Basal area development function
The two- and three-parameter models derived from the Korf´s base function performed similarly between 0and 40 years (Fig. 3). These functions also explained the greatest share of the total variation (>97%) and resulted in the lowest root mean square error (RMSE, Table 4). The function with three parameters derived from the Bertalanffy-Richards base model was similar in terms of quality of fit (Table 5). However, this model explained a slightly lower share of variation and had a greater RMSE, whereas the two-parameter function derived from the same base model function performed similarly to the three-parameter function up to a basal area of 40 m2 ha–1. The three-parameter function derived from Hossfeld´s base model performed poorly when the basal area exceeded 30 m2 ha–1. The Korf function performed the best both statistically and visually, so it was selected for further analysis. The trajectory of the modeled curves of the Korf models encompassed the actual growth pattern of the observed values (Fig. 3). Out of the two final functions (BA1 and BA2), the two-parameter function with one site-specific parameter (BA1) was selected because of its more parsimonious nature compared to BA2 and slightly better goodness-of-fit statistics (Table 5). Furthermore, residual analysis showed the residuals were evenly distributed around zero, with homogeneous variance and no detectable trends.
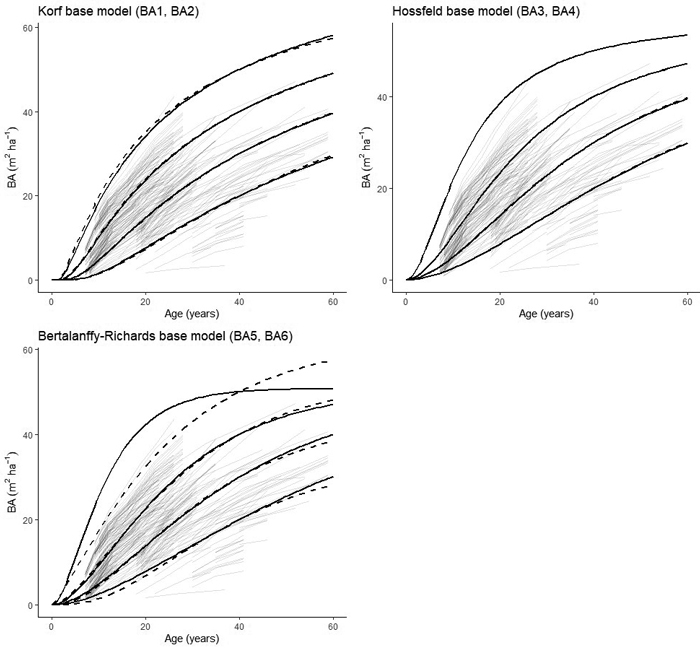
Fig. 3. Basal area development curves of silver birch reaching basal areas of 15, 25, 35 and 45 m2 ha–1 at 40 years for the two-parameter models (BA1, BA3, BA5 – solid lines) and the three parameter models (BA2, BA4, BA6 – dashed lines).
| Table 5. Parameter estimates, standard errors (SE), and goodness-of-fit measurements (P = level of statistical significance, RMSE = root mean square error, R2 = coefficient of determination) for the dynamic equations for basal area development of silver birch considered in this study. | ||||||
| Base model | Parameter | Estimate | SE | P | RMSE | R2 |
| Korf (BA1) | b1b2 | 91.3397 0.7054 | 6.2864 0.0296 | <0.0001 <0.0001 | 1.569 | 0.9724 |
| Korf (BA2) | b1b2b3 | 506.8 –1900 0.5985 | 325.0 1472 0.302 | 0.119 0.127 <0.0001 | 1.568 | 0.9726 |
| Hossfeld (BA3) | b1b2 | 57.1328 1.7511 | 2.1663 0.04 | <0.0001 <0.0001 | 1.754 | 0.9656 |
| Hossfeld (BA4) | b1b2b3 | 59.1606 –552.77 –1.7460 | 3.4204 851.43 0.03987 | <0.0001 0.516 <0.0001 | 1.755 | 0.9656 |
| Bertalanffy-Richards (BA5) | b1b2 | 50.7827 1.9404 | 1.5410 0.0615 | <0.0001 <0.0001 | 1.7522 | 0.9351 |
| Bertalanffy-Richards (BA6) | b1b2b3 | 0.0458 –10.2369 47.6122 | 0.0022 2.1422 8.2858 | <0.0001 <0.0001 <0.0001 | 1.663 | 0.9691 |
3.3 Model validation
The BA1 function was validated against data from thinning experiments in Finland. The root mean squared error was 1.42 m2 ha–1 while mean absolute error was 0.22 m2 ha–1. The modelling efficiency was ca 93%. A visual inspection showed good visual conformity between the model and Finnish thinning experiments. The modeled curves were well matched to the measured pattern of basal area development (Fig. 4). However, even though the model showed good performance visually and in terms of fit statistics, residual analysis revealed that there was slight tendency for a bias (Suppl. file S3). The t-test comparing observed and predicted basal area values did not reveal a significant bias (p = 0.3645). Even though the majority (75%) of residuals fell within ±2 m2 ha–1 of the measured basal area, the residual values appeared to increase with the predicted total basal area, indicating increasing over-prediction of basal area over longer timescales.
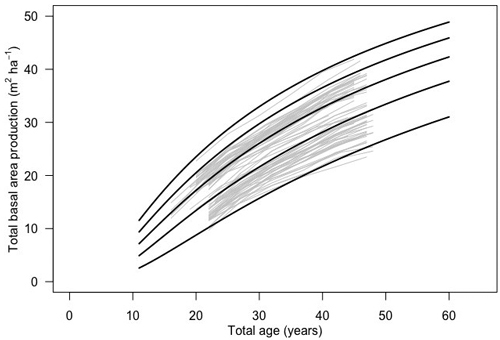
Fig. 4. Basal area development of silver birch in 12 thinning experiments in Finland (gray lines) and basal area development according to the Korf function (BA1; black lines).
3.4 Models’ application
The application of the models into four stands with different site indices (SI) with stocking of 2200 trees ha–1 in 10 years showed an increase of mean annual increment (MAI) and a decrease of the optimal rotation age with increasing SI (Table 6). The rotation age at the best site was 31 years with the MAI of 12.8 m3 ha–1 year–1.
| Table 6. Results of the simulation for silver birch stands established with planting material with site indices of 22 m, 25 m and 28 m at 50 years. Initial stand density is 2200 trees ha–1 at 10 years. Three thinnings (including one non-commercial cleaning and two commercial thinnings) with removal of 30% of basal area were applied in each stand. Land expectation value (LEV) based on a 2.5% discount rate was applied. | |||||
| Site index | Mean annual increment | Land expectation value | Rotation length | Harvested volume | |
| Thinning | Final felling | ||||
| (m) | (m3 ha–1 year) | (EUR ha–1) | (years) | (m3 ha–1) | (m3 ha–1) |
| 22 | 6.0 | 479.6 | 60 | 93 | 269 |
| 25 | 7.9 | 1511.7 | 51 | 66 | 337 |
| 28 | 10.5 | 3103.2 | 45 | 80 | 394 |
| 32 | 12.8 | 5500.8 | 31 | 108 | 287 |
3.5 Quantification of relative differences in genotypes performance
The Genotype indicated as the German2 was the worst performing and it has been used as a reference. The relative differences in the age of 9-years-old between the worst genotype and average were 22 % and 16% for height and diameter, respectively. The relative basal area differences decreased slightly from age of 9 years to the age of 26 years (Table 7, Fig. 5). The difference between basal area for both ages was in a range of 20% and the difference was increasing with an increase of an initial gain at age of 9 years. One exception was the genotype from Holland which with age lost all the gain in basal area it has at the age of 9 years i.e. 45%. The simple correlation between age 9 years and age 26 years for differences in basal area was 0.77 and for basal area at age 9 years and volume at age 26 years the correlation coefficient was 0.72.
| Table 7. Relative differences between silver birch genotype German 2 and other silver birch genotypes for height (H), diameter (D), top height (TH), site index (SI), basal area (G) and volume (V). The number indicate an age when the trait was measured. | ||||||||
| Origin | H_9 | D_9 | G_9 | V_9 | TH_9 | SI_26 | G26 | V_26 |
| E-län (Sweden) | 120% | 108% | 124% | 140% | 117% | 107% | 113% | 132% |
| Ekebo 1 (Sweden) | 125% | 118% | 153% | 180% | 126% | 110% | 155% | 183% |
| Finland 1 | 115% | 110% | 128% | 140% | 112% | 105% | 125% | 137% |
| Finland 2 | 133% | 115% | 144% | 179% | 127% | 111% | 136% | 162% |
| Holland | 130% | 117% | 148% | 179% | 118% | 108% | 103% | 110% |
| Latvia | 127% | 121% | 157% | 186% | 128% | 112% | 146% | 175% |
| Mixed | 108% | 107% | 89% | 95% | 115% | 107% | 100% | 117% |
| T-län | 131% | 125% | 170% | 206% | 136% | 115% | 188% | 252% |
| German 1 | 111% | 121% | 132% | 137% | 113% | 106% | 123% | 136% |
| German 2 | 100% | 100% | 100% | 100% | 100% | 100% | 100% | 100% |
| Average (1:9) | 122% | 116% | 138% | 160% | 121% | 109% | 132% | 156% |
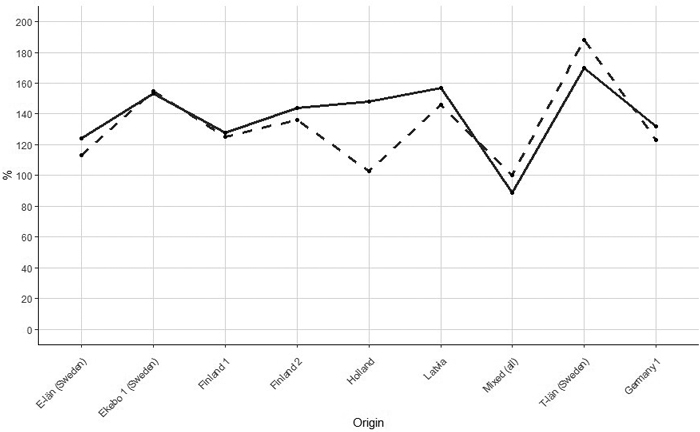
Fig. 5. Relationship between relative difference in basal area of silver birch between genotype German 2 and other genotypes in the age of 9 years (solid line) and 26 years (dashed line). Correlation between relative difference in age 9 years and 27 years was 0.77 (German 2 was excluded).
4 Discussion
4.1 Model fit and validation
In this study, the two-parameter Korf function with one site-specific parameter was selected for modelling silver birch basal area development. The function includes age, stocking level and SI, and was selected for its parsimony and good performance over the observed growth trajectories obtained from 52 field trials. SI in the SV model was used to account for the genetic gain. The selected function showed good predictive ability and represented the experimental data accurately over the potential 40 year rotation age for planted silver birch in southern Sweden. In addition, the function provided reliable estimates even beyond the presented time span, up to 60 years.
Validation of the selected model using an independent dataset from Finnish thinning experiments showed that the model accurately forecasts the observed growth in basal area. However, certain shortcomings were observed, particularly an increasing over-prediction of the basal area over longer timescales, which indicates that the model needs to be used with caution when applied for longer periods. Moreover, our model provides useful estimates of total stand basal area development. However, forecasting tree mortality is impractible as the mortality function was not included in the models constructed in this study.
4.2 Planted stand productivity
The production of planted silver birch stands is clearly higher than values previously calculated using data from NFI plots (Ekö et al. 2008). The estimates of this study show that the stands planted with the available silver birch planting material (at the time of planting) on average-fertility forest sites in southern Sweden resulted in MAI’s of 6–12.8 m3 ha–1 year–1. With a new improved material, there is a potential for further increases stand productivity in the future as the most improved material that is currently available has not been used for establishment of the analyzed plots. According to Dahlberg et al. (2006), the MAI of silver birch on fertile sites in Sweden is ca. 10 m3 ha–1 year–1 for rotations between 30 and 60 years. Similar productivity was suggested based on current annual increment (CAI) observation for stands on agriculture land in southern Sweden where CAI was estimated in temporary sample plots (Sonesson et al 1994). Our analysis of the realized gain trial planted on fertile site with improved genetic material showed that production can reach up to 14 m3 ha–1 year–1. The productivity predicted by the basal area development model for fertile site of SI 32 meters in 31 years were 12.8 m3 ha–1 year–1. This indicates that silver birch production can approach levels achieved with planted Norway spruce if genetically improved birch is planted. However, since there is also an ongoing breeding program for Norway spruce with similar objectives, it is unlikely that the difference in production between the two tree species will be fully eliminated in the near future (Egbäck et al. 2017). In order to compare Norway spruce, silver birch and other species, there is a need for more controlled experiments testing genetically superior material of different species.
4.3 Current genetic gains and a future of silver birch breeding in Sweden
The current genetic gains for a specific deployment material of silver birch are estimated based on the parameters calculated for other tree species i.e., age to age correlations between selection e.g., diameter and height and objective traits e.g., volume production over rotation. This is done due to the lack of experiments for Silver birch, while there are many existing experiments for Norway spruce and Scots pine. Hence, the realized genetic gain might be larger than predicted. For instance, the Finnish silver birch breeding program showed a genetic volume gain of up to 30% over the full rotation period for the same type of tested plus trees (Hagquist and Hahl 1998; Pöykko 2018). The analysis in this study done in the single realized gain trial showed the differences in basal area production in 26 years between worst and average among randomly selected and propagated clones reached 32% and was stable over time except a genotype from Holland. In this case, the difference is most likely related to a long north-transfer distance of this material.
The calculated difference cannot directly be perceived as a genetic gain in relation to unimproved material but gives a good indication that early measured differences between genotypes might be a reliable estimation of genetic superiority. The stability of the differences over time are in line with the studies for Norway spruce in Sweden where early measured differences between unimproved and improved seed lots persisted up to first thinning (Liziniewicz et al. 2018). The greater relative differences in volume per hectare productivity also indicate that selection of certain genetic material affect height development. Thus, adjustment of both basal area and height is needed to incorporate appropriately genetic gain to growth and yield models.
4.4 Limitations of this study
The design behind available experimental data is the main limitation of this study. The genetic experiments mainly used a single-tree plot design, where a mixture of genotypes from several families are randomly planted over the experimental area. Plots containing just one deployment material would be preferrable but were not available.
Moreover, experiments had different levels of genetic improvement, including 1) older thinning experiments established in stands of unknown genetic background, 2) stands planted for production studies using material of different provenances, 3) genetic trials of the basic selection of plus trees, 4) genetic trials with well performing selected material, and 5) provenance trials and production trials using deployment material (i.e., plants originating from available seed orchards). Thus, the genetic variation was substantial and not controlled in this study as the approach assumed that the newly developed curves will represent a mean of all birch stands established with improved material.
Another limitation of the constructed model is that the starting values are affected by initial stand density and this has little to do with fertility or tree performance. Therefore, the models are only valid within the relatively limited range of initial stocking represented in our data (1800–2200 trees ha–1).
5 Conclusions
The main objective of this study was to construct a stand basal area development model for planted silver birch in southern and central Sweden based on available data. These development functions have proven reliable, with an ability to accurately predict basal area development of silver birch stands over a range of site fertilities in southern and central Sweden. Validation of the basal area development functions using an independent dataset from thinning experiments in Finland showed good fit; however, it must be noted that when applied outside of its geographical scope, the model should be used with caution. The analysis of realized gain trial showed that planting improved silver birch material will increase stand productivity, and consequently shorten stand rotations and improve stand profitability considerably, particularly on fertile sites. Further studies including wood quality traits and financial analyses would be required to demonstrate how genetically improved birch can become a viable complement to Norway spruce and Scots pine in Sweden. A series of realized gain trials to confirm genetic gain of the deployment material and calibration of the models would be valuable for future analysis of production and economy in planted birch.
Funding
This study was financially supported by Stiftelsen Werner von Seydlitz.
Acknowledgments
We would like to thank both anonymous reviewers for their valuable comments that helped us to improve our manuscript.
Availability of research materials and data
The research materials and data used in this study are available upon reasonable request.
References
Anta MB, Dorado FC, Dieguez-Aranda U, Alvarez-Gonzalez JG, Parresol BR, Soalleiro RR (2006) Development of a basal area growth system for maritime pine in northwestern Spain using the generalized algebraic difference approach. Can J For Res 26: 1461–1474. https://doi.org/10.1139/x06-028.
Araminienė V, Varnagirytė-Kabašinskienė I (2014) Research on birch species in Lithuania: a review study. Research for rural development 2014: Proceedings of the 20th annual international scientific conference. Jelgava: Latvia University of Agriculture 2: 50–56. https://hdl.handle.net/20.500.12259/87863.
Ascoli D, Bovio G (2010) Tree encroachment dynamics in heathlands of north-west Italy: the fire regime hypothesis. iForest 3: 137–143. https://doi.org/10.3832/ifor0548-003.
Bates DM and Watts DG (1988) Nonlinear regression analysis and its applications. John Wiley, New York. https://doi.org/10.1002/9780470316757.
Bergqvist G, Bergström R, Wallgren M (2014) Recent browsing damage by moose on Scots pine, birch and aspen in young commercial forests – effects of forage availability, moose population density and site productivity. Silva Fenn 48, article id 1077. https://doi.org/10.14214/sf.1077.
Bergquist J, Ekö PM, Elving B, Johansson U, Thuresson T (2005) Jämförelse av produktionspotential mellan tall, gran och björk på samma ståndort. [Comparison of production potential between Scots pine, Norway spruce and birch at the same site]. Skogsstyrelsen, Jönköping, Sweden.
Brandel G (1990) Volymfunktioner för enskilda träd. Tall, gran och björk. [Volume functions for individual trees: Scots pine (Pinus sylvestris), Norway spruce (Picea abies) and birch (Betula pendula & Betula pubescens)]. Sveriges Lantbruksuniversitet, Inst f skogsproduktion, Rapport nr 26, Garpenberg.
Burkhart HE, Tomé M (2012) Modelling forest trees and stands. Springer, Dordrecht. https://doi.org/10.1007/978-90-481-3170-9.
Castedo-Dorado F, Diéguez-Aranda U, Barrio-Anta M, Álvarez-Gonzàlez J-G (2007) Modelling stand basal area growth for radiata pine plantations in northwestern Spain using the GADA. Annals of For Sci 64: 609–619. https://doi.org/10.1051/forest:2007039.
Cieszewski CJ, Bailey RL (2000) Generalized algebraic difference approach: theory based derivation of dynamic site equations with polymorphism and variable asymptotes. For Sci 46: 116–126. https://doi.org/10.1093/forestscience/46.1.116.
Cieszewski CJ, Zasada M (2002) Dynamiczna forma anamorficznego modelu bonitacyjnego dla sosny pospolitej w Polsce. [A dynamic form of anamorphic site index model for Scots pine]. Sylwan 146: 17–24. https://agro.icm.edu.pl/agro/element/bwmeta1.element.agro-article-9b4c1ce1-4371-43de-85e2-35d73d391975.
Cieszewski CJ, Strub M, Zasada M (2007) New dynamic site equation that fits best the Schwappach data for Scots pine (Pinus sylvestris L.) in Central Europe. Forest Ecol Manag 243: 83–93. https://doi.org/10.1016/j.foreco.2007.02.025.
Dahlberg A, Egnell G, Bergh J, Rytter L, Westling O (2006) Miljöeffekter avskogsbränsleuttag och askåterföring i Sverige – En syntes av Energimyndighetens forskningsprogram 1997 till 2004. [Environmental effects of forest fuel extraction and ash recycling in Sweden – a synthesis of the Swedish Energy Agency’s research program 1997 to 2004]. Energimyndigheten, Rapport ER 2006: nr 44, Eskilstuna, Sweden.
Deng C, Froese RE, Zhang S, Lu Y, Xu X, Li Q (2020) Development of improved and comprehensive growth and yield models for genetically improved stands. Ann For Sci 77, article id 89. https://doi.org/10.1007/s13595-020-00995-5.
Dubois H, Verkasalo E, Claessens H (2020) Potential of birch (Betula pendula Roth and B. pubescens Ehrh.) for forestry and forest-based industry sector within the changing climatic and socio-economic context of western Europe. Forests 11, article id 336. https://doi.org/10.3390/f11030336.
Egbäck S, Nilsson U, Nyström K, Högberg K-A, Fahlvik N (2017) Modeling early height growth in trials of genetically improved Norway spruce and Scots pine in southern Sweden. Silva Fenn 51, article id 5662. https://doi.org/10.14214/sf.5662.
Ekö P-M, Johansson U, Petersson N, Bergqvist J, Elfving B, Frisk J (2008) Current growth differences of Norway spruce (Picea abies), Scots pine (Pinus sylvestris) and birch (Betula pendula and Betula pubescens) in different regions in Sweden. Scand J For Res 23: 307–318. https://doi.org/10.1080/02827580802249126.
Elfving B (2011) A stand basal area growth function for whole Sweden. In: Growth modelling in the Heureka system. SLU, Faculty of Forestry.
European Central Bank (2020) Euro foreign exchange reference rates. https://www.ecb.europa.eu/stats/policy_and_exchange_rates. Accessed 19 October 2020.
Fahlvik N, Elfving B and Wikström P (2014) Evaluation of growth models used in the Swedish Forest Planning System Heureka. Silva Fenn 48, article id 1013. https://doi.org/10.14214/sf.1013.
Gailis A, Zeltiņš P, Purviņš A, Augustovs J, Vīndedzis V, Zariņa I, Jansons Ā (2020) Genetic parameters of growth and quality traits in open-pollinated silver birch progeny tests. Silva Fenn 54, article id 10220. https://doi.org/10.14214/sf.10220.
Gizachew B, Brunner A (2011) Density–growth relationships in thinned and unthinned Norway spruce and Scots pine stands in Norway. Scand J For Res 26: 543–554. https://doi.org/10.1080/02827581.2011.611477.
Haapanen M, Jansson G, Bräuner-Nielsen U, Steffenrem A, Stener L-G (eds) (2015) The status of tree breeding and its potential for imporving biomass production: a review of breeding activities and genetic gains in Scandinavia and Finland. Skogforsk, Uppsala.
Haapanen M, Hynynen J, Ruotsalainen S, Siipilehto J, Kilpeläinen ML (2016) Realised and projected gains in growth, quality and simulated yield of genetically improved Scots pine in southern Finland. Eur J Forest Res 135: 997–1009. https://doi.org/10.1007/s10342-016-0989-0.
Hagquist R, Hahl J (1999) Rauduskoivun siemenviljelysten jalostushyöty Etelä-ja Keski-Suomessa. [Genetic gain provided by seed orchards of silver birch in southern and central Finland]. Metsänjalostussäätiö.
Hynynen J, Niemistö P, Viherä-Aarnio A, Brunner A, Hein S, Velling P (2010) Silviculture of birch (Betula pendula Roth and Betula pubescens Ehrh.) in northern Europe. Forestry: J For Res 83: 103–119. https://doi.org/10.1093/forestry/cpp035.
Jansson G, Hansen JK, Haapanen M, Kvaalen H, Steffenrem A (2017) The genetic and economic gains from forest tree breeding programmes in Scandinavia and Finland. Scand J For Res 32: 273–286. https://doi.org/10.1080/02827581.2016.1242770.
Johansson U, Ekö P-M, Elfving B, Johansson T, Nilsson U (2013) Nya höjdutvecklingskurvor för bonitering. [New site index curves]. Fakta Skog 14: 1–6.
Kellomäki S, Peltola H, Nuutinen T, Korhonen KT, Strandman H (2008) Sensitivity of managed boreal forests in Finland to climate change, with implications for adaptive management. Philosophical Transactions of the Royal Society B 363: 2341–2351. https://doi.org/10.1098/rstb.2007.2204.
Kilpeläinen H, Linblad J, Heräjärvi H, Verkasalo E (2011) Saw log recovery and stem quality of birch from thinnings in southern Finland. Silva Fenn 45, article id 117. https://doi.org/10.14214/sf.117.
Korf V (1939) Prispevek k matematicke definici vzrustoveho zakona hmot lesnich porostu. [A mathematical definition of stand volume growth law]. Lesnicka Prace 18: 337–339.
Linnakoski R, Forbes KM, Wingfield MJ, Pulkkinen P, Asiegbu FO (2017) Testing projected climate change conditions on the Endoconidiophora polonica / Norway spruce pathosystem shows fungal strain specific effects. Front Plant Sci 8, article id 883. https://doi.org/10.3389/fpls.2017.00883.
Liziniewicz M, Berlin M, Karlsson B (2018) Early assessments are reliable indicators for future volume production in Norway spruce (Picea abies L. Karst) genetic field trials. Forest Ecol Manag 411: 75–81. https://doi.org/10.1016/j.foreco.2018.01.015.
Liziniewicz M, Nilsson U, Agestam E, Ekö P-M, Elfving B (2016) A site index model for lodgepole pine (Pinus contorta Dougl. var. latifolia) in northern Sweden. Scand J For Res 31: 583–591. https://doi.org/10.1080/02827581.2016.1167238.
McDill ME, Amateis RL (1992) Measuring forest site quality using the parameters of a dimensionally compatible height growth function. For Sci 38: 409–429. https://doi.org/10.1093/forestscience/38.2.409.
Näslund M (1936) Skogsförsöksanstaltens gallringsförsök i tallskog [Scots pine thinning experiments]. Sveriges lantbruksuniversitet. Meddelanden från Statens skogsförsöksanstalt 29:1, Stockholm, Sweden.
Netherer S, Matthews B, Katzensteiner K, Blackwell E, Henschke P, Hietz P, Pennerstorfer J, Rosner S, Kikuta S, Schume H, Schopf A (2015) Do water-limiting conditions predispose Norway spruce to bark beetle attack? New Phytol 205: 1128–1141. https://doi.org/10.1111/nph.13166.
Nilsson P, Roberge C, Fridman J (2021) Skogsdata: aktuella uppgifter om de svenska skogarna från SLU Riksskogstaxeringen 2021. Tema: Fjällskogen. [Forest data: current information on the Swedish forests from SLU The National Forest Inventory 2021. Theme: the mountatin forests]. Institutionen för skoglig resurshushållning, SLU, Umeå, Sweden.
Nilsson U, Berglund M, Bergquist J, Holmstrom H, Wallgren M (2016) Simulated effects of browsing on the production and economic values of Scots pine (Pinus sylvestris) stands. Scand J For Res 31: 279–285. https://doi.org/10.1080/02827581.2015.1099728.
Pääkkönen E, Vahala J, Pohjola M, Holopainen T, Kärenlampi L (1998) Physiological, stomatal and ultrastructural ozone responses in birch (Betula pendula Roth.) are modified by water stress. Plant Cell Environ 21: 671–684. https://doi.org/10.1046/j.1365-3040.1998.00303.x.
Pöykkö S (2018) Finnish birch breeding and seed production. Fagráðstefna skógræktar 2018, Þemadagur NordGen. Proceedings of professional conference on forestry 2018, NordGen Thematic, Iceland.
R Core Team (2019) R: a language and environment for statistical computing. R Foundation for Statistical Computing, Vienna, Austria. https://www.R-project.org/.
Rosvall O (ed) (2011) Review of the Swedish tree breeding program. Skogforsk, Uppsala.
Rosvall O, Wennström U (2008) Förädlingeffekter för simulering med Hugin i SKA. [Processing effects for simulation with Hugin in SKA]. Arbetsrapport 665, Skogforsk.
Rosvall O, Jansson G, Andersson B, Ericsson T, Karlsson B, Sonesson J, Stener L-G (2001) Genetiska vinster i nuvarande och framtida fröplantager och klonblandningar. [Genetic gain from present and future seed orchards and clone mixes]. Redogörelse, Siftelsen Skogsbrukets Forsakningsinstitut, Skogforsk, Uppsala.
Skogsstyrelsen Statistical Database (2020) [Dataset] http://pxweb.skogsstyrelsen.se/pxweb/en/Skogsstyrelsens%20statistikdatabas/?rxid=ad4b724f-4809-40f9-ab13-70440ae1792b. Accessed 30 September 2020.
Sonesson J, Albrektsson A, Karlsson A (1994) Björkens produktion på nedlagd jordbruksmark i Götaland och Svealand. [Birch production on abandoned agricultural land in Götaland and Svealand]. Rapport nr 88, Department of Silviculture, Swed Univ Agric Sci, Umeå, Sweden.
Stener L-G, Hedenberg Ö (2003) Genetic parameters of wood, fibre, stem quality and growth traits in a clone test with Betula pendula. Scand J For Res 18: 103–110. https://doi.org/10.1080/02827580310003678.
Stener L-G, Jansson G (2005) Improvement of Betula pendula by clonal and progeny testing of phenotypically selected trees. Scand J For Res 20: 292–303. https://doi.org/10.1080/02827580510036265.
Stener L-G, Rytter L, Jansson G (2017) Effects of pruning on wood properties of planted silver birch in southern Sweden. Silva Fenn 51, article id 1713. https://doi.org/10.14214/sf.1713.
Terrier A, Girardin MP, Périé C, Legendre P, Bergeron Y (2013) Potential changes in forest composition could reduce impacts of climate change on boreal wildfires. Ecol Appl 23: 21–35. https://doi.org/10.1890/12-0425.1.
Viherä-Aarnio A, Velling P (2017) Growth, wood density and bark thickness of silver birch originating from the Baltic countries and Finland in two Finnish provenance trials. Silva Fenn 51, article id 7731. https://doi.org/10.14214/sf.7731.
von Bertalanffy L (1949) Problems of organic growth. Nature 163: 156–158. https://doi.org/10.1038/163156a0.
Weiskittel AR, Hann DW, Kershaw Jr JA, Vanclay JK (2011) Forest growth and yield modelling. John Wiley & sons, Hoboken, New Jersey, USA. https://doi: 10.1016/j.foreco.2009.04.029.
Total of 53 references.
