Benjamin Allen  ,
Michele Dalponte,
Ari M. Hietala,
Hans Ole Ørka,
Erik Næsset,
Terje Gobakken
,
Michele Dalponte,
Ari M. Hietala,
Hans Ole Ørka,
Erik Næsset,
Terje Gobakken
Detection of Root, Butt, and Stem Rot presence in Norway spruce with hyperspectral imagery
Allen B., Dalponte M., Hietala A. M., Ørka H. O., Næsset E., Gobakken T. (2022). Detection of Root, Butt, and Stem Rot presence in Norway spruce with hyperspectral imagery. Silva Fennica vol. 56 no. 2 article id 10606. https://doi.org/10.14214/sf.10606
Highlights
- Hyperspectral imagery can be used to detect Root, Butt, and Stem Rot in Picea abies with moderate accuracy
- Spectral derivatives improved classification accuracy
- Bands around 540, 700, and 1650 nm tended to be the most important for classification models.
Abstract
Pathogenic wood decay fungi such as species of Heterobasidion are some of the most serious forest pathogens in Europe, causing rot of tree boles and loss of growth, with estimated economic losses of eight hundred million euros per year. In conifers with low resinous heartwood such as species of Picea and Abies, these fungi are commonly confined to heartwood and thus external infection signs on the bark or foliage of trees are normally absent. Consequently, determining the extent of disease presence in a forest stand with field surveys is not practical for guiding forest management decisions such as optimal rotation time. Remote sensing technologies such as airborne laser scanning and aerial imagery are already used to reduce the reliance on fieldwork in forest inventories. This study aimed to use remote sensing to detect rot in spruce (Picea abies L. Karst.) forests in Norway. An airborne hyperspectral imager provided information for classifying the presence or absence of rot in a single-tree-based framework. Ground reference data showing the presence of rot were collected by harvest machine operators during the harvest of forest stands. Random forest and support vector machine algorithms were used to classify the presence and absence of rot. Results indicate a 64% overall classification accuracy for presence-absence classification of rot, although additional work remains to make the classifications usable for practical forest management.
Keywords
Picea abies;
Heterobasidion;
remote sensing;
root rot;
hyperspectral imagery;
forest pathology
-
Allen,
Faculty of Environmental Sciences and Natural Resource Management, Norwegian University of Life Sciences, P.O. Box 5003, NO-1432 Ås, Norway
E-mail
benjamin.allen@nmbu.no
- Dalponte, Department of Sustainable Agro-ecosystems and Bioresources, Research and Innovation Centre, Fondazione E. Mach, Via E. Mach 1, 38098 San Michele all’Adige (TN), Italy E-mail michele.dalponte@fmach.it
- Hietala, Norwegian Institute of Bioeconomy Research, Innocamp Steinkjer, Skolegata 22, NO-7713 Steinkjer, Norway E-mail Ari.Hietala@nibio.no
- Ørka, Faculty of Environmental Sciences and Natural Resource Management, Norwegian University of Life Sciences, P.O. Box 5003, NO-1432 Ås, Norway E-mail hans-ole.orka@nmbu.no
- Næsset, Faculty of Environmental Sciences and Natural Resource Management, Norwegian University of Life Sciences, P.O. Box 5003, NO-1432 Ås, Norway E-mail erik.naesset@nmbu.no
- Gobakken, Faculty of Environmental Sciences and Natural Resource Management, Norwegian University of Life Sciences, P.O. Box 5003, NO-1432 Ås, Norway E-mail terje.gobakken@nmbu.no
Received 4 July 2021 Accepted 16 February 2022 Published 21 February 2022
Views 54681
Available at https://doi.org/10.14214/sf.10606 | Download PDF

Supplementary Files
1 Introduction
Root, butt, and stem rot (RBSR) caused by pathogenic white-rot fungi is a major problem in conifers with low resinous heartwood, such as species of Picea and Abies. Most of the damages are caused by basidiomycetes in the genera Heterobasidion and Armillaria. Since in stems these fungi are primarily confined to heartwood, the affected trees can survive even decades of infection as long as the root system remains sufficiently functional and the water-conductive sapwood does not become too diminished.
Approximately 80% of RBSR infection in Norway, at least at low altitudes, is caused by fungi from the genus Heterobasidion (Huse et al. 1994). Two species within this genus cause RBSR in Norway spruce (Picea abies L. Karst.) in northern Europe: Heterobasidion parviporum Niemelä & Korhonen and Heterobasidion annosum s.s. (Fr.) Bref. Of the two, H. parviporum is more widespread within Norway and is able to colonize a larger portion of the tree bole, commonly reaching heights of 4–7 m (Solheim 2006). Heterobasidion species spread through two mechanisms. Primary spread to a healthy forest stand occurs via airborne basidiospores released from fungal fruiting bodies on infested trees. These spores land on tree wounds, or on fresh stumps after trees have been harvested. The secondary spread of the pathogen in an infested stand takes place via vegetative spread of its mycelia through root contacts between neighboring trees (Asiegbu et al. 2005).
Armillaria is the second most common genus of RBSR fungi in Norway, with four species known to be present (Roll-Hansen 1985). Unlike Heterobasidion, it is usually confined to the lower 1–2 meters of the tree bole (Solheim 2006). Armillaria causes the heartwood of spruce trees to completely rot away, leaving a hollow core. Spread occurs in a similar manner to Heterobasidion, although Armillaria rhizomorphs can spread through the soil (Redfern and Filip 1991), whereas mycelial spread of Heterobasidion in spruce forests is believed to require direct root contact (Hodges 1969).
In Norway, RBSR fungi primarily infect Norway spruce, although Scots pine (Pinus sylvestris L.), and birch species are also susceptible. By damaging wood in the lower bole, the fungus renders potential sawtimber suitable only for pulpwood or energy purposes, as rotten wood lacks the strength required for sawtimber. This reduces the economic value of the infected tree. Furthermore, infection by RBSR can reduce the growth rate of trees, leading in turn to both economic losses and reduced carbon sequestration (Oliva et al. 2012). Within Norway, RBSR is estimated to infect one out of every five Norway spruce trees, leading to about 10 million Euros worth of economic damage every year (Huse et al. 1994).
Heterobasidion and Armillaria are also serious forest pests outside of Norway. In Europe as a whole, damage from Heterobasidion is estimated to be greater than 800 million Euros per year (Asiegbu et al. 2005). Heterobasidion annosum s.s. is particularly destructive due to its tendency to kill infected pine trees. Other Heterobasidion species are present in North America, where they are native to both the western and eastern parts of the continent. In central North America, Heterobasidion irregulare Garbel. & Otrosina is invasive (no native Heterobasidion species are present in the region), and currently poses a threat to native pine trees (Otto et al. 2021). Heterobasidion species are difficult to eradicate from a stand due to their ability to survive in roots after trees have been cut, and certain species are capable of virtually destroying pine plantations.
Field identification of RBSR-infected spruce trees is difficult. At an advanced stage of root and stem decay, trees may show visual signs of infection such as increased resin production and occasionally yellowing of tree crowns. However, Vollbrecht and Agestam (1995) found that professional foresters were unable to outperform random selection when identifying RBSR-infected spruce trees at a series of sites in Sweden. Kurkela (2002) found similar results for Scots pine in Finland: while visible crown variables such as density, crown length, and foliage color were correlated with infection severity, attempts to classify infected trees in the field yielded poor results. Since there may not be visual signs of infection, detection of RBSR infection requires coring trees, a costly procedure when applied on a large scale. Furthermore, the cost of field surveys means that only selected field plots can be sampled during normal forest inventory procedures, limiting our ability to map the presence of RBSR at a landscape scale. These points suggest that remote sensing may be a useful alternative or complement to field surveys. Since remotely sensed data can be collected wall-to-wall throughout a study area, it may be possible to map the presence of RBSR throughout any particular stand. The ability to identify infected trees could inform treatment and forest management decisions. For example, heavily infected stands may require early tree harvesting to minimize economic losses from RBSR. In some cases, it may be desirable to plant a mix of tree species to reduce the prevalence of the disease. Finally, early detection of invasive RBSR fungi in areas where they are not endemic could allow for control measures to be taken to limit the spread and ensuing ecological damage. The current spread of H. irregulare in Italy (Gonthier et al. 2012), a North American species introduced accidentally to Europe, serves as one example here. Possible control measures include logging during periods of low spore abundance and treating cut stumps with borax to prevent spore germination (Garboleto and Gonthier 2013).
Hyperspectral imagery and other remote sensing technologies have been well studied as a means to identify plant health issues, including plant diseases. Some of the health issues which have been studied with remote sensing include bark beetle infestations (Meddens et al. 2013), stress from elevated soil carbon dioxide (Male et al. 2010), nutrient levels (Peng et al. 2020), and water stress (Fensholt et al. 2010; Behmann et al. 2014). With reference to optical remote sensing in particular, there are several portions of the electromagnetic spectrum which can provide information on plant health. The visible portion of the spectrum is influenced by the amount of chlorophyll and other pigments in foliage. Chlorophyll absorbs blue and red light most strongly, leading to low reflectance in these bands. In the near-infrared (NIR) portion of the spectrum, reflectance is primarily determined by the cellular structure of leaves. The boundaries between mesophyll cells and air scatter infrared light, while there is little absorption from plant pigments. Consequently, healthy vegetation will have high reflectance in the NIR. Unhealthy vegetation with lower chlorophyll content or altered internal leaf structure will tend to have a smaller difference between the red and near-infrared reflectance than healthy vegetation (Male et al. 2010). Specific bands in the red and red-edge are influenced by chlorophyll fluorescence, which in turn reflects the health of vegetation. Shortwave infrared (SWIR) bands may respond to plant water content, which is often reduced in stressed vegetation. Water is particularly absorbent in bands around 1450 nm and 1800 nm, and healthy vegetation with high water content may show reduced reflectance in these bands compared to stressed vegetation (Fensholt et al. 2010).
To date, there has been relatively little research focused on the detection of root and stem rot fungi in trees via remote sensing. Much of the work which has been done has focused on detection of decay associated with white-rot fungi of the genus Ganoderma in oil palm plantations. Ganoderma species can kill oil palm trees quickly (within 6–12 months) and cause severe yellowing of the foliage which is observable by humans during field inspection (LeLong et al. 2010). LeLong et al. (2010) classified the presence of this disease according to the severity of infection and obtained classification accuracies greater than 90%, showing that some fungal diseases of trees can be identified with remote sensing.
Leckie et al. (2010) classified the severity of infection with the white-rot basidiomycete Phellinus weirii (Murill) Gilb. in Douglas fir forests of British Columbia, Canada using a multispectral sensor. Their classification scheme included eight classes, and they achieved a classification accuracy of 62.5%, rising to 82% when errors of +/–1 severity class were tolerated. Similarly to Ganoderma spp. on oil palm, P. weirii can cause extensive needle yellowing and defoliation, and even tree death. In Norway spruce, Heterobasidion and Armillaria often produce no visual changes to foliage, and rarely cause death. As a result, P. weirii should be expected to be easier to detect with remote sensing than Heterobasidion and Armillaria species infecting Norway spruce. Kankaanhuhta et al. (2000) used multispectral imagery in an area-based framework to detect RBSR on Norway spruce and Scots pine in southern Finland, and the results of this study confirm this expectation. Their method failed to detect infection in spruce trees but succeeded at detecting Heterobasidion infection in pine. This result is likely due to the greater effect which Heterobasidion has upon foliage color and crown density in pine than in spruce. Heterobasidion associates strongly with sapwood in pine (but not in spruce), triggering excessive resin production in response which disrupts water transport in sapwood, which in turn affects foliage health.
In contrast to Kankaanhuhta et al. (2000), who relied on multispectral imagery, our study uses hyperspectral imagery. Hyperspectral sensors gather information across a wider portion of the electromagnetic spectrum than multispectral sensors, which are limited to a small number of bands covering a narrow portion of the spectrum. The continuous spectral coverage of hyperspectral sensors allows for the detection of spectral differences which may not be detected with multispectral sensors.
There were two primary goals to this study. The first was to assess whether hyperspectral imagery would allow for the identification of RBSR infected trees. Secondarily, the study aimed to discover which spectral bands respond the most strongly to RBSR infection, either due to changes in plant pigments or water content. Determining the most important spectral bands could help to guide future instrument selection for remote sensing-based studies of RBSR prevalence.
2 Material and methods
2.1 Study area
The study area is located in Etnedal municipality, southeastern Norway (60°53´N, 09°42´E), covering 1020 hectares (Fig. 1). The area has steep terrain, with elevation ranging from ~300 to 750 m. Forest cover is dominated by Norway spruce, with Scots pine and birch species also present.
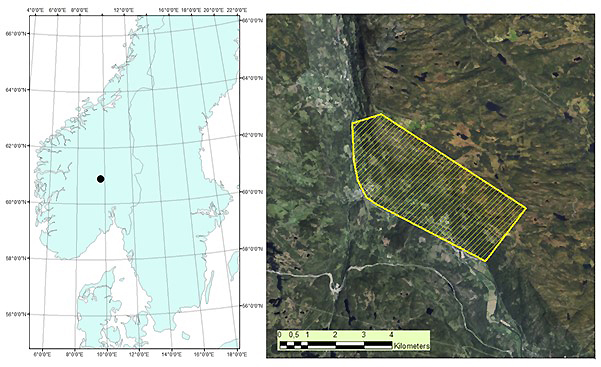
Fig. 1. Map of root, butt, and stem rot study area (yellow) in Etnedal. Location within Norway shown on left.
2.1.1 Ground reference data
Ground reference data were collected by a cut-to-length harvester equipped with accurate positioning systems (Noordermeer et al. 2020). The harvest machine was equipped with a high accuracy differential Global Navigation Satellite Systems (GNSS) receiver. As the harvester head grabbed each tree, sensors recorded the location of each tree relative to the machine cabin. In this way, a complete stem map of each harvested stand with single-tree coordinates with sub-meter accuracy can be provided (Noordermeer et al. 2020). All harvesting was conducted within six months after the remotely sensed data were collected. This method resulted in the collection of data from 7288 spruce trees within our study area. Field control measurements of 288 randomly selected trees using survey-grade GNSS receivers have shown a mean distance of 0.88 meters between the harvester positioning and the control measurements. Of these control trees, 140 were located within the area of the current study. For these trees, distances between harvester positioning and control measurements ranged from 0.20 to 1.27 m, with 0.69 and 0.71 m as mean and median, respectively (Site 6, Noordermeer et al. 2020). These figures should be generally representative of the accuracy of the harvester-derived tree positions. One caveat, however, is that the harvester has a telescopic boom which varies in length from 0to 2.14 m, and this length is not recorded by any sensor. When tree positions are determined, the boom is assumed to be in the middle position (1.07 m), as visual assessments during the field work indicated that most control trees were felled with the telescopic boom in an approximate middle position. In very steep terrain, the telescopic boom may be fully extended more frequently, and the accuracy of the tree locations may suffer somewhat. At most, mean positioning errors could increase to 1.07 m, and this would only occur if the boom was fully extended all of the time, which is an unlikely scenario.
As the trees were cut, the machine operator recorded the presence or absence of RBSR by visual assessment, as well as a quantitative visual assessment of rot severity, expressed as a percentage of the cross-sectional area of the tree, in two classes (0–50%, 51–100%). Furthermore, tree diameter was recorded automatically at 10 cm intervals along the bole, allowing for estimates of tree height and volume to be made with the use of allometric models. Rot height was estimated for each of the two rot classes by taking the halfway point between the last cut with rot in a given category, and the subsequent cut. For example, suppose that a cut was placed at a height of 5 m, and the area covered by rot was between 0and 50% of the stem area, while the next cut was placed at a height of 9 m, and no rot was present. The maximum rot height for the 0–50% class would be recorded as 7 m. This method implies there is an uncertainty associated with the rot height, but it is the best estimation method possible with the data. Further, this error is likely purely random, i.e., without any systematic component.
Of the 7288 spruce trees in the dataset, 1652 suffer from RBSR. Without genetic analysis, it is impossible to ascertain the fungal species responsible for infection. However, unpublished data from a study by Huse et al. (1994) indicates that in Etnedal municipality, 62% of RBSR-infected trees were infected with Heterobasidion alone, 15% with Armillaria alone, and 13% with both Heterobasidion and Armillaria. Other fungal species accounted for only 11% of infection in their data. Thus, it is likely that the majority of RBSR-infected trees in our study area are infected with members of the genera Heterobasidion and Armillaria.
2.1.2 Remotely sensed data
Hyperspectral images were collected for the study area on August 3rd, 2019 using a fixed wing aircraft carrying two HySpex sensors: VNIR-1800 and SWIR-384. The flying altitude was 1150 m above the ground, and a terrain-following strategy was utilized. VNIR images contained 186 bands covering 400 nm to 1000 nm, with a bandwidth of 3 nm and spatial resolution of 30 cm. SWIR images consisted of 288 bands spanning from 950 nm to 2530 nm with a bandwidth of approximately 5 nm and a spatial resolution of 80 cm. For the purposes of analysis, the SWIR images were resampled to 30 cm to match the pixel sizes for the shorter wavelengths. Resampling was performed via the nearest neighbor method to avoid alteration of values. The images were provided in the form of strips corresponding to each flight line and were subsequently mosaiced together. Images were normalized to one another based on pixel values in the overlap zones to correct for illumination differences between flightlines (Yuan and Elvidge 1996; Yu et al. 1999). No further atmospheric correction was applied, as all images were collected on one day within an 86 minute period and each flight-line took only four minutes to fly. Previous studies have found minimal benefits to atmospheric correction when only one date of imagery is used (Lin et al. 2015). Airborne laser scanning (ALS) data were collected during the same flight with a point density of 17.6 pts m–2 using the Leica ALS70-HP system.
2.2 Data preparation
For this study, an individual tree crown (ITC) approach was utilized. ITCs were delineated based on the ALS data collected concurrently with the hyperspectral data. ITCs were generated with the R package itcSegment (Dalponte 2018). This package creates a canopy height model (CHM) on the fly at a spatial resolution set by the user. Fine resolutions increase processing time, while coarse resolutions may lead to reduced segmentation accuracy. We set the resolution at 25 cm, based on experimentation which found this resolution to be satisfactory for producing accurate segments without excessive consumption of computing power. A 9 × 9 moving window was used to identify peaks in the CHM which correspond to the apexes of tree crowns. The ITCs were then grown outward until a maximum size was reached, or the CHM height fell below a certain percentage of the apex height (70% in this case).
Harvester data and remotely sensed data were linked via a matching procedure. The distance between each tree location from the harvester data and the centroid of each ITC was calculated in the X and Y directions. The difference in the Z direction was also calculated to reduce the chances of matching understory trees when overstory trees are a more appropriate match. The value of the CHM at each centroid was used as the height value for the ITCs, while heights for each tree were estimated from the diameter profiles recorded in the harvester data, using allometric models. Whichever tree was closest in terms of three-dimensional Euclidean distance was matched to that ITC. Only matches with distances <3 m were kept. This practice is intended to reduce faulty matches, which may be caused by inaccuracies in the tree positioning, or the ITC generation process.
For each ITC which possessed a matching harvested tree, the mean value of each spectral band from the hyperspectral data were computed, using the pixels falling within each ITC. Pixels with NDVI values less than 0.55 were treated as shadows and excluded from this mean value to reduce the effect of tree shadows on the means. Based on these mean values, several spectral indices were computed, and these are listed in Table 1. Spectral indices can help to account for variations in reflectance which are due to lighting, terrain, and other variables besides the inherent properties of the vegetation itself. Each index will also correlate with some vegetation property such as chlorophyll or water content, making these indices useful predictors of plant health (Zhou et al. 2020). The first and second derivative values for the spectral profile were also computed. Wu et al. (2020) used first derivatives and spectral indices to detect the presence of pine wood nematode (Bursaphelenchus xylophilus (Steiner & Buhrer) Nickle) in Pinus massoniana Lamb., a disease which causes yellowing of foliage and rapid tree death. Their work motivated our interest in testing spectral derivatives. Similarly to spectral indices, spectral derivatives can correct for variations in lighting across an image, as derivatives measure not the value of spectral reflectance, but how quickly the reflectance is changing from one band to the next. Furthermore, some important spectral features, such as the “red edge” are defined in terms of spectral derivatives (Curren et al. 1991).
| Table 1. Spectral indices and derivatives calculated from hyperspectral data. | ||
| Abbreviation | Variable name | Reference |
| NDVI* | Normalized Difference Vegetation Index | Rouse et al. 1973 |
| SRI | Simple Ratio Index | Birth and McVey 1968 |
| ARVI* | Atmospherically Resistant Vegetation Index | Kaufman and Tanre 1992 |
| RENDVI | Red Edge Normalized Difference Vegetation Index | Sims and Gammon 2002 |
| MRESRI | Modified Red Edge Simple Ratio Index | Datt 1999 |
| MRENDVI | Modified Red Edge Normalized Difference Vegetation Index | Datt 1999 |
| VREI1 | Vogelmann Red Edge Index 1 | Vogelmann et al. 1993 |
| REPI | Red Edge Position Index | Curran et al. 1995 |
| SIPI | Structure Insensitive Pigment Index | Penuelas et al. 1995 |
| RGRI* | Red Green Ratio Index | Gammon and Surfus 1999 |
| WBI | Water Band Index | Panuelas et al. 1993 |
| NDWI | Normalized Difference Water Index | Gao 1995 |
| MSI | Moisture Stress Index | Ceccato et al. 2001 |
| NDII | Normalized Difference Infrared Index | Hardisky et al. 1983 |
| Dvn1 | First Derivative of VNIR Spectra | |
| Dvn2 | Second Derivative of VNIR Spectra | |
| Dsw1 | First Derivative of SWIR Spectra | |
| Dsw2 | Second Derivative of SWIR Spectra | |
| Astrices (*) indicate a broad-band index. All others are narrow-band. | ||
2.3 Statistical analysis
Classification analysis was conducted for this study, with the presence or absence of RBSR treated as the response variable. Spectral band values, indices, and spectral derivative values were the predictor variables. Two non-parametric modelling methods were utilized for classification: support vector machines (SVM) and random forest (Cortes and Vapnik 1995; Breiman 2001). Both of these methods have been shown to function well when input data exhibit multicollinearity, which is quite common for spectral data. We chose to use two modelling methods to see if one delivered superior classification results to the other. Including random forest modelling allowed us to generate variable importance metrics, which could potentially help guide the selection of spectral bands and indices for future research.
The full dataset was divided into training and testing datasets using a 70/30 split respectively. Because non-RBSR trees were more abundant than RBSR trees, it was necessary to correct for imbalanced class sizes when performing classification. In the absence of such correction, the accuracy of the more abundant class would be maximized at the expense of the less abundant class. This was accomplished by resampling the data in a stratified manner with equal class sizes. Sample weights, which reduce the influence of outliers in the data, were also tested for SVM classification to see if they improved classification accuracy. Feature selection was also performed to reduce the dimensionality of the prediction data, using a method based on the Jeffries Matusita distance which has previously been used for tree species classification (Dalponte et al. 2008). This method does not select a set number of features, but rather selects the variables which provide the greatest amount of information according to the Jeffries Matusita distance. We also attempted to tune the SVM and RF models by experimenting with different parameters. For SVM, the parameter C was varied from 1 to 1000. This parameter controls the influence of outlier datapoints on the classification mode. For RF, 500 trees were built and the number of variables at each node was varied between one and thirteen, with five delivering the optimum performance. Classification models were assessed based on the kappa statistic. Overall accuracy and the producer’s and user’s accuracies for each class also reported.
Once the classifications were completed, a binary logistic regression was performed to see if any characteristics of the trees could explain the likelihood of a tree being correctly or incorrectly classified. The predictor variables for this modelling included the Euclidean distance between the tree apex and the centroid of the matching ITC, the rot severity class, and tree diameter.
3 Results
Fig. 2 shows the average reflectance values for the various bands for the rot and non-rot class trees. The largest absolute differences are generally in the near infrared, along with some wavelengths in the shortwave infrared. Differences in the visible portion of the spectrum are rather small, which is consistent with the extreme difficulty involved in identifying RBSR infected spruce trees in the field from foliar signs alone.
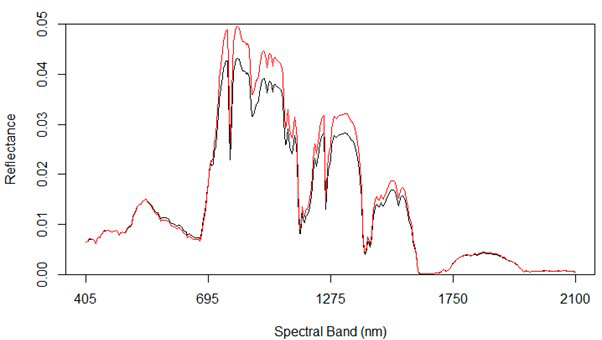
Fig. 2. Spectral graph of hyperspectral data showing both uninfected (red) and infected (black) trees.
Table 2 shows the five best classifications produced by SVM, as well as the best classification without spectral derivatives. The confusion matrices can be found in Supplementary file S1. The highest kappa value was 0.19, and the overall accuracy of this classification was 61.94%. All of the five best classifications used spectral derivatives. The most accurate classification without these variables produced an overall accuracy of 59.90% and a kappa of 0.180, as shown in the last line of Table 2. False positives were prevalent whether derivatives were included or excluded and in fact were more prevalent than true positives. There were no major differences in the characteristics of the correctly classified trees as opposed to those which were incorrectly classified. DBH did not significantly affect the likelihood that a tree was classified correctly, and neither did the Pythagorean distance between the tree and the ITC centroid of field data to ITC matching. Thus, it does not appear that errors in ITC matching can explain classification errors.
| Table 2. Support vector machine (SVM) classification results of rot detection. | ||||||
| Variable combinations1 | PA-No Rot2 | PA-Rot | UA-No Rot3 | UA-Rot | OA4 | Kappa |
| VNIR_INDEXES_Dvn2 | 61.21 | 64.40 | 85.44 | 32.7 | 61.94 | 0.190 |
| VNIR_Dvn2 | 59.74 | 65.25 | 85.45 | 32.24 | 61.03 | 0.184 |
| VNIR_SWIR_INDEXES_Dvn1_Dvn2 | 59.87 | 65.01 | 85.37 | 32.19 | 61.03 | 0.183 |
| VNIR_SWIR_Dvn1 | 59.69 | 65.13 | 85.39 | 32.13 | 60.92 | 0.181 |
| VNIR_SWIR_Dvn1_Dvn2 | 59.30 | 65.49 | 85.43 | 32.05 | 60.70 | 0.181 |
| VNIR_SWIR | 57.70 | 67.43 | 85.80 | 31.85 | 59.90 | 0.180 |
| 1 Variable combinations refer to the groups of variables which were included in the model. They are labelled as follows: VNIR: Average values of VNIR Bands; SWIR: Average Values of SWIR Bands; Dvn1: 1st derivatives of VNIR Bands; Dvn2: 2nd derivatives of VNIR Bands; Dsw1: 1st derivatives of SWIR bands; Dsw2: 2nd derivatives of SWIR bands; INDEXES: Spectral indices. For example, the model run labelled VNIR_INDEXES_Dvn2 included only VNIR spectral values, spectral indices, and second derivatives of the VNIR bands. 2 PA: Producer’s Accuracy. 3 UA: User’s Accuracy. 4 OA: Overall Accuracy. | ||||||
Random forest classification produced similar accuracies to SVM. Table 3 shows the confusion matrix from the best random forest classification. The overall accuracy for this classification was 64.81%, with a kappa of 0.27. Interestingly, class accuracies were very similar to each other, with the producer’s and user’s accuracies of both the rot and rot-free classes falling between 59.61% and 70.04%.
| Table 3. Confusion matrix for the best random forest classification of rot presence. | ||||
| Prediction | Reference | |||
| No Rot | Rot | Total | User’s Accuracy (%) | |
| No Rot | 307 | 141 | 448 | 68.52 |
| Rot | 208 | 336 | 544 | 61.76 |
| Total | 515 | 477 | 992 | |
| Producer’s Accuracy (%) | 59.61 | 70.04 | ||
| Overall Accuracy | 64.81 | κ: 0.27 | ||
An advantage of random forest classification is the ability to produce variable importance assessments. For this reason, the effect of excluding certain variable classes was not shown as for SVM. The mean decrease in accuracy indicates how much the accuracy of the model decreases when a specific variable is removed, while the mean decrease in Gini reflects the additional heterogeneity introduced into the nodes and leaves of each tree when a variable is removed (Fig. 3). Spectral derivatives were the most important variables by far; nine out of the ten most important variables were spectral derivatives. This is true whether importance is measured by the contribution of the variable to model accuracy or its contribution to node purity. In particular, the derivatives of VNIR bands 86–96 (674–708 nm) and 43–44 (537–544 nm) tend to rank highly in importance, as do the derivatives of SWIR bands 124–126 (1576–1591 nm) and band 135 (1631 nm). The VNIR bands roughly correspond to the “red edge” of the electromagnetic spectrum along with two green bands, while the SWIR bands are centered around a local maximum in the reflectance of healthy vegetation, located between areas of atmospheric water absorption.
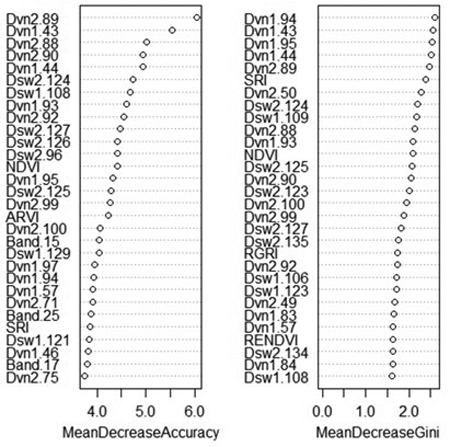
Fig. 3. Variable importance plot from random forest classification of rot presence. Variables marked “Band” are average reflectance values; “Dvn” refers to a derivative of a band from the VNIR sensor, while “Dsw” refers to a derivative of a band from the SWIR sensor. The numbers after the variable name refer to the number of each band, or the spectral derivative thereof. MeanDecreaseAccuracy: decrease in model out-of-bag accuracy when a specific variable is removed. MeanDecreaseGini: additional heterogeneity introduced into the nodes and leaves of each tree when a variable is removed.
4 Discussion
The results from this study suggest that classification of H. annosum presence or absence holds some promise, although substantial work remains to produce usable classifications. The primary problems with the current classifications are the high rate of false-positives, and the modest accuracies achieved by the classifications. While classification accuracies were above 60% overall for SVM, a majority of trees classified as infected were actually healthy. This problem was not observed in the random forest classification, which delivered balanced class accuracies where a majority of positives were true, rather than false. One possible cause of the high false positive rate is that some of these trees may have other health issues which are affecting the spectral properties of the foliage. Unfortunately, since other tree health issues were not recorded during the harvest, this hypothesis was not possible to test at the present time. It is also possible that some trees may have fungal infestation in the roots, but no rot within the stem. Since no root excavations were performed for this study, these trees would be labelled as healthy in our datasets, even though they are infected with RBSR.
Possible methods for reducing false positive rates include utilizing additional remotely sensed data and attempting other classification models. ALS data can supply information about tree crown shape and foliage density, which may be altered by the presence of RBSR. Zemaitis & Zemaite (2018) found that crown foliage density in Norway spruce was affected by RBSR (although the effect was rather small), while Pitkänen et al. (2021) found statistically significant differences in relative crown length between healthy and RBSR-infected Scots pine in Finland using terrestrial laser scanning (TLS) data. Future work should test whether these effects are detectable with ALS data. Furthermore, repeated ALS acquisitions could also allow for measurement of height growth over time (Noordermeer et al. 2020). If certain trees grow less than others, it could be due to decay related reduction in functional root and stem xylem, and allocation of resources to defense response at the interface between heartwood and sapwood, or to site conditions such as soil fertility. In this way, ALS may allow us to distinguish between trees on productive and unproductive sites, which could remove a confounding variable and reduce the false positive rate. This should be tested in future work.
False positives were also a significant problem for Leckie et al. (2004) in their attempt to classify Phellinus weirii, albeit less so than in our study. False positives were most common for lightly infected tree classes, with the false positive rate being much lower for heavily infected classes. In contrast to their results, our study did not find any significant difference in classification accuracy depending upon the severity of rot infection in a tree. Trees in the low rot severity class were just as likely to be classified incorrectly as those in the high rot severity class, and the maximum rot height did not have any effect on the probability of incorrect classification.
The results of this study do not give the final answer regarding the most important bands and variables for identification of RBSR, but they are instructive. Spectral derivatives appear to increase overall classification accuracy and the kappa value. As both SWIR and VNIR band-derived variables were used for the best models, it appears that both spectral regions are useful for classifying the presence of rot, and future attempts to identify RBSR should make use of both, if possible. The most important bands (and their derivatives) were generally those around 700 and 1650 nm. Consequently, future research should attempt to make use of these bands, regardless of whether hyperspectral or multispectral sensors are chosen. An important caveat to these results is that it is impossible to know what effect other pathogens or pests may have had on the spectral signatures of the infected and the rot-free trees. It is also important to note that our study only focused on RBSR in a tree species where it can take several decades of decay fungus colonization to result in tree mortality, wind fell or stem breakage. It is possible that efforts to detect RBSR in tree species which succumb to infection (such as Pinus sylvestris) may be more successful, although research would be required to determine this.
The modest classification accuracies obtained by this study and the relatively high cost of collecting hyperspectral imagery should not deter such work. Since certain RBSR fungi are invasive species and cause significant ecological damage outside of their native range, the cost of monitoring infection via remote sensing may not be as relevant as in areas where the fungi are native and result in minor damage. Heterobasidion irregulare, for example is native to parts of North America but is an introduced species in Europe. Within Europe, the disease is currently limited to a small area in Italy, and both the ecological and economic costs if it spread beyond that zone could be catastrophic. In this context, the cost of hyperspectral imagery can be more easily justified.
5 Conclusion
The results of this study suggest that it may be possible to use hyperspectral imagery to detect RBSR, even in cases where there are no visible signs of infection. Nevertheless, substantial work remains before remotely sensed data can be used to inform RBSR control programs. Future work should seek to improve classification accuracy by incorporating additional remotely sensed data such as ALS, or by testing other classification algorithms. The current classification accuracies are likely great enough to estimate the percentage of trees in a stand which are infected, but not necessarily great enough for mapping each infected tree with a high level of precision. Since RBSR usually does not kill spruce trees and harvest and silvicultural discissions are carried out on stand level, it is likely that such stand-level estimates of infection prevalence are adequate for reducing economic losses from RBSR in Norway. An economic analysis would be necessary to determine the magnitude of the loss reduction. By contrast, for tree species which die from RBSR infection, higher classification accuracies will probably be necessary. This is especially true in areas where a fungus is invasive, as detection programs will likely aim to identify individual infected trees to facilitate their removal and to prevent the fungus from spreading more broadly within a stand of trees. Additionally, attempts should be made to use lower-cost multispectral imagery, as the cost of hyperspectral imagery serves is a major barrier to its use, particularly in large-area studies. If multispectral imagery could be used to detect H. annosum, whether through UAS, airborne, or even satellite-based sensors, the prospects for controlling this disease and reducing the economic damage caused by it would be significantly improved.
Acknowledgments
This work was funded by the Research Council of Norway under the project PRECISION (NFR Project No. 281140). We would like to extend our thanks to contractor Valdres Skog AS and the machine operator Karl Henning Espeseth for permitting the use of their harvester and use of the data.
Declaration of openness of research materials, data, and code
Harvester data used in this study are owned by the contractor Valdres Skog AS and therefore not openly available. The remotely sensed data and the statistical code used for this study are available upon request by contacting the corresponding author. Neither the study nor the analysis plan were preregistered.
Authors’ contributions
Benjamin Allen: Served as the primary author of the manuscript and conducted a majority of the analysis.
Michele Dalponte: Created a majority of the code used for analysis, performed a portion of the analysis, and contributed to revisions to the paper.
Ari M. Hietala: Provided knowledge of forest pathology which was crucial for contextualizing our results and writing the background of the paper, wrote and/or edited portions of the background section.
Hans Ole Ørka, Erik Næsset, Terje Gobakken: Contributed to study design, gave advice and assistance regarding analysis procedures, assisted with revisions of manuscript drafts.
References
Asiegbu FO, Adomas A, Stenlid J (2005) Conifer root and butt rot caused by Heterobasidion annosum (Fr.) Bref. s.l. Mol Plant Pathol 6: 395–409. https://doi.org/10.1111/j.1364-3703.2005.00295.x.
Behmann J, Steinrücken J, Plümer L (2014) Detection of early plant stress responses in hyperspectral images. ISPRS J Photogramm 93: 98–111. https://doi.org/10.1016/j.isprsjprs.2014.03.016.
Birth GS, McVey GR (1968) Measuring the color of growing turf with a reflectance spectrophotometer. Agron J 60: 640–643. https://doi.org/10.2134/agronj1968.00021962006000060016x.
Breidenbach J, Næsset E, Lien V, Gobakken T, Solberg S (2010) Prediction of species specific forest inventory attributes using a nonparametric semi-individual tree crown approach based on fused airborne laser scanning and multispectral data. Rem Sens of Env 114: 911–924. https://doi.org/10.1016/j.rse.2009.12.004.
Breiman L (2001) Random forests. Mach Learn 45: 5–32. https://doi.org/10.1023/A:1010933404324.
Ceccatoa P, Flasse S, Tarantola S, Jacquemoud S, Grégoire J-M (2001) Detecting vegetation leaf water content using reflectance in the optical domain. Rem Sens of Env 77: 22–33. https://doi.org/10.1016/S0034-4257(01)00191-2.
Cortes C, Vapnik V (1995) Support-vector networks. Mach Learn 20: 273–297. https://doi.org/10.1007/bf00994018.
Curran PJ, Dungan JL, Macler BA, Plummer SE (1991) The effect of a red leaf pigment on relationship between red edge and chlorophyll concentration. Rem Sens of Env 31: 69–76. https://doi.org/10.1016/0034-4257(91)90066-F.
Datt B (1999) A new reflectance index for remote sensing of chlorophyll content in higher plants: tests using eucalyptus leaves. J Plant Physiol 154: 30–36. https://doi.org/10.1016/S0176-1617(99)80314-9.
Dalponte M (2018) itcSegment: individual tree crowns segmentation. R package version 0.8. https://CRAN.R-project.org/package=itcSegment.
Dalponte M, Bruzzone L, Gianelle D (2008) Fusion of hyperspectral and LiDAR remote sensing data for classification of complex forest areas. IEEE T Geosci Remote 46: 1416–1427. https://doi.org/10.1109/tgrs.2008.916480.
Fensholt R, Huber S, Proud SR, Mbow C (2010) Detecting canopy water status using shortwave infrared reflectance data from polar orbiting and geostationary platforms. IEEE J Sel Top Appl 3: 271–285. https://doi.org/10.1109/jstars.2010.2048744.
Gamon JA, Surfus JS (1999) Assessing leaf pigment content and activity with a reflectometer. New Phytol 143: 105–117. https://doi.org/10.1046/j.1469-8137.1999.00424.x.
Gao B-C (1995) Normalized difference water index for remote sensing of vegetation liquid water from space. Proc SPIE 2480: 225–236. https://doi.org/10.1117/12.210877.
Garbelotto M, Gonthier P (2013) Biology, epidemiology, and control of heterobasidion species worldwide. Annu Rev Phytopathol 51: 39–59. https://doi.org/10.1146/annurev-phyto-082712-102225.
Gonthier P, Lione G, Giordano L, Garbelotto M (2012) The American forest pathogen Heterobasidion irregulare colonizes unexpected habitats after its introduction in Italy. Ecol Appl 22: 2135–2143. https://doi.org/10.1890/12-0420.1.
Hardisky M, Klemas V, Smart R (1983) The influences of soil salinity, growth form, and leaf moisture on the spectral reflectance of Spartina alterniflora canopies. Photogramm Eng Rem S 49: 77–83.
Hietala AM, Nagy NE, Steffenrem A, Fossdal CG, Kvaalen H, Solheim H (2009) Spatial patterns in hyphal growth and wood degradation within Norway spruce stems colonized by the pathogenic white-rot fungus Heterobasidion parviporum. Appl Environ Microb 75: 4069–4078. https://doi.org/10.1128/AEM.02392-08.
Hodges CS (1969) Modes of infection and spread of Fomes annosus. Annu Rev Phytopathol 7: 247–266. https://doi.org/10.1146/annurev.py.07.090169.001335.
Hodges CS (1999) Heterobasidion annosum. Biology, ecology, impact and control. Plant Pathol 48: 564–565. https://doi.org/10.1046/j.1365-3059.1999.0366b.x.
Huse KJ, Solheim H, Venn K (1994) Råte i gran registrert på stubber etter hogst vinteren 1992. [Stump inventory of root and butt rots in Norway spruce cut in 1992]. Norwegian Forest Research Institute, Rapport fra skogforskningen 23/94. http://hdl.handle.net/11250/2560332.
Kankaanhuhta V, Mäkisara K, Tomppo E, Piri T, Kaitera J (2000) Monitoring of diseases caused by Heterobasidion annosum and Peridermium pini in Norway spruce and Scots pine stands by airborne imaging spectrometry (AISA). In: Raitio H, Ukonmaanaho L (eds) Forest condition monitoring in Finland, National report 1999. The Finnish Forest Research Institute Research Papers 782: 113–132. http://urn.fi/URN:ISBN:951-40-1743-9.
Karatzoglou A, Smola A, Hornik K, Zeileis A (2004) kernlab – an S4 package for kernel methods in R. J Stat Softw 11: 1–20. https://doi.org/10.18637/jss.v011.i09.
Kaufman Y, Tanre D (1992) Atmospherically resistant vegetation index (ARVI) for EOS-MODIS. IEEE T Geosci Remote 30: 261–270. https://doi.org/10.1109/36.134076.
Leckie DG, Jay C, Gougeon FA, Sturrock RN, Paradine D (2004) Detection and assessment of trees with Phellinus weirii (laminated root rot) using high resolution multi-spectral imagery. Int J Remote Sens 25: 793–818. https://doi.org/10.1080/0143116031000139926.
Lelong CC, Roger J, Brégand S, Dubertret F, Lanore M, Sitorus N, Caliman J (2010) Evaluation of oil-palm fungal disease infestation with canopy hyperspectral reflectance data. Sensors 10: 734–747. https://doi.org/10.3390/s100100734.
Liaw A, Wiener M (2002) Classification and regression by randomForest. R News 2: 18–22.
Lin C, Wu CC, Tsogt K, Ouyang YC, Chang CI (2015) Effects of atmospheric correction and pansharpening on LULC classification accuracy using WorldView-2 imagery. Inf Process Agric 2: 25–36. https://doi.org/10.1016/j.inpa.2015.01.003.
Lowe A, Harrison N, French AP (2017) Hyperspectral image analysis techniques for the detection and classification of the early onset of plant disease and stress. Plant Methods 13: 80–92. https://doi.org/10.1186/s13007-017-0233-z.
Male EJ, Pickles WL, Silver EA, Hoffmann GD, Lewicki J, Apple M, Burton EA (2010) Using hyperspectral plant signatures for CO2 leak detection during the 2008 ZERT CO2 sequestration field experiment in Bozeman, Montana. Environ Earth Sci 60: 251–261. https://doi.org/10.1007/s12665-009-0372-2.
Meddens AJ, Hicke JA, Vierling LA, Hudak AT (2013) Evaluating methods to detect bark beetle-caused tree mortality using single-date and multi-date Landsat imagery. Remote Sens Environ 132: 49–58. https://doi.org/10.1016/j.rse.2013.01.002.
Nguyen HM, Demir B, Dalponte M (2019) A weighted SVM-based approach to tree species classification at individual tree crown level using LiDAR data. Remote Sensing 11, article id 2948. https://doi.org/10.3390/rs11242948.
Noordermeer L, Gobakken T, Næsset E, Bollandsås OM (2020), Predicting and mapping site index in operational forest inventories using bitemporal airborne laser scanner data. Forest Ecol Manag 457, article id 117768. https://doi.org/10.1016/j.foreco.2019.117768.
Oliva J, Julio Camarero J, Stenlid J (2012) Understanding the role of sapwood loss and reaction zone formation on Radial growth of Norway spruce (Picea abies) trees decayed by Heterobasidion annosum s.l. Forest Ecol Manag 274: 201–209. https://doi.org/10.1016/j.foreco.2012.02.026.
Otto E, Held B, Redford S, Blanchette RA (2021) Detecting Heterobasidion irregulare in Minnesota and assessment of indigenous fungi on pines. Forests 12, article id 57. https://doi.org/10.3390/f12010057.
Peng Y, Zhang M, Xu Z, Yang T, Su Y, Zhou T, Lin Y (2020) Estimation of leaf nutrition status in degraded vegetation based on field survey and hyperspectral data. Sci Rep 10, article id 4361. https://doi.org/10.1038/s41598-020-61294-7.
Penuelas J, Baret F, Filella I (1995) Semi-empirical indices to assess carotenoids/chlorophyll-a ratio from leaf spectral reflectance. Photosynthetica 31: 221–230.
Pitkänen TP, Piri T, Lehtonen A, Peltoniemi M (2021) Detecting structural changes induced by Heterobasidion root rot on Scots pines using terrestrial laser scanning. Forest Ecol Manag 492, article id 119239. https://doi.org/10.1016/j.foreco.2021.119239.
Rahlf J, Breidenbach J, Solberg S, Astrup R (2015) Forest parameter prediction using an image-based point cloud: a comparison of semi-ITC with ABA. Forests 6: 4059–4071. https://doi.org/10.3390/f6114059.
Redfern DB, Filip GM (1991) Inoculum and infection. In: Shaw III CG, Kile GA (eds) Armillaria root disease. Agriculture Handbook no. 691, pp. 48–60. USDA Forest Service, Washington D.C.
Rouse Jr. JW, Haas RH, Schell JA, Deering DW (1973) Monitoring vegetation systems in the great plains with ERTS. Third ERTS symposium, NASA SP-351: 309–317.
Seelig H, Hoehn A, Stodieck LS, Klaus DM, Adams III WW, Emery WJ (2008) The assessment of leaf water content using leaf reflectance ratios in the visible, near‐, and short‐wave‐infrared. Int J Remote Sens 29: 3701–3713. https://doi.org/10.1080/01431160701772500.
Sims DA, Gamon JA (2002) Relationships between leaf pigment content and spectral reflectance across a wide range of species, leaf structures and developmental stages. Remote Sens Environ 81: 337–354. https://doi.org/10.1016/S0034-4257(02)00010-X.
Solheim H (2006) White rot fungi in living Norway spruce trees at high elevation in southern Norway with notes on gross characteristics of the rot. In: Forest pathology research in the Nordic and Baltic countries 2005. Proceedings from the SNS meeting in Forest Pathology at Skogbrukets Kursinstitutt, Biri, Norway, 28–31 August 2005, pp. 5–12. Norwegian Institute for Bioeconomic Research, Ås.
Stone C, Turner R, Verbesselt J (2008) Integrating plantation health surveillance and wood resource inventory systems using remote sensing. Aust For 71: 245–253. https://doi.org/10.1080/00049158.2008.10675043.
Woodward S, Stenlid J, Karjalainen R, Huttermann A (1998) Heterobasidion annosum. Biology, ecology, impact and control. CAB International, Wallingford, UK.
Wu W, Zhang Z, Zheng L, Han C, Wang X, Xu J, Wang X (2020) Research progress on the early monitoring of pine wilt disease using hyperspectral techniques. Sensors 20, article id 3729. https://doi.org/10.3390/s20133729.
Žemaitis P, Žemaitė I (2017) Does butt rot affect the CROWN condition of Norway spruce trees? Trees 32: 489–495. https://doi.org/10.1007/s00468-017-1645-0.
Yu B, Ostland M, Gong P, Pu R (1999) Penalized discriminant analysis of in situ hyperspectral data for conifer species recognition. IEEE T Geosci Remote 37: 2569–2577. https://doi.org/10.1109/36.789651.
Yuan D, Elvidge CD (1996) Comparison of relative radiometric normalization techniques. ISPRS J Photogramm 51: 117–126. https://doi.org/10.1016/0924-2716(96)00018-4.
Zhang Y, Chen JM, Miller JR, Noland TL (2008) Leaf chlorophyll content retrieval from airborne hyperspectral remote sensing imagery. Remote Sens Environ 112: 3234–3247. https://doi.org/10.1016/j.rse.2008.04.005.
Zhao H, Yang C, Guo W, Zhang L, Zhang D (2020) Automatic estimation of crop disease severity levels based on vegetation index normalization. Remote Sens 12, article id 1930. https://doi.org/10.3390/rs12121930.
Total of 52 references.
