Aarne Hovi  ,
Petr Lukeš,
Lucie Homolová,
Jussi Juola,
Miina Rautiainen
,
Petr Lukeš,
Lucie Homolová,
Jussi Juola,
Miina Rautiainen
Small geographical variability observed in Norway spruce needle spectra across Europe
Hovi A., Lukeš P., Homolová L., Juola J., Rautiainen M. (2022). Small geographical variability observed in Norway spruce needle spectra across Europe. Silva Fennica vol. 56 no. 2 article id 10683. https://doi.org/10.14214/sf.10683
Highlights
- Spectra of Norway spruce needles were collected from three sites in Europe (49°–62°N)
- The same acquisition and processing parameters were applied throughout the campaign
- Geographical variability in the needle spectra was small
- Comparison of the spectra of coniferous needles and broadleaved tree foliage is also presented.
Abstract
Foliage spectra form an important input to physically-based forest reflectance models. However, little is known about geographical variability of coniferous needle spectra. In this research note, we present an assessment of the geographical variability of Norway spruce (Picea abies (L.) H. Karst.) needle albedo, reflectance, and transmittance spectra across three study sites covering latitudes of 49–62°N in Europe. All spectra were measured and processed using exactly the same methodology and parameters, which guarantees reliable conclusions about geographical variability. Small geographical variability in Norway spruce needle spectra was observed, when compared to variability observed between previous measurement campaigns (employing slightly varying measurement and processing parameters), or to variability between plant functional types (broadleaved vs. coniferous). Our results suggest that variability of needle spectra is not a major factor introducing geographical variability to forest reflectance. The results also highlight the importance of harmonizing measurement protocols when collecting needle spectral libraries. Furthermore, the data collected for this study can be useful in studies where accurate information on spectral differences between broadleaved and coniferous tree foliage is needed.
Keywords
albedo;
remote sensing;
reflectance;
transmittance;
land surface modeling;
leaf optical properties;
radiative transfer modeling
-
Hovi,
Aalto University, School of Engineering, Department of Built Environment, P.O. Box 14100, FI-00760 Aalto, Finland
 https://orcid.org/0000-0002-4384-5279
E-mail
aarne.hovi@aalto.fi
https://orcid.org/0000-0002-4384-5279
E-mail
aarne.hovi@aalto.fi
-
Lukeš,
Global Change Research Institute of the Czech Academy of Sciences, Bělidla 986/4a, 603 00 Brno, Czech Republic
https://orcid.org/0000-0002-3707-6557
E-mail
lukes.p@czechglobe.cz
-
Homolová,
Global Change Research Institute of the Czech Academy of Sciences, Bělidla 986/4a, 603 00 Brno, Czech Republic
https://orcid.org/0000-0001-7455-2834
E-mail
homolova.l@czechglobe.cz
-
Juola,
Aalto University, School of Engineering, Department of Built Environment, P.O. Box 14100, FI-00760 Aalto, Finland
https://orcid.org/0000-0002-6050-7247
E-mail
jussi.juola@aalto.fi
-
Rautiainen,
Aalto University, School of Engineering, Department of Built Environment, P.O. Box 14100, FI-00760 Aalto, Finland; Aalto University, School of Electrical Engineering, Department of Electronics and Nanoengineering, P.O. Box 15500, FI-00760 Aalto, Finland
https://orcid.org/0000-0002-6568-3258
E-mail
miina.a.rautiainen@aalto.fi
Received 22 December 2021 Accepted 24 March 2022 Published 1 April 2022
Views 34982
Available at https://doi.org/10.14214/sf.10683 | Download PDF

Supplementary Files
1 Introduction
Foliage spectra form an important input to physically-based forest reflectance models used in predicting land surface processes in climate modeling (Majasalmi et al. 2019), and in estimating forest biophysical characteristics from optical remote sensing data (Myneni et al. 2002). Many of these models are applied on a global scale, using foliage spectra for individual biomes and plant functional types as input. While differences in foliage spectra between plant functional types or species have been examined (Knapp and Carter 1998; Lukeš et al. 2013; Hovi et al. 2017), little is known about geographical variability of coniferous needle spectra within or between biomes (Rautiainen et al. 2018). Variability can be caused by local site and weather conditions, supported by the observations that altitude and latitude affect needle reflectance spectra (Richardson et al. 2001, 2003; Dengel et al. 2013), or even by the genetic origin that can influence the anatomy of needles (Radovanović et al. 2014).
Foliage reflectance and transmittance spectra are typically measured using spectrometers coupled with integrating spheres, which provide a standardized observation geometry, and therefore the measurements should be comparable between measurement campaigns. There are, however, uncertainties in measurements of coniferous needles, because the needles are narrow and thus do not completely fill the sample port of an integrating sphere (Daughtry et al. 1989). Uncertainties can arise from, e.g., inaccurate correction for the effect of the gaps between needles (Mesarch et al. 1999; Yáñez-Rausell et al. 2014), multiple scattering of photons between needles (Yáñez-Rausell et al. 2014; Wang et al. 2020), or attenuation of the reflected or transmitted radiation due to the thickness of the sample holder and the thickness of the sample itself (Hovi et al. 2020; Wang et al. 2020). The above uncertainties can result in systematic differences of needle spectra obtained with different measurement and processing parameters. Given the lack of comparable measurements, it has been difficult to draw conclusions about geographical variability of coniferous needle spectra.
We present an assessment of the geographical variability of Norway spruce (Picea abies (L.) H. Karst.) needle spectra across three study sites covering latitudes of 49–62° N in Europe. Importantly, all spectra were measured and processed using exactly the same methodology and parameters, which guarantees reliable conclusions about geographical variability. The results are compared with the variability observed between previous measurement campaigns, which utilized similar methodology, but the measurement and processing parameters varied. The fundamental scientific question to be answered is: How variable are the needle spectra across geographical locations? We also demonstrate spectral differences between coniferous needles and broadleaved tree foliage, which further emphasizes the small geographical variability of Norway spruce needle spectra.
2 Material and methods
2.1 New measurements of foliage spectra
We sampled needles of Norway spruce (Picea abies (L.) H. Karst.) from Hyytiälä, Finland (61°51´N, 24°18´E), Järvselja, Estonia (58°17´N, 27°19´E), and Bílý Kříž, in the Czech Republic (49°30´N, 18°32´E) (Hovi et al. 2022). The campaign was conducted in July–September in 2019–2020 and is hereafter referred to as ‘HY-JS-BK 2019–20’. The forests at the study sites are boreal conifer-dominated with minor broadleaved mixture (Hyytiälä), hemi-boreal mixed forests (Järvselja), and temperate coniferous mountain forests (Bílý Kříž). All sites belong to the natural range of Norway spruce but have been subject to human management. Thus, the exact genetic origin of the study trees is unknown. At each site, we selected three representative trees of different sizes (Table 1), to cover natural variation in the sites. From each tree we collected three samples of current-year (c0) and one-year-old (c1) needles from both top (predominantly sun-exposed foliage) and bottom of canopy (predominantly shaded foliage). The sample branches were stored in cool and dark (refrigerator, storage time max. 12 hours), kept well-watered, and foliage was detached from the branch immediately before measurement. In addition, we sampled Scots pine (Pinus sylvestris L.), silver birch (Betula pendula Roth), black alder (Alnus glutinosa (L.) Gaertn.), and European aspen (Populus tremula L.) from the Hyytiälä and Järvselja sites (Table 1).
| Table 1. Summary of leaf and needle samples collected for this study (HY-JS-BK 2019–20 campaign). The site codes refer to Hyytiälä (HY), Järvselja (JS), and Bílý Kříž (BK). Scientific names of the species (reported in the main text) follow the nomenclature in https://www.tropicos.org. | |||||
| Species | Sites | Number of trees per site | Tree heights at each site [m] | Number of samples per tree | Total number of samples |
| Norway spruce | HY, JS, BK | 3 | 19–25, 7–14, 7–35 | 12 | 108 |
| Scots pine | HY, JS | 3 | 14–17, 8–24 | 12 | 72 |
| Silver birch | HY, JS | 3 | 16–20, 6–13 | 61 | 36 |
| Black alder | JS | 3 | 5–12 | 61 | 18 |
| European aspen | JS | 3 | 5–13 | 61 | 18 |
| 1 Deciduous broadleaved trees had only one leaf age cohort. Therefore, the number of samples per tree is half of that measured for conifers. | |||||
Foliage spectra were measured with an integrating sphere (ASD RTS-3ZC, ser. nr. 12152804), attached to a spectrometer (one of two identical ASD FieldSpec4 instruments, ser. nr. 18456 or 18641). The spectral range was 350–2500 nm and spectral resolution 3 nm (≤1000 nm) or 10 nm (>1000 nm), and the data were interpolated and output by the instrument at 1 nm interval. Both needles and leaves were attached to needle carriers. For details of the measurement setup and protocol, see Hovi et al. (2020) and illustrations therein: particularly Fig. 1 (photograph of a needle carrier and a needle sample) and Supplementary file S1 (Table S1.2 and Fig. S1.1, measurement protocol and diagram of the measurement setup) of Hovi et al. (2020). Needles were placed in the carrier at spacing of 0.5–1× needle width. We performed reflectance and transmittance measurements of both sides of the sample, and white reference measurements for both reflectance and transmittance. Reflectance measurements included a measurement of stray light (caused by imperfect collimation of the light source) using a photon trap. The raw data were processed into reflectance and transmittance according to commonly used processing formulas (Supplementary file S1: Table S1.1) that correct the measurements for the effect of gap fractions in the needle sample and normalize them to the white reference.
Gap fractions were obtained by scanning the needle samples in a digital film scanner (Epson Perfection V550, gray-level images at 800 dpi resolution), and by applying a gray level threshold (200 for pine, 229 for spruce) to the area of the sample that was illuminated by the light source. Optimal gray level thresholds were obtained by matching the gap fractions obtained from the scanned images to reference gap fractions in a subset of needle samples (12 samples for each coniferous species). The reference gap fraction was obtained as the transmittance of a needle sample, which was painted in black, to ensure that the signal at blue wavelength (bands at 410–420 nm) was solely due to transmission through the gaps between needles (Daughtry et al. 1989). Blue wavelength was used because the transmittance of needles at that wavelength is low. The painting further reduces specular reflections from the needle surface that could contribute to the transmittance measurement. The sensitivity of results to the threshold are reported in Suppl. file S1 (Fig. S1.1). Finally, we applied an empirical transmittance correction that decreased the transmittance spectra at all wavelengths by 5.5% in relative terms. This corrected for a transmittance bias that was observed when comparing the ASD sphere against a trusted reference method (Hovi et al. 2020).
2.2 Needle spectra from previous measurement campaigns
We compared our data (HY-JS-BK 2019–20) with needle spectra of Norway spruce measured in previous campaigns in Finland (Hyytiälä 2012, Helsinki 2016) and the Czech Republic (Šumava 2009, Bílý Kříž 2016, GEOMON 2017). The campaigns are named according to site and year, except the GEOMON 2017 that includes measurements from several sites in the Czech Republic. The phenological timing of measurements (made in June–September) was similar to our campaign, and the measurements were made using ASD RTS-3ZC integrating sphere attached to a spectrometer (ASD FieldSpec3 or FieldSpec4). Detailed information on all campaigns used in this study is provided in Suppl. file S1 (Tables S1.2 and S1.3). To make the data comparable to ours, we used only c0 and c1 needles in our analysis. The Šumava 2009 campaign did not include measurements of c1 needles, so we used two years old needles from that campaign instead.
2.3 Data analyses
We focus on albedo (reflectance + transmittance) averaged over both sides of the samples, as it represents the average scattering behavior of the foliage in the canopy. For comparison, results for reflectance and transmittance are presented in Suppl. file S1. The results are shown for top-of-canopy needles because those were sampled in all measurement campaigns and should be best comparable (least variation in local illumination conditions). The main conclusions did not change when analyzing all needle categories and leaving out the GEOMON 2017 campaign (which had no bottom-of-canopy needles measured). The range of wavelengths was limited to 400–1600 nm when comparing data between campaigns, as data for these wavelengths were readily available from all campaigns. For the analysis of geographical variability (HY-JS-BK 2019–20 campaign), wavelengths of 400–2500 nm were used.
The variability in the spectra were quantified using within- and between-site (or within- and between-campaign) coefficients of variation (CVwithin, CVbetween) that measure the variance (as percent of mean) among individual samples within a site (campaign) or among mean spectra of individual sites (campaigns). We also calculated site and campaign-specific relative standard errors of mean (RSE), which measure the sampling uncertainty in mean spectra for individual sites (campaigns). Formulas for CVwithin, CVbetween, and RSE are given in Suppl. file S1 (Table S1.4). We analyzed all wavelengths in the data, but to summarize the information, we show numerical results for representative wavelengths typically used in remote sensing: blue (490 nm), green (560 nm), red (665 nm), and near-infrared (NIR, 865 nm). These correspond to the center wavelengths of Sentinel-2 MSI spectral bands.
3 Results
3.1 Variability of spruce needle spectra within- and between measurement campaigns
The comparison of older measurement campaigns and the new HY-JS-BK 2019–20 campaign showed that the c0 needles had higher albedo compared to c1 needles, especially in the red and NIR (Fig. 1, Suppl. file S1: Table S1.5). Between-campaign variability (CVbetween) fell in the same range as within-campaign variability (CVwithin) or was slightly smaller than within-campaign variability (Fig. 1, Suppl. file S1: Table S1.5). The results for needle reflectance and transmittance were similar to those for albedo, except that transmittance showed notably larger within- and between-campaign variability compared to reflectance, especially in the blue and red wavelengths (Suppl. file S1: Figs. S1.2 and S1.3, Table S1.5).
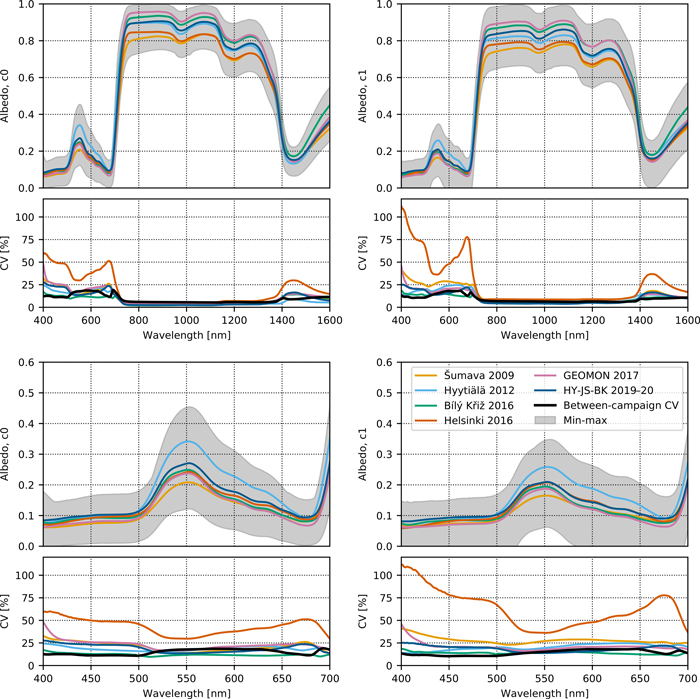
Fig. 1. Variation in albedo spectra of Norway spruce top-of-canopy needles within and between measurement campaigns. CV denotes coefficient of variation. The colored lines show campaign-specific spectra, the thick black line shows between-campaign CV, and the gray area shows min-max of individual spectra among all campaigns. Top row shows full spectra, and bottom row close-ups of the visible wavelength region. The results are shown separately for current-year (c0, left column) and one-year-old (c1, right column) needles.
3.2 Geographical variability of spruce needle spectra
The results from the new HY-JS-BK 2019–20 campaign showed that the mean Norway spruce needle albedo spectra were similar for all three study sites (Fig. 2, Suppl. file S1: Table S1.6). Between-site variability (CVbetween) was smaller or close to the lower limit of within-site variability (CVwithin) (Fig. 2, Suppl. file S1: Table S1.6), and also smaller than between-campaign variability reported in Fig. 1 and Suppl. file S1 (Table S1.5). The results for reflectance and transmittance were similar to those reported for albedo (Suppl. file S1: Figs. S1.4 and S1.5, Table S1.6). For the transmittance at blue and red wavelengths, between-site variability was particularly small compared to between-campaign variability.
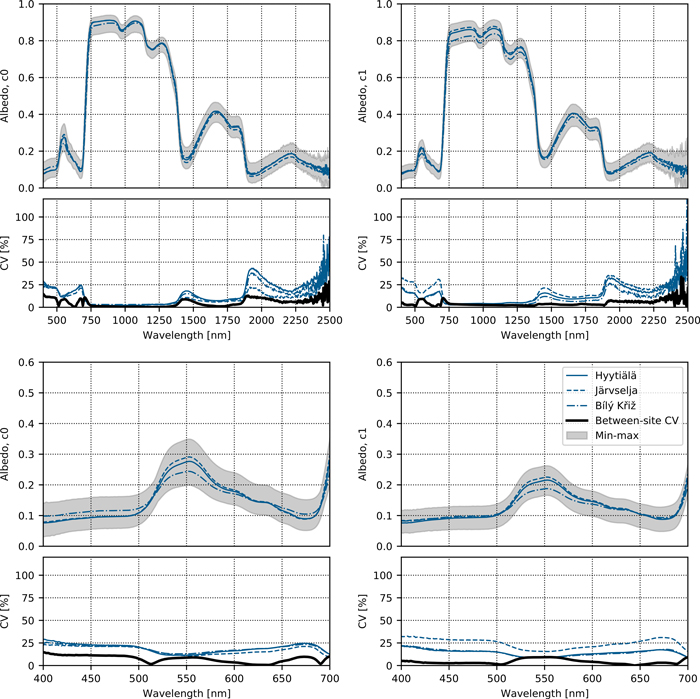
Fig. 2. Variation in albedo spectra of Norway spruce top-of-canopy needles within and between study sites observed in the new HY-JS-BK 2019–20 campaign. CV denotes coefficient of variation. The colored lines show site-specific spectra, the thick black line shows between-site CV, and the gray area shows min-max of individual spectra among all sites. Top row shows full spectra, and bottom row close-ups of the visible wavelength region. The results are shown separately for current-year (c0, left column) and one-year-old (c1, right column) needles.
3.3 Differences between coniferous and broadleaved tree species
Finally, we compared the spectra of Norway spruce needles to those of pine, birch, alder, and aspen (Fig. 3, Suppl. file S1: Figs. S1.6 and S1.7). Species other than Norway spruce were not sampled at all study sites, and therefore these results are illustrative. Nevertheless, the differences between broadleaved and coniferous tree species, or between needle age classes, were greater than between-site differences in Norway spruce needle spectra.
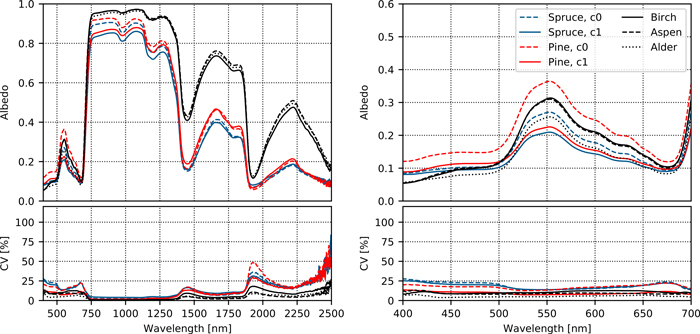
Fig. 3. Variation in albedo spectra of top-of-canopy foliage within- and between tree species. CV denotes coefficient of variation. The right column shows a close-up of the visible wavelength region. The symbol c0 denotes current-year, and c1 one-year-old needles.
4 Discussion
Between-site variability in our measurements of needle spectra was small compared to the variability between measurement campaigns. This indicates that if the measurement methodology is consistent and systematic effects are eliminated (as was done in our new campaign), no large geographical differences are observed. We note that the site-specific relative standard errors of mean were of similar magnitude than the between-site differences (Suppl. file S1: Table S1.6). This indicates that the small between-site differences are not a coincidence, i.e., they are not likely to increase considerably if another set of samples is measured. A similar small effect of the site on Norway spruce needle spectra was observed also by Lhotáková et al. (2021). Based on data from sites located on different soil types in the Czech Republic, they found that needle age explained more of the needle spectral variability than did the site conditions.
Given that the previous campaigns were conducted in the same geographical region and under similar phenological conditions as our new campaign, the systematic differences between the measurement campaigns are likely due to differences in measurement or data processing parameters. Accurate quantification of the effect of these parameters is not possible based on the available data. Nor can we say which campaigns provided needle spectra closest to the absolute ‘truth’. However, we highlight here some factors that may contribute to the differences. The determination of and correction for gap fraction between needles is important (Daughtry et al. 1989; Mesarch et al. 1999; Yáñez-Rausell et al. 2014), and inconsistencies in, e.g., the selection of gray-level threshold (Suppl. file S1: Fig. S1.1) can easily lead to systematic differences between campaigns. The relative contribution of gap fraction to the measured signal is the greatest for transmittance measurements in wavelength regions where the needle transmittance is low (Mesarch et al. 1999). We observed the largest between-campaign variation in transmittance in the red and blue wavelengths. Even negative (physically non-meaningful) transmittance was observed for individual samples in some of the campaigns, which indicates that also random errors (e.g., due to geometric inaccuracies in placement of the lamp or the sample in the integrating sphere) were present. The needle carrier can also affect the measurements (Yáñez-Rausell et al. 2014; Hovi et al. 2020; Wang et al. 2020), and it is possible that carriers of different thicknesses produce different results. Placement of the needles in the needle carrier also varied between campaigns: the needles could be in one row (i.e., light beam illuminating the needles at their center) or in two rows (i.e., light beam illuminating the needles close to their tip) (Suppl. S1: Table S1.3). This can introduce uncertainties, as there can be differences in needle thickness and shape at the center vs. at the tip of a needle. Additionally, the thickness and complex shape of needles can result in multiple scattering, which can be enhanced by placement of needles very close to each other and can introduce errors of up to 12% to needle transmittance (Yáñez-Rausell et al. 2014). Finally, we note that even though the geographical differences were small compared to the between-campaign differences, method development (increasing the measurement precision) or an increase of sample size could help in detecting even smaller differences than what was possible here.
Overall, our results have the following implications:
1) When acquiring coniferous needle spectral libraries for use in physically-based remote sensing or land surface models, it is important to pay attention to harmonizing the measurement protocols. Even small differences in the measurement or processing parameters can introduce systematic differences to the needle spectra. Furthermore, as needle age and position in the canopy affect the needle spectra (Rautiainen et al. 2018; Lhotáková et al. 2021), sampling this within-stand variability might be more important than trying to maximize the geographical coverage of the measurements.
2) More generally, geographical variability of relations between forest biophysical characteristics and reflectance spectra complicates the transfer between geographical regions and thus re-use of any (physically-based or statistical) interpretation models for remote sensing data. Our results suggest that variability of needle spectra is not a major factor introducing geographical variability to forest reflectance. Other factors, such as canopy structure or characteristics of the understory (Eriksson et al. 2006), may have a larger role.
3) Finally, we also performed measurements of broadleaved foliage spectra with exactly the same methodology as we used for conifers (including the use of needle carriers). These data can be useful in future studies where accurate information on spectral differences between these two plant functional types is needed.
Declaration of openness of research materials, data, and code
The data used in this study are available as three datasets in Mendeley data: the HY-JS-BK 2019–20 campaign (https://doi.org/10.17632/t5f554s7cn.1), Helsinki 2016 campaign (https://doi.org/10.17632/nvgjcn5nsx.1), and the other measurement campaigns (https://doi.org/10.17632/vycrxc4vpz.1). The code used in this study is available from the corresponding author (aarne.hovi@aalto.fi) upon request.
Authors’ contributions
AH conceived the research idea, planned and performed data collection in the HY-JS-BK 2019–20 measurement campaign, conducted the analyses, and wrote the initial draft of the manuscript. PL developed the research idea together with AH and MR, collected data in the HY-JS-BK 2019–20 campaign, and provided data from previous measurement campaigns. LH collected data in the HY-JS-BK 2019–20 campaign and provided data from previous measurement campaigns. JJ collected data in the HY-JS-BK 2019–20 campaign. MR conceived the research idea, as well as acquired funding for and planned the HY-JS-BK 2019–20 measurement campaign. All authors participated in writing and commenting the manuscript.
Acknowledgements
We thank Mihkel Kaha, Bijay Karki, Mait Lang, Zuzana Lhotáková, Titta Majasalmi, Jiří Matucha, Jan Pisek, Ville Ranta, Daniel Schraik, and the staff of Hyytiälä forestry field station for assistance in the field campaigns.
Funding
This study has received funding from the European Research Council (ERC) under the European Union’s Horizon 2020 research and innovation programme (grant agreement No 771049). The text reflects only the authors’ view and the Agency is not responsible for any use that may be made of the information it contains. This study was also funded by the Academy of Finland grant DIMEBO (323004), and by the Ministry of Education, Youth and Sports of CR within the CzeCOS program, grant number LM2018123.
References
Daughtry CST, Ranson KJ, Biehl LL (1989) A new technique to measure the spectral properties of conifer needles. Remote Sens Environ 27: 81–91. https://doi.org/10.1016/0034-4257(89)90039-4.
Dengel S, Grace J, Aakala T, Hari P, Newberry SL, Mizunuma T (2003). Spectral characteristics of pine needles at the limit of tree growth in subarctic Finland. Plant Ecol Divers 6: 31–44. https://doi.org/10.1080/17550874.2012.754512.
Eriksson HM, Eklundh L, Kuusk A, Nilson T (2006) Impact of understory vegetation on forest canopy reflectance and remotely sensed LAI estimates. Remote Sens Environ 103: 408–418. https://doi.org/10.1016/j.rse.2006.04.005.
Hovi A, Raitio P, Rautiainen M (2017) A spectral analysis of 25 boreal tree species. Silva Fenn 51, article id 7753. https://doi.org/10.14214/sf.7753.
Hovi A, Mõttus M, Juola J, Manoocheri F, Ikonen E, Rautiainen M (2020) Evaluating the performance of a double integrating sphere in measurement of reflectance, transmittance, and albedo of coniferous needles. Silva Fenn 54, article id 10270. https://doi.org/10.14214/sf.10270.
Hovi A, Schraik D, Hanuš J, Homolová L, Juola J, Lang M, Lukeš P, Pisek J, Rautiainen M (2022) Assessment of a photon recollision probability based forest reflectance model in European boreal and temperate forests. Remote Sens Environ 269, article id 112804. https://doi.org/10.1016/j.rse.2021.112804.
Knapp AK, Carter GA (1998) Variability in leaf optical properties among 26 species from a broad range of habitats. Am J Bot 85: 940–946. https://doi.org/10.2307/2446360.
Lhotáková Z, Kopačková-Strnadová V, Oulehle F, Homolová L, Neuwirthová E, Švik M, Janoutová R, Albrechtová J (2021) Foliage biophysical trait prediction from laboratory spectra in Norway spruce is more affected by needle age than by site soil conditions. Remote Sens 13, article id 391. https://doi.org/10.3390/rs13030391.
Lukeš P, Stenberg P, Rautiainen M, Mõttus M, Vanhatalo KM (2013) Optical properties of leaves and needles for boreal tree species in Europe. Rem Sens Lett 4: 667–676. https://doi.org/10.1080/2150704X.2013.782112.
Majasalmi T, Bright RM (2019) Evaluation of leaf-level optical properties employed in land surface models. Geosci Model Dev 12: 3923–3938. https://doi.org/10.5194/gmd-12-3923-2019.
Mesarch MA, Walter-Shea E, Asner GP, Middleton E, Chan S (1999). A revised measurement methodology for conifer needles spectral optical properties: evaluating the influence of gap between elements. Remote Sens Environ 68: 177–192. https://doi.org/10.1016/S0034-4257(98)00124-2.
Myneni RB, Hoffman S, Knyazikhin Y, Privette JL, Glassy J, Tian Y, Wang Y, Song X, Zhang Y, Smith GR, Lotsch A, Friedl M, Morisette JT, Votava P, Nemani RR, Running SW (2002) Global products of vegetation leaf area and fraction absorbed PAR from year one of MODIS data. Remote Sens Environ 83: 214–231. https://doi.org/10.1016/S0034-4257(02)00074-3.
Radovanović B, Šinžar-Sekulić J, Rakić T, Živković I, Lakušić D (2014) Variation in needle anatomy of Picea omorika (Pinaceae) plants belonging to different gene pools in natural populations on Tara Mt. in Serbia. Bot Serb 38: 237–246.
Rautiainen M, Lukeš P, Homolová L, Hovi A, Pisek J, Mõttus M (2018) Spectral properties of coniferous forests: a review of laboratory and in situ measurements. Remote Sens 10, article id 207. https://doi.org/10.3390/rs10020207.
Richardson AD, Berlyn GP, Gregoire TG (2001) Spectral reflectance of Picea rubens (Pinaceae) and Abies balsamea (Pinaceae) needles along an elevational gradient, Mt. Moosilauke, New Hampshire, USA. Am J Bot 88: 667–676. https://doi.org/10.2307/2657067.
Richardson AD, Berlyn, GP, Duigan SP (2003) Reflectance of Alaskan black spruce and white spruce foliage in relation to elevation and latitude. Tree Physiol 22: 537–544. https://doi.org/10.1093/treephys/23.8.537.
Wang J, Chen JM, Feng L, Xu J, Zhang F (2020) Redefining the directional-hemispherical reflectance and transmittance of needle-shaped leaves to address issues in their existing measurement methods. Photogramm Eng Rem S 86: 627–641. https://doi.org/10.14358/PERS.86.10.627.
Yáñez-Rausell L, Malenovský Z, Clever JGPW, Schaepman ME (2014) Minimizing measurement uncertainties of coniferous needle-leaf optical properties. Part II: experimental setup and error analysis. IEEE J Sel Top Appl 7: 406–420. https://doi.org/10.1109/JSTARS.2013.2292817.
Total of 18 references.
