Tiina Laine  ,
Veli-Matti Saarinen
,
Veli-Matti Saarinen
Comparative study of the Risutec Automatic Plant Container (APC) and Bracke planting devices
Laine T., Saarinen V.-M. (2014). Comparative study of the Risutec Automatic Plant Container (APC) and Bracke planting devices. Silva Fennica vol. 48 no. 3 article id 1161. https://doi.org/10.14214/sf.1161
Highlights
- As currently designed, the prototype Risutec APC fitted with an automatic feeding system offers no significant advantage over the Bracke planting device in terms of planting productivity or quality
- Cost estimates suggest that an idealized automated feeding system could increase productivity and decrease unit costs.
Abstract
The productivity of mechanized planting could be increased by minimizing the time spent manually reloading seedling cassettes. This study compared the work-time distribution, productivity and quality of the prototype Risutec APC fitted with an automatic feeding system and the commonly-used and manually-loaded Bracke P11.a. An approach of comparative time study was employed that compared performance of two operators using both machines in four sites where slash and stumps had been removed. Operating costs were estimated and compared for these two machines and an idealized machine with automatic feeding system (referred as AUT). AUT was assumed to be similar to the Bracke planting machine with the only difference being in automatic feeding. Productivity of the Risutec APC (196 seedlings per productive work hour [pl PWh0–1]) was lower than that of Bracke (244 pl PWh0–1), making the unit cost 35.7% higher. A large portion (17.6%) of the productive work time of Risutec APC was interrupted by malfunctions, so it cannot be considered robust and reliable yet. Quality of the planting work was reasonable for both machines. The results suggest that an idealized AUT could increase planting capacity (hectares per year [ha yr–1]) by 15.4% and lower the unit cost (Euro per seedling [€ pl–1]) by 4.7% compared to today’s machines. The importance of an automated feeding system increases with planting efficiency because relatively more time is spent reloading seedlings. Proper automatic feeding system could offer a cost-effective solution and could enhance productivity, but the Risutec APC has yet to meet the technical and economic standards required to be competitive.
Keywords
productivity;
regeneration;
cost-efficiency;
planting cost;
mechanized tree planting
-
Laine,
Finnish Forest Research Institute (METLA), Suonenjoki Unit, Juntintie 154, FI-77600 Suonenjoki, Finland
E-mail
tiina.laine@metla.fi
- Saarinen, Finnish Forest Research Institute (METLA), Suonenjoki Unit, Juntintie 154, FI-77600 Suonenjoki, Finland E-mail veli-matti.saarinen@metla.fi
Received 17 April 2014 Accepted 29 August 2014 Published 10 October 2014
Views 131681
Available at https://doi.org/10.14214/sf.1161 | Download PDF

Supplementary Files
1 Introduction
First highly automated and continuously advancing machines conducting only planting work were developed at 1980s and 1990s. To low investment costs, modern planting devices are typically mounted on the boom of a base machine, usually an excavator (Kaila 1984; Hallonborg et al. 1995; Hallonborg et al. 1997; Rantala et al. 2009). There are three planting devices available commercially in Finland: the most common is the Swedish Bracke P11.a., two others are Finnish Risutec and M-Planter, of which M-Planter has two planting units instead of one (Rantala et al. 2009; Ersson 2010; Laine and Rantala 2013). Although 30–35 machines account for less than 5% of seedlings planted in Finland, the dependency on mechanized planting is expected to increase in the future. The main factors encouraging mechanization are a dwindling supply of forest workers and self-directed forest owners and increasing economic pressure to minimize costs and maximize the profits (Karppinen et al. 2002; Rantala et al. 2009; Strandström et al. 2009; Juntunen 2013).
All modern planting machines carry out both soil preparation and planting. An amount of soil, containing both humus and mineral soil layers, is inverted onto adjacent undisturbed soil to form a spot mound prior to planting seedlings into the mounds. Finally the soil is firmed around the seedling by the soil packing shoe(s). Seedling cassettes (or carousels) are manually refilled by the operator from a seedling storage rack attached to the excavator (Rantala et al. 2009). The vast majority of seedlings planted by machines are container-grown Norway spruce (Picea abies (L.) Karst.) and, to a much lesser extent, Scots pine (Pinus sylvestris L.) (Vartiamäki 2003).
In comparison to manual techniques, crane-mounted planting machines are not yet economically competitive (Hallongren et al. 2014), in part due to the lack of an automatic feeding of the seedlings. The planting machine is idle during reloading, and Rantala et al. (2009) reported that 15% (3.10 seconds per seedling [s pl–1]) and 14% (2.26 s pl–1) of the productive work time was spent refilling the seedling cassettes of the Bracke and M-Planter, respectively. Rantala and Laine (2010) observed that 12.5% of the total work time was spent reloading the M-Planter seedling cassette (3.48 s pl–1). In order to be efficient, an automatic feeding system would also require integration with seedling production, packing and transport. In their evaluation of the Bracke, Ersson et al. (2011) assumed average reloading rates of 3.10 and 3.88 s pl–1 from cultivation trays and cardboard boxes, respectively, and concluded that machine-specific seedling packaging would increase cost-efficiency relative to cultivation trays primarily when the fixed costs, productivity and number of contracted planting machines increase substantially from current levels.
For planting machines to be commercially viable, they must have moderately high productivity, low operating costs, be robust and easily serviced, and be sufficiently employed to realize their annual capacity (Mäkinen 1997; Harstela 2004; Rantala et al. 2009; Strandström et al. 2009; Rantala and Laine 2010; Ersson et al. 2011; Hallongren et al. 2014). In order to compete with manual methods, mechanized planting must be at least as cost-effective and plant to at least the same quality standard (Harstela 2004). At current operating costs, planting machines must plant at least 190 seedlings per productive hour (pl PWh15–1; including delays < 15 min) to compete with manual techniques (Hallongren et al. 2014). Productivity of the Bracke P11.a varies from approximately 150 to 250 pl PWh15–1 depending on the work site and machine operator. As productivity increases, relatively more of the productive work time is spent reloading the seedling cassette (Hallonborg et al. 1997; Drake-Brockman 1998; Rummukainen et al. 2002; Saarinen 2004; Rantala et al. 2009). In such high-productivity situations, an efficient automated feeding system could offer significant savings and make mechanized planting more competitive with respect to manual techniques.
In Sweden, Ersson et al. (2014) studied MagMat, a prototype of an automatic feeding system designed for the Bracke planting device. MagMat holds 320 seedlings in eight Hiko v93 cultivation trays. The device is not yet in commercial production, but estimates and an analysis of work time have suggested the MagMat can return cost savings (Ersson et al., 2014). However, results indicate that cost-efficiency is highly dependent on additional investment, operational costs and mechanical availability of the machine.
The aim of the study was to compare the work-time distribution and productivity and quality of the Risutec APC and Bracke P11.a. planting devices that employ automatic and manual refilling systems, respectively. Operating costs were estimated and compared within these two machines as well as with an idealized machine with automatic feeding system (referred as AUT) under a variety of economic scenarios to determine the point at which an AUT would become cost-effective.
2 Materials and methods
2.1 Planting machines
2.1.1 Bracke
The Bracke P11.a planting device (earlier knows as the Öje-planter) is one of the first planting devices on the market and has been widely used in Fennoscandia for the past 20 years (von Hofsten and Petersson 1991; Hallonborg et al 1997). Although those in use today typically contain a maximum of 72 seedlings, the device used in this study was one of the first ones with the original capacity of 90 seedlings. The seedling storage rack attached to the base machine had a capacity of 2080 seedlings; 13 plastic trays each containing 160 seedlings. The cultivation trays are reusable with dimensions of (L×W×H) 4000×6000×1000 mm. Seedlings are manually refilled from cultivation trays to plastic trays at nursery. The Bracke was mounted on the 7.1 m boom of a 14-ton Hyundai R140LC-9 excavator. Seedlings were manually refilled into the seedling cassette by the machine operator as required. The video of Bracke in operation is available as a supplementary file.
2.1.2 Risutec
Risutec APC (Automatic Plant Container) was designed and built by Risutec Ltd. and UPM Forest and it is based on Risutec TK200 planting device (Fig. 1). The Risutec APC is a prototype and has been briefly tested in forest terrain. It was attached to the 7.7 m boom of an 18-ton Hyundai R180LC-7 excavator. Planting device weighs approximately 1800 kg and its dimensions are (L×W×H) 2311×2435×2359 mm (plant container alone 1380×2435×1394 mm).
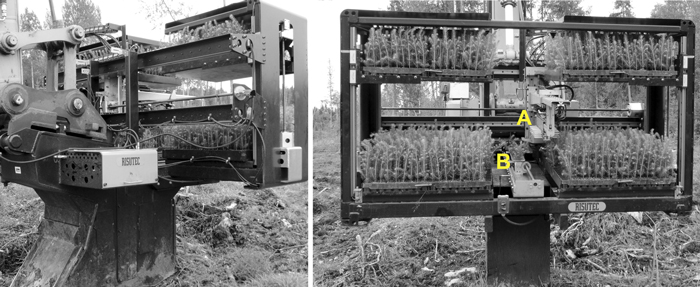
Fig. 1. Risutec APC planting device. Loader (A) selects one row of nine seedlings from cultivation trays and loads them into the feeder (B) from which they are planted one at the time. Photos: Tiina Laine.
Seedlings are tray-wise reloaded, relieving the operator of the need to manually reload the seedlings one at the time. The cultivation trays (BCC Plantek 81) each contain 81 (9×9) seedlings and measure (L×W×H) 385×385×73 mm. While loading seedling storage rack, seedlings at each cell must be manually deplugged from cultivation trays by push rods to loosen root plugs from rigid cultivation trays. The planting device holds up to 16 cultivation trays on two levels corresponding to a total of 1296 seedlings. After planting seedlings from the lowermost level, the upper layer descends to continue work. The Risutec APC has a separate seedling storage rack containing 12 trays (972 seedlings) located at the planting site, for additional seedling requirement.
The loader, located in the middle of the Risutec APC device, selects one row of nine seedlings from the cultivation tray at the time, from left and right side by turns. After selection, the nine seedlings are loaded into the feeder while the whole machine remains stationary. Seedlings are planted one at the time, and after the seventh seedling is planted, the loader starts to select another nine seedlings from the cultivation tray. After the ninth seedling is planted, the feeder returns to resupply with seedlings while mounds can be formed. The planting cycle is repeated until all cultivation trays are emptied or the work is complete. The video of Risutec APC in operation is available as a supplementary file.
2.2 Study design
An approach of comparative time study was employed that compares the work time spent by the same workers applying alternative work methods or machines to determine differences in their performance (Harstela 1991). The data were collected in northern Ostrobothnia in July 2013 in two clear-cut areas where stumps and slash debris had been removed. The seedlings were containerized 1.5-year-old Norway spruce (Picea abies). Two research areas were divided into two and in all four sites both machines were used by both operators (here designated operator 1 and operator 2). The order and combination of operator and machine was chosen randomly for each site. The clear-cut work sites represent the typical mineral soil low-relief terrain of central and southern Finland. All work study data were videotaped and a supplementary video file of planting machines in operation was made on basis of the collected video data. Work difficulty factors and quality of planting were measured immediately after the work was complete by the same researcher.
Both operators had several years of experience with mechanized planting, although operator 1 was more familiar with Risutec APC and operator 2 with the Bracke. Operators had one work day to familiarize themselves with unfamiliar devices. An observation unit (i.e., replicate) for the Risutec APC was two cultivation trays (162 seedlings) with the exception of operator 2 on planting area 4 (153 seedlings). An observation unit for the Bracke was two seedling cassettes (178 seedlings) with the exception of operator 1 on planting area 3 (162 seedlings). The time spent reloading seedling cassettes was included in the productive work time of the Bracke. The time used loading the seedling storage rack was also videotaped and both operators loaded both machines twice. The data comprise a total of 14.3 hours taken to plant 2695 seedlings.
Work-difficulty factors and the quality of the planting work were measured from three sample plots located systematically in the middle of the excavator tracks after planting was complete. An intermediate plot was located 20–50 m from the start point of the excavator movement so that at the first planting area the distance was the smallest. Two other plots were located 15 m away from the intermediate plot in opposite directions, i.e., 30 m apart. Work-difficulty factors were measured from all three plots, but only the intermediate plot was used to evaluate planting quality. Each sample plot was 50 m2 (r = 3.99 m).
Work difficulty factors were measured in terms of slash, the number of surface obstacles and stumps, stoniness, and thickness of the humus layer (Table 1). Slash is represented as the percentage of five observation points with slash cover at least 20 cm deep. The number of surface obstacles at least 10 cm above ground level including excavations at least 20 cm deep, and stumps with a diameter of at least 10 cm were recorded and are presented in terms of their density (number per ha) following Berg (1986). Surface obstacles and stumps less than half a meter from each other were treated as one. Stoniness is presented as the percentage of nine observation points in which a stone was found 0–20 cm under the soil surface. Thickness of the humus layer was measured from the mounds closest to the cardinal points and center of each plot and is presented as the percentage of mounds with humus layer at least 10 cm deep. The average density of both stumps and surface obstacles was 308.3 per ha. Stoniness was on average 32.4% and share of slash cover was 3.8%. Finally, the share of humus layer at least 10 cm thick was 25.8%.
| Table 1. Pooled work-difficulty conditions for the four planting sites. | |||||
| Work difficulty factor | N | Mean | Min. | Max. | SD |
| Slash (% of points) | 240 | 3.8 | 0.0 | 20.0 | 5.9 |
| Surface obstacles (obstacles ha–1) | 48 | 308.3 | 66.7 | 600.0 | 151.8 |
| Stumps (stumps ha–1) | 48 | 308.3 | 0.0 | 733.3 | 216.2 |
| Stoniness (% of points) | 432 | 32.4 | 11.1 | 70.4 | 15.6 |
| Humus layer > 10 cm (% of points) | 240 | 25.8 | 0.0 | 66.7 | 21.8 |
Quality of planting was evaluated in terms of planting defects and seedling density. At least 10 seedlings per plot were evaluated and if there were fewer than that, the area was expanded until 10 seedlings were evaluated. The amount of mineral soil on top of the mound surface was estimated as well as the extent to which stones, slash, or stagnant water affected the quality of the mound. Planting defects included insufficient compaction of the soil around the seedling, inappropriate planting depth, physical damage, seedling orientation, seedling location in the mound, and the number of empty mounds and multiple (i.e., 2 or more seedlings) plantings. Soil texture was evaluated at the surface of the mound (fine–medium–coarse, or peat).
2.3 Time study and analysis
Work data were analyzed with continuous timing where each of eight work elements was given a separate code (Harstela 1991); seven elements apply to Bracke and seven to Risutec (Table 2). Productivities were obtained from video data of each operator and pooled for both planting machines. Productivities are presented as productive time (PWh0) which does not include any delays. Work-time distributions were used to describe activity differences between the machines as productive time including delays < 15 min (PWh15) (Björheden and Thompson 2000). When presenting the results of the time study, time used to load the seedling storage rack was included in the work-time distribution, but was excluded from productivity figures.
| Table 2. Work elements of mechanized planting. Work elements performed by both machines are marked with an asterisk, only by Risutec are marked with R, and only by Bracke with B. | |
| Element | Definition |
| Mounding | Starts when mounding blade touches the ground and ends when mound is compressed. Also includes the time when boom is used to move obstacles that prevent mounding (e.g., stones or slash).* |
| Planting | Starts when mounding is complete and ends when planting unit lifts after planting.* |
| Moving the base machine | When excavator tracks are moving.* |
| Moving the boom | All boom movements.* |
| Interruptions | Any activity or interruption in the work of < 15 min duration that occurred during work time.* |
| Loading seedling storage rack | Time needed to load seedling storage rack. In case of Risutec, this includes filling the plant container also. Notice that seedlings need to be deplugged from cultivation trays manually prior to loading to the Risutec APC.* |
| Reloading seedling cassette | Time needed to seedling-wise reload seedling cassette.B |
| Automatic feeding system | Time when automatic feeding system is in operation. After the seventh seedling is planted, the loader starts to select another nine seedlings from the cultivation tray. After the ninth seedling is planted, the feeder returns to resupply with seedlings while mounds can be formed. While loading of the nine seedlings into the feeder the whole machine remains stationary. R |
For statistical analyses, the MIXED procedure was used with restricted maximum likelihood (REML) estimation in IBM SPSS Statistics 20.0. A linear mixed-effect model incorporates parameters for both fixed and random effects (McCulloch and Searle 2001). A linear mixed-effect model was used to examine the effects of device, operator, work difficulty factors and work site on productivity. The type of device [Risutec, Bracke] and operator [1, 2] were included in the model as dummy variables coded as 1 and 2, respectively. The model was based on PWh0 excluding the time spent loading the seedling storage rack. The variable selection method was backward elimination, in which all variables were entered into the equation and then sequentially removed until the final set contained only those found to be statistically significant at the 0.05 level. Work-difficulty factors, planting device and operator were treated as fixed effects whereas planting site was treated as a random effect. The following linear mixed-effect model for productivity (yijk) was used:
![]()
where
b0 = intercept
xijk = vector for explanatory variable (contains values of work difficulty factors)
α = vector of fixed-effect coefficients
Aj = fixed planting machine effect for planting machine j (j = 1/2)
Bk = fixed operator effect for operator k (k = 1/2)
ABjk = fixed interaction effect between planting machine and operator
Li = random planting area effect for area i (i = 1,…,4)
Cij = random effect of block j on planting area i
eijk = residual error
Planting quality was estimated according to seedling density and the proportion of seedlings with a planting defect. A Pearson’s correlation tests were performed to consider the relationships between planting productivity and quality. The number of planting events, seedlings planted in mounds, and share of successfully planted seedlings, as well as the outcome of the planting events (planting straight after mounding, planting to mounds made earlier, unsuccessful planting and new planting attempt) were analyzed based on video data for both planting machines and operators.
2.4 Cost calculations
The results include the total and unit costs of Bracke and Risutec APC derived from an analysis of time study and cost calculations. The purchase price of Bracke was assumed to be 45 000 € and of Risutec APC 80 000 €. In addition, total and unit costs for an idealized planting device with an automatic feeding system (referred as AUT) were estimated by applying the same results derived from the time study. AUT was assumed to be similar to the Bracke planting machine with the only difference being in automatic feeding. Thus, figures of AUT are based on Bracke plus an added investment of 32 000 € (in total 77 000 €), with the exception of the figures concerning the automatic feeding system based on the Risutec APC (i.e., capacity, time needed to load the plant container and seedling storage rack, need for maintenance and repair, etc.). The analysis identified the circumstances under which an AUT would be cost-effective. It was assumed that the mechanical availability (MA) of AUT was 100%. The purchase price of the base machine was assumed to be 125 000 €.
Cost calculations were based on activity-based costing (ABC) which expresses the relationship between activity and resource consumption (Cooper and Kaplan 1991; Edwards 2008). Productivity values used in cost calculations were derived from the time study (ratio of 1.10 from PWh0 to PWh15). Length of the working period for planting was five months, from May to October (Luoranen et al. 2005; Luoranen et al. 2006), which corresponds to half of the annual work of the base machine. Mechanized planting was assumed to take place in 1.5 shifts during the planting season. The lifetime of base machines was set to 12 000 h and 7500 h for planting devices. The annual total use was 2580 h and 1290 h for base machines and planting devices, respectively. The salvage value of the machines was calculated via the reducing balance method with annual depreciation rates of 40% and 25% for planting devices and base machines, respectively. The interest rate was 5%. The net annual capital costs (annuity) were established using MS Excel 2010 function PMT (Rate; Nper; Pv; Fv; Type). In the function, Rate was the interest rate per the period for the loan, Nper was the total numbers of periods (lifetime of the machine in years), Pv was the present value (current purchase price of the machine), Fv was the future value (salvage value of the machine at the end of its lifetime) and Type was 0(payment at the end of the period). Annual insurance and administration costs were assumed to be 900 € and 6800 € for all machines, respectively. Labor costs were set at 20.0 € h–1 comprising salary (11.77 € h–1) and other expenses such as holiday pay, salary administration, insurance and employee health care (total 8.23 € h–1). Maintenance and repair costs for base machine and planting device without automatic feeding systems were assumed to be 5.0 € h–1 and for base machine and planting device with automatic feeding system 6.0 € h–1.
When calculating relocation costs, it was assumed that seedlings were planted at a density of 1800 ha–1 on an average worksite area of 2.5 ha, and consecutive worksites were separated by an average distance of 15 km. The average distance between a worksite and the operator home was set at 25 km. Operator travel expenses were 0.50 € km–1 and machine relocation costs 10.0 € km–1 for all machines. Fuel costs of planting work was assumed to be 9.50 € h–1 with fuel consumption of 10.0 l h–1. The relocation time including preparatory time was set 0.88 h per worksite.
3 Results
3.1 Work-time distribution and productivities
The productive time consumed for planting was on average 18.36 seconds per seedling (s pl–1) for Risutec and 15.28 s pl–1 for Bracke (Fig. 2). The PWh15 time (including time loading seedling storage rack) consumed for planting was 22.80 s pl–1 for Risutec and 15.44 s pl–1 for Bracke. The most time was spent on mounding (5.79 s pl–1 for Risutec and 6.05 s pl–1 for Bracke) and moving the boom (5.15 s pl–1 for Risutec and 3.04 s pl–1 for Bracke). Work was interrupted much more frequently for the Risutec APC (4.07 s pl–1) than with Bracke (0.13 s pl–1), and operator 2 spent more time interrupted (5.29 s pl–1) than the more experienced operator 1 (2.85 s pl–1) when working with Risutec. Interruptions were mostly due to problems in the automatic feeding system requiring the operator to stop work, troubleshoot and solve the problem. Reloading the Bracke seedling cassette consumed an average of 2.69 s pl–1. Although mounding and seedling loading could take place simultaneously, the Risutec was often stationary while automatic reloading took place and consumed an average 2.84 s pl–1, varying from 1.19 s pl–1 (operator 1) to 4.52 s pl–1 (operator 2). Loading the Risutec seedling storage rack took longer (0.38 s pl–1) than the Bracke (0.04 s pl–1) because seedlings need to be manually deplugged from tray cells prior to loading. Deplugging took about 48% of the time consumed loading Risutec seedling storage rack.
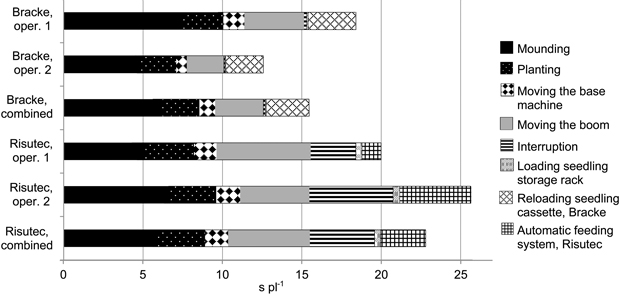
Fig. 2. Work-time distribution (seconds per seedling [s pl–1]) based on productive work time including delays < 15 min (PWh15) for both planting machines and operators.
Mean productivity of Bracke (244 seedlings per PWh0 [pl PWh0–1]) was 24.5% higher than that of Risutec (196 pl PWh0–1) (Table 3). Operator 1 (215 pl PWh0–1) operated the Risutec more effectively than operator 2 (177 pl PWh0–1) and in the case of the Bracke it was vice versa (operator 1 = 199 pl PWh0–1, operator 2 = 290 pl PWh0–1).
| Table 3. Measured mean productivities (seedlings per hour [pl h–1]) of planting machines and operators for productive work time (PWh0) and productive work time including delays < 15 min (PWh15). | |||||||
| Planting device | Operator | N | Mean, PWh0 | Min. | Max. | SD | Mean, PWh15 |
| Risutec | 1 | 4 | 215 | 202 | 235 | 15.6 | 184 |
| 2 | 4 | 177 | 169 | 190 | 9.8 | 143 | |
| Combined | 8 | 196 | 169 | 235 | 23.4 | 163 | |
| Bracke | 1 | 4 | 199 | 177 | 239 | 27.6 | 199 |
| 2 | 4 | 290 | 253 | 317 | 27.2 | 289 | |
| Combined | 8 | 244 | 177 | 317 | 55.5 | 244 | |
Stoniness was the only work difficulty factor that affected productivity and was thus included in the linear mixed-effect model (Table 4). Device and operator combinations differed significantly, productivity being the highest for Bracke and for operator 2 (p = 0.00). Operator 1 working with the Risutec differed from any other combination of operator and planting machine statistically significantly (p = 0.00). Random variation was small; 4.0 pl PWh0–1 due to planting area and 10.3 pl PWh0–1due unknown factors.
| Table 4. A linear mixed-effect model for predicting productivity of planting work. The model was based on productive work time (PWh0) excluding the time required to reload the seedling storage rack. | ||||
| Variable | Estimate | Standard error | t-value | p-value |
| Intercept | 331.39 | 9.16 | 37.56 | 0.00 |
| [Device = Risutec] | –111.47 | 7.29 | –15.29 | 0.00 |
| [Operator = 1] | –106.47 | 7.71 | –13.80 | 0.00 |
| Stoniness | –1.10 | 0.20 | –5.56 | 0.00 |
| [Operator = 1] * [Device = Risutec] | 133.81 | 10.32 | 12.97 | 0.00 |
| Variance | Standard error of variance | SD | ||
| Planting area | 15.98 | 36.11 | 4.00 | |
| Block | 0.00 | 0.00 | 0.00 | |
| Residual | 106.00 | 0.00 | 10.30 | |
3.2 Quality
The proportion of successfully planted seedlings was 95.6% for Bracke and 92.4% for Risutec APC (Table 5). There were more planting events than seedlings in mounds and fewer seedlings in mounds than seedlings in the seedling cassette or cultivation trays. Both operators planted almost all seedlings immediately after mounding with the Bracke (94.9%), whereas the corresponding figure was 67.9% for Risutec. With respect to the Risutec, operator 1 formed mounds while seedlings were selected by the automatic feeding system and thus the share of planting without mounding (31.9%) is higher than that for operator 2 (0.3%), who stopped other work while seedlings were selected. The portion of unsuccessful seedlings (2.6%) and new planting attempts (12.5%) were higher for Risutec than Bracke (0.4% and 4.4%, respectively). There was no significant correlation between productivity and the share of planting defects for Bracke (p = 0.94) or Risutec (p = 0.29), nor the share of successfully planted seedlings (p = 0.08 and p = 0.66, respectively).
| Table 5. Share of planting events and related features for both planting machines and operators (mean values). | ||||||||
| Planting device | Operator | Planting events | Seedlings in mounds | Successfully planted (%) | Outcome of planting events (% of events) | |||
| Planting after mounding | Planting on mounds made separately | Unsuccessful | New planting attempt | |||||
| Risutec | 1 | 736 | 602 | 92.9 | 49.5 | 31.9 | 3.3 | 15.4 |
| 2 | 661 | 587 | 91.9 | 88.5 | 0.3 | 2.0 | 9.2 | |
| Combined | 1397 | 1189 | 92.4 | 67.9 | 17.0 | 2.6 | 12.5 | |
| Bracke | 1 | 700 | 662 | 95.1 | 94.4 | 0.6 | 0.7 | 4.3 |
| 2 | 717 | 684 | 96.1 | 95.4 | 0.0 | 0.0 | 4.6 | |
| Combined | 1417 | 1346 | 95.6 | 94.9 | 0.3 | 0.4 | 4.4 | |
Relatively more seedlings planted by Risutec (25.0%) expressed planting defects than those planted by Bracke (15.4%) (Table 6). The most common planting defects were inadequate soil compaction, too shallow planting depth, damage to top shoot and seedling not planted in the middle of the mound, which together constituted 82.4% of all planting defects. Only 2.9% of defects were fatal. Operator 1 planted on average more seedlings (2150 with Risutec and 2000 with Bracke) than operator 2 (1850 with Risutec and 1700 with Bracke). In all cases the density was at least or higher than the set limit of 1 600 seedlings per ha. All seedlings were planted on mounds and 96.5% were placed in positions where stones, slash, or water did not adversely affect the growing conditions of the seedling.
| Table 6. Planting density (seedlings per ha [pl ha–1]) and the percentage of seedlings exhibiting some planting defect (%). | |||||||||||
| Planting device | Operator | Planting density (pl ha–1) | Planting defects (%) | ||||||||
| N | Mean | Min. | Max. | SD | N | Mean | Min. | Max. | SD | ||
| Risutec | 1 | 4 | 2150 | 1800 | 2400 | 300 | 4 | 22.5 | 10.0 | 33.3 | 11.0 |
| 2 | 4 | 1850 | 1600 | 2000 | 191.5 | 4 | 27.5 | 10.0 | 40.0 | 12.6 | |
| Combined | 8 | 2000 | 1600 | 2400 | 282.8 | 8 | 25.0 | 10.0 | 40.0 | 11.3 | |
| Bracke | 1 | 4 | 2000 | 1600 | 2400 | 326.6 | 4 | 16.7 | 10.0 | 20.0 | 14.1 |
| 2 | 4 | 1700 | 1600 | 2000 | 200.0 | 4 | 14.1 | 0.0 | 36.4 | 17.6 | |
| Combined | 8 | 1850 | 1600 | 2400 | 297.6 | 8 | 15.4 | 0.0 | 36.4 | 12.0 | |
3.3 Cost calculations
Hourly fixed costs of Risutec APC were 25.9% higher than those of Bracke (Table 7). Even though the Risutec total costs were only 6.4% higher than those of Bracke, the difference in unit cost per planted seedling was 39.1%. Unit costs of an idealized AUT were 4.7% lower than those of Bracke due to higher productivity (281 pl PWh0–1). The break-even point for an AUT was 55 517€ (100 517€ in total), compared to Bracke.
| Table 7. Fixed costs (i.e., base machine, planting device and administration), variable costs, total costs (€ per hour [€ h–1]) and unit costs (€ per seedling [€ pl–1]) of Bracke and Risutec APC as well as an idealized planting machine with automatic feeding system (AUT), based on productive work time including delays < 15 min (PWh15). | |||
| Bracke | Risutec APC | AUT | |
| Base machine (€ h–1) | 9.91 | 9.79 | 9.89 |
| Planting device (€ h–1) | 6.94 | 12.30 | 11.90 |
| Administrative costs (€ h–1) | 3.25 | 3.21 | 3.27 |
| Fixed costs (€ h–1) | 20.10 | 25.30 | 25.06 |
| Variable costs (€ h–1) | 46.87 | 45.93 | 49.20 |
| Total costs (€ h–1) | 66.97 | 71.24 | 74.26 |
| Unit costs (€ pl–1) | 0.28 | 0.39 | 0.27 |
Annual planting capacities were 159 and 123 hectares per year (ha yr–1) for Bracke and Risutec APC, corresponding to 285 314 and 220 722 seedlings, respectively. Planting capacity could be raised 15.4% by adding an idealized automatic feeding system to Bracke (AUT). Total annual working time was 1290 hours, of which planting accounted for 91.9% and 91.2% for Bracke and Risutec, respectively. The time spent planting decreased by adding an automatic feeding system because the need for relocation of the base machine increased due to the higher productivity level.
As the speed of mounding and planting increases, manual reloading the seedling cassette becomes the limiting factor affecting productivity and the need for an automatic feeding system becomes acute (Fig. 3). At a productivity of 100 pl PWh0–1, the proportion of productive work time (PWh0) spent handling seedlings was 7.1% for Bracke (MAN) and 2.1% with AUT, whereas at 300 pl PWh0–1 the corresponding figures were 18.6% and 6.0%, respectively. An effective automatic feeding system could increase productivity. When adding the time spent on handling the seedlings to the productivity of 200 pl PWh0–1, the productivity of the planting machine with AUT (192 pl PWh0–1) is 10.5% higher than machine without (174 pl PWh0–1).
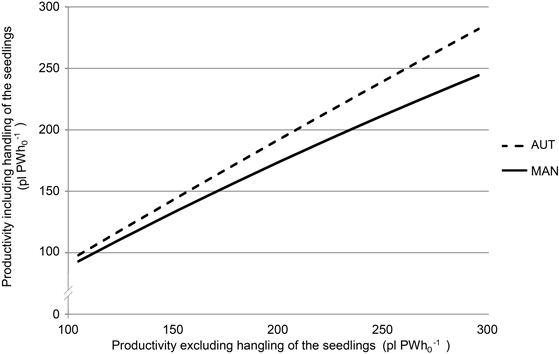
Fig. 3. Productivities (seedlings per productive work hour [pl PWh0–1]) for planting machines with (AUT) and without (MAN) automatic feeding system when excluding (x-axis) and including (y-axis) time used for handling the seedlings. Handling the seedlings involves time spent loading the seedling storage rack (MAN + AUT) and reloading the seedling cassette (MAN).
Capital investment is justifiable when productivity and demand are sufficient (Fig. 4). An investment of 80 000€ (45 000 € planting device + 35 000 € automatic feeding system) requires a minimum productivity of 125 pl PWh0–1 in order to compete with a basic planting device without an AUT. An additional investment of 55 000 € for an automatic feeding system would require a productivity of at least 216 pl PWh0–1, and 75 000 € requires at least 308 pl PWh0–1.
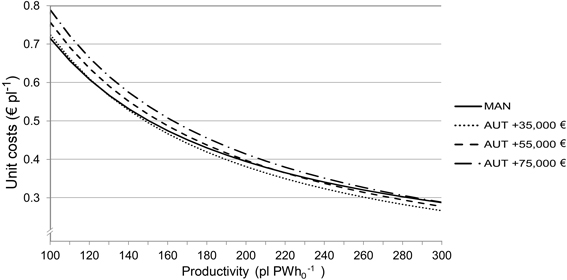
Fig. 4. Unit costs (€ per seedling (€ pl–1]), of mechanized planting with the Bracke planting machine (MAN) and additional cost of an idealized automatic feeding system (AUT) at different productivity levels (seedlings per productive work hour [pl PWh0–1]). Purchase price of the MAN was set to 45 000 €.
4 Discussion
As it currently exists, performance of the Risutec APC was lower than that of the Bracke P11.a, both in terms of productivity and planting quality. The amount of work time interruptions due to malfunction was high and time spent repairing the machine would lead to higher unit costs and lower productivity in practice. It is good to keep in mind that the Risutec APC was a prototype and has not undergone extensive testing or refinement. However, in the analysis it was assumed that the Risutec would be reliable, as it should be when a new device is introduced to the market. In reality, a machine with a more complex design probably increases the demand for maintenance and repair, which in turn decreases its mechanical availability (Mellgren 1989). Ersson et al. (2014) stated if the mechanical availability (MA) of the MagMat falls by as little as 3% (i.e., from 100% to 97%), the added investment cost had to be almost halved.
The time study provided valuable data and important estimates for cost calculations concerning the operation of automatic feeding system. Because the productivity of Risutec was lower than Bracke, an idealized planting machine AUT was used to explore the viability of the automatic feeding of seedlings. It was assumed that the feeding system of the idealized machine works continuously rather than intermittent process of selecting the seedlings performed by the Risutec APC.
Due to a small number of observations, results of the time study should be interpreted cautiously. Working conditions were similar and the effects of the random site variation on productivity were only 4.00 pl PWh0–1. As such, it can be assumed that observations were equivalent and their comparison was appropriate. Easy working conditions might explain the relatively high productivity rates observed in this study. Of all the work difficulty factors, stoniness was the only one that affected productivity. Operators were filmed for relatively brief periods, so there might be an observer effect on performance inflating productivity, so that productivities were higher during the time study than it would have been normally (Mayo 1933). In terms of machine performance overall, productivity of the Bracke (244 pl PWh15–1) was higher than the minimum level (190 pl PWh15–1) required for mechanized planting to compete with separate spot mounding and manual planting (Hallongren et al. 2014). Productivity of the Risutec (196 pl PWh0–1) was also above that level, but PWh15 productivity (163 pl PWh15–1) was not. However, the productivity of operator 1 with Risutec (184 pl PWh15–1) was higher and close to the threshold.
The two operators applied different techniques when working with the Risutec APC. Operator 1 performed mounding and planting separately, thereby spending more time moving the boom than operator 2. Operator 2 stopped all work while the automatic feeding system was selecting seedlings whereas operator 1 performed mounding and seedling selection simultaneously. Thus, operator 1 spent less time on “automatic feeding system” because the time was registered as mounding and the planting device was not idle as for operator 2. Differences in work technique might account for the difference in operator productivities, so correct technique and proper training are essential. Prior experience with machines plays a significant role in productivity; performance differences of up to 65% have been reported between inexperienced and experienced operators (Rantala and Laine 2010).
Although earlier studies suggest that the size of the base machine does not have a significant effect on productivity (Arnkil 1997; Rummukainen 2002; Saarinen 2004), the Risutec is a larger and heavier device than Bracke so it likely requires a larger base machine and thus more fuel to move and operate. It was assumed that the base machine costs were similar, although in reality this might increase the operating costs and lower competitiveness.
In addition to sufficiently high productivity, quality of mechanized planting must be at least the same as in manual techniques (Harstela 2004). Planting quality for Bracke has been reported to meet this criterion (Luoranen et al. 2011). Here, it was observed more technical problems with the Risutec which lowered planting quality. Although few planting defects were fatal, many seedlings suffered a minor planting defect and the proportion of successfully planted seedlings was lower for Risutec than Bracke. Overall, with respect to seedling density, the target fulfillment of both machines was good.
Expenses associated with seedling packaging and transportation were not included in the cost calculations. There are no seedling packaging systems specifically designed for use in planting machines with an automatic feeding system. Ersson et al. (2011) stated that investments in machine-specific seedling packaging systems are justified only when machine employment, productivity and the number of contracted planting machines increase substantially from their current levels. At the moment, manual deplugging of the seedlings prior to loading to the Risutec APC consumes time and this step needs to be automated. Minimizing the time spent replacing cultivation trays is essential for a cost-effective automatic feeding system (Ersson et al. 2014). Of the current seedling packaging systems in use, cardboard boxes are the most expensive because package is disposable and not returned to the nursery for reuse. Plastic trays with a capacity of 160 seedlings are cheaper than 81-seedling cultivation trays and both can be recycled (Ersson et al. 2011; Saarinen et al. 2013). Plastic trays are the most cost-effective solution for shipping seedlings, however, there might be difficulties adapting plastic trays to an automatic feeding system because seedlings are not spatially arranged in a sequence as they are in cultivation trays (Saarinen et al. 2013).
In addition to seedling management and delivery systems, machines that continuously advance offer scope for improving the current technology. Harvesting slash and stumps for energy purposes will make more sites suitable for continuously-advancing planting machines by improving and standardizing worksite conditions. An effective automatic feeding system could increase productivity and thus make mechanized planting more cost-effective, as shown in the idealized AUT. Also, Ersson et al. (2014) found that the MagMat increased planting machine productivity by 8–9% depending on the planting device used. The automatic feeding of seedlings would be an essential component for continuously advancing planting machines with productivity rates several times higher than machines in use today. Automation could also be utilized when developing new types of planting machine as well as increasing the capacity of the seedling cassette. The effective application of automatic feeding systems can lead to cost savings when productivity is sufficiently high.
In conclusion, it remains possible to reduce operating costs with an effective automatic feeding system but the technology is not yet sufficiently developed to reach that goal. Optimization and integration of the entire planting service chain from nursery to outplanting could lower costs when developing an automatic feeding system for mechanized planting.
This article includes a supplementary video file of Risutec APC and Bracke planting machines in operation.
Acknowledgements
Authors thank UPM Forest for providing work sites and planting devices for the research and Mr. Sakari Hekkala for his effort in data collection. We also thank Dr. Juha Lappi his help with the analysis and two anonymous reviewers for their valuable comments. Mrs. Anne-Maarit Keränen from Lapland University of Applied Sciences made her bachelor’s thesis based on the data.
References
Arnkil R. (1997). Bräcke Planter- ja Ilves-istutuskoneiden tuottavuus ja työjälki metsänistutuksessa. [Productivity and quality of work of Bräcke Planter and Ilves planting devices]. M.(Sc.) Thesis. University of Helsinki, Faculty of Agriculture and Forestry. 51 p.
Berg S. (1986). Terrängtypschema för skogsarbete. [Terrain classification for forestry work]. Forsningsstiftelsen Skogsarbeten, Stockholm. 29 p.
Björheden R., Thompson M.A. (2000). An international nomenclature for forest work study. In: Field D.B. (ed.). Proceedings, IUFRO 1995 S3:04 subject area: 20th World Congress; 1995 August 6–12; Tampere, Finland. Misc. Rep. 422. University of Maine, Orono, ME. p. 190–215.
Cooper R., Kaplan R.S. (1991). Profit priorities from activity-based costing. Harvard Business Review, May–June 1991: 130–135.
Drake-Brockman G.R. (1998). Evaluation of the Bracke Planter on UK restock sites. Technical Development Branch, Forestry Commission, Technical Note 7/98. 10 p.
Edwards S. (2008). Activity based costing. Topic Gateway Series 1. The Chartered Institute of Management Accountants, Technical Information Service. 11 p.
Ersson B.T. (2010). Possible concepts for mechanized tree planting in southern Sweden – an introductory essay on forest technology. SLU, Arbetsrapport 269. 51 p.
Ersson B.T., Bergsten U., Lindroos O. (2011). The cost-efficiency of seedling packaging specifically designed for tree planting machines. Silva Fennica 45(3): 379–394. http://dx.doi.org/10.14214/sf.108.
Ersson B.T., Bergsten U., Lindroos O. (2014). Reloading mechanized tree planting devices faster using a seedling tray carousel. Silva Fennica 48(2) article 1064. 14 p. http://dx.doi.org/10.14214/sf.1064.
Hallonborg U., von Hofsten H., Mattson S., Hagberg J., Thorsén Å., Nyström C., Arvidsson H. (1995). Maskinell plantering med Silva Nova: nuvarande status samt utvecklingsmöjligheter i jämförelse med manuell plantering. [Mechanized planting with the Silva Nova tree planter – recent state and feasibility compared with manual planting]. Skogforsk, Redogörelse 6. 95 p.
Hallonborg U., von Hofsten H., Mattsson S., Thorsén Å. (1997). Planteringsmaskiner i skogsbruket – en beskrivning av metoder och maskiner. [Forestry planting machines – a description of the methods and the machines]. Skogforsk, Redogörelse 7. 24 p.
Hallongren H., Laine T., Saarinen V-M., Strandström M. (2014). Competitiveness of mechanized tree planting in Finland. Scandinavian Journal of Forest Research 29(2): 144–151. http://dx.doi.org/10.1080/02827581.2014.881542.
Harstela P. (1991). Work studies in forestry. Silva Carelica 18. 41 p.
Harstela P. (2004). Kustannustehokas metsänhoito. [Cost-effective silviculture]. Gravita Ky. 126 p.
von Hofsten H., Petersson G. (1991). Högläggning med Öjehögen. [Soil scarification with Öje-mounder]. Forskningsstiftelsen Skogsarbeten, Resultat 7.
Juntunen M.-L. (2013). Metsänhoitoyhdistykset metsänhoidon työpalvelujen tuottajina. [Forest management associations as providers of silvicultural services]. Metsätieteen aikakauskirja 2/2013: 141–154.
Kaila S. (1984). G.A. Serlachius Oy:n istutuskone. [The G.A Serlachius planting machine. Test report of the machine]. Metsätehon katsaus 9: 1–6.
Karppinen H., Hänninen H., Ripatti P. (2002). Suomalainen metsänomistaja 2000. [Finnish forest-owner 2000]. Finnish Forest Research Institute, Research Papers 852. 83 p.
Laine T., Rantala J. (2013). Mechanized tree planting with an excavator mounted M-Planter planting device. International Journal of Forest Engineering 24(3): 183–193. http://dx.doi.org/10.1080/14942119.2013.844884.
Luoranen J., Rikala R., Konttinen K., Smolander H. (2005). Extending the planting period of dormant and growing Norway spruce container seedling to early summer. Silva Fennica 39(4): 481–496. http://dx.doi.org/10.14214/sf.361.
Luoranen J., Rikala R., Konttinen K., Smolander H. (2006). Summer planting of Picea abies container-grown seedlings: effects of planting date on survival, height growth and root egress. Forest Ecology and Management 237(1–3): 534–544.
Luoranen J., Rikala R., Smolander H. (2011). Machine planting of Norway spruce by Bracke and Ecoplanter: an evaluation of soil preparation, planting method and seedling performance. Silva Fennica 45(3): 341–357. http://dx.doi.org/10.14214/sf.107.
Mäkinen P. (1997). Success factors for forest machine entrepreneurs. Journal of Forest Engineering 8(2): 27–35.
Mayo E. (1933). Human problems of an industrial civilization. Macmillan, New York. 194 p.
McCulloch C.E., Searle S.R. (2001). Generalized, linear, and mixed models. Wiley Series in Probability and Statistics. John Wiley & Sons, Inc. 358 p.
Mellgren P.G. (1989). More reliable multi-function wood-harvesting machines in the future? Journal of Forest Engineering 1(1): 17–22.
Rantala J., Harstela P., Saarinen V.-M., Tervo L. (2009). A techno-economic evaluation of Bracke and M-Planter tree planting devices. Silva Fennica 43(4): 659–667. http://dx.doi.org/10.14214/sf.186.
Rantala J., Laine T. (2010). Productivity of the M-Planter tree-planting device in practice. Silva Fennica 44(5): 859–869. http://dx.doi.org/10.14214/sf.125.
Rummukainen A., Tervo L., Kautto K. (2002). Ilves- ja Bräcke-istutuskoneet – tuottavuus, työnjälki ja kustannukset. [Ilves and Bräcke forest planting machines – productivity, quality of work and cost]. Finnish Forest Research Institute Research Papers 857. 75 p.
Saarinen V.-M. (2004). Productivity and quality of work with the Bräcke and Ecoplanter planting machines. In: Uusitalo J., Nurminen T., Ovaskainen H. (eds.). NSR Conference on forest operations 2004 – Proceedings. Silva Carelica 45: 57–63.
Saarinen V-M., Hyyti H., Laine T., Strandström M. (2013). Kohti jatkuvatoimista koneistutusta. [Towards continuously operating planting machines]. Metsäteho Report 227. 30 p.
Strandström M., Hämäläinen J., Pajuoja H. (2009). Metsänhoidon koneellistaminen – visio ja T&K-ohjelma. [Mechanization of silviculture – vision and R&D program]. Metsäteho Report 206. 24 p.
Vartiamäki T. (2003). Koneellinen metsänistutus vuonna 2003 – kyselytutkimuksen tulokset. [Mechanical planting in year 2003 – results of a survey research]. Metsäteho Report 154. 14 p.
Total of 33 references
