Kristina Mjöfors  ,
Monika Strömgren,
Hans-Örjan Nohrstedt,
Annemieke Ingrid Gärdenäs
,
Monika Strömgren,
Hans-Örjan Nohrstedt,
Annemieke Ingrid Gärdenäs
Impact of site-preparation on soil-surface CO2 fluxes and litter decomposition in a clear-cut in Sweden
Mjöfors K., Strömgren M., Nohrstedt H.-Ö., Gärdenäs A. I. (2015). Impact of site-preparation on soil-surface CO2 fluxes and litter decomposition in a clear-cut in Sweden. Silva Fennica vol. 49 no. 5 article id 1403. https://doi.org/10.14214/sf.1403
Highlights
- Disturbances of the soil did not lead to higher CO2 emissions from the soil
- Heavy mixing of the soil lead to lower CO2 emissions from the soil
- Buried needles and coarse roots decomposed faster than those on the surface
- Abundance of δ15N decreased in needles and roots after site preparation.
Abstract
Boreal forest soil contains significant amounts of organic carbon. Soil disturbance, caused for example by site preparation or stump extraction, may increase decomposition and thus lead to higher CO2 emissions, contributing to global warming. The aim of this study was to quantify responses of soil-surface CO2 fluxes (Rs) and litter (needle and root) decomposition rates following various kinds of soil disturbance commonly caused by mechanical site preparation and stump harvest. For this purpose four treatments were applied in a clear-cut site in central Sweden: i) removal of the humus layer and top 2 cm of mineral soil, ii) placement of a humus layer and 2 cm of mineral soil upside down on top of undisturbed soil, forming a double humus layer buried under mineral soil, iii) heavy mixing of the humus layer and mineral soil, and iv) no disturbance (control). Rs measurements were acquired with a portable respiration system during two growing seasons. To assess the treatments’ effects on litter decomposition rates, needles or coarse roots (Ø = 6 mm) were incubated in litterbags at positions they would be located after the treatments (buried, or on top of the soil). The results indicate that site preparation-simulating treatments have no effect or may significantly reduce, rather than increase, CO2 emissions during the following two years. They also show that buried litter decomposes more rapidly than litter on the surface, but in other respects the treatments have little effect on litter decomposition rates.
Keywords
boreal forest;
soil disturbance;
soil respiration;
carbon stock;
needle decomposition;
coarse root decomposition
-
Mjöfors,
Swedish University of Agricultural Sciences (SLU), Department of Soil and Environment, P.O. Box 7014, 150 07 Uppsala, Sweden
E-mail
kristina.mjofors@slu.se
- Strömgren, Swedish University of Agricultural Sciences (SLU), Department of Soil and Environment, P.O. Box 7014, 150 07 Uppsala, Sweden E-mail Monika.stromgren@slu.se
- Nohrstedt, Swedish University of Agricultural Sciences (SLU), Department of Soil and Environment, P.O. Box 7014, 150 07 Uppsala, Sweden E-mail Hans-orjan.nohrstedt@slu.se
- Gärdenäs, Swedish University of Agricultural Sciences (SLU), Department of Soil and Environment, P.O. Box 7014, 150 07 Uppsala, Sweden E-mail Annemieke.gardenas@slu.se
Received 5 June 2015 Accepted 9 July 2015 Published 28 September 2015
Views 218540
Available at https://doi.org/10.14214/sf.1403 | Download PDF

1 Introduction
More than half of the Swedish land area (23.1 Mha) is covered by forests with a production capacity > 1 m3 wood ha–1 yr–1. Of this, 0.23 Mha is clear-cut annually, and some form of site preparation is carried out on 92% of the clear-cut area to enhance forest regeneration (Swedish Forest Agency 2014). The most common site preparation methods in Sweden are harrowing, and patch scarification (including mounding), which are respectively applied to ca. 52 and 25% of the annually clear-cut area (Eriksson 2014). During the last decade the potential utility of harvesting stumps for bioenergy production, and thus reducing reliance on fossil fuels and emissions of carbon dioxide, has been extensively tested (Walmsley and Godbold 2010; Persson 2013). However, both site preparation and stump harvest cause considerable soil disturbance by creating microsites characterized by a double humus layer, exposed mineral soil, and/or mixed humus and mineral soil layers.
Mechanical site preparation has been shown to increase soil temperature (Örlander et al. 1990; Kubin and Kemppainen 1994; Balisky and Burton 1997; Örlander et al. 1998) which positively affects rates of various soil and plant processes, such as water and nutrient uptake. Site preparation also changes the soil moisture conditions in microsites (Örlander et al. 1990; Elliott et al. 1998; Burton et al. 2000; Nohrstedt 2000; Mäkitalo and Hyvönen 2004; Sutinen et al. 2006). Thus, since both soil temperature and soil moisture affect decomposition rates, site preparation is also highly likely to affect decomposition.
In addition, site preparation generally leads to reductions in soil organic carbon (SOC) stocks, according to several reviews (Johnson 1992; de Wit and Kvindesland 1999; Freeman 2005; Jandl et al. 2007). This has been generally attributed to increased rates of decomposition, but Johnson (1992) emphasizes that it is difficult to distinguish between C losses caused by increased decomposition and gathering slash into piles in some studies. Another complicating factor is that a reduction in soil C detected in the upper soil layers may simply be due to movement of some of the C into deeper layers caused by mixing the humus layer with the mineral soil (Freeman 2005; Nordborg 2006). Some of the site preparation studies included in the cited reviews focused on a particular soil horizon and did not take total soil C stocks into account, which further confounds interpretation of the results. Moreover, these reviews covered a wide range of forest management methods applied in diverse areas, and only two of the primary studies (Örlander et al. 1996; Nordborg et al. 2006) were conducted in Nordic countries. In addition, effects of site preparation treatments on litter decomposition reported in the cited reviews were mainly based on studies in which newly shed needles were observed during the first subsequent years (e.g. Johansson 1994b; Lundmark-Thelin and Johansson 1997). These studies indicated that mass losses from litter are higher when it is placed between humus layers than when it is lying on an undisturbed soil surface, probably due to higher temperatures, more pronounced moisture cycles and the mixing of the humus layer and mineral soil (Johansson 1994b; Lundmark-Thelin and Johansson 1997; Mallik and Hu 1997). However, there is little knowledge of the effects of mechanical site preparation on the decomposition of other litter components, such as coarse roots.
Boreal forest soils contain ca. 80 ton C ha–1, according to estimates by Olsson et al. (2009) and Stendahl et al. (2010), which is ca. twice as much as stocks in the standing tree biomass (Raich and Schlesinger 1992; Goodale et al. 2002). Even minor soil disturbance can potentially affect decomposition rates, thereby reducing SOC stocks and increasing CO2 emissions to the atmosphere. It is difficult to measure changes in SOC (Muukkonen et al. 2009), as changes are usually small in relation to the large stock. However, small changes in C emissions (and hence losses of SOC stocks) to the atmosphere following a disturbance can be relatively easily detected by measuring soil-surface CO2 fluxes. A correction must also be applied to account for differences in the proportion of treated areas that is affected by soil disturbance (which varies substantially, depending on the method applied). Harrowing affects roughly half of the soil surface of clear-felled areas, whereas patch scarification affects around 25% (Bäcke et al. 1986; Strömgren and Mjöfors 2012; Strömgren et al. 2012). More pronounced disturbances, such as stump harvesting, affect around 75% of the soil surface (Kataja-Aho et al. 2011; Strömgren and Mjöfors 2012; Strömgren et al. 2012).
In this study we examined effects of several types of soil disturbance commonly caused by mechanical site preparation and stump harvest on both soil-surface CO2 fluxes (Rs) and litter (needle and root) decomposition. A tested hypothesis was that Rs would be related to the amount of available organic matter following the applied treatments (hence removing the organic layer and doubling the humus layer were respectively expected to reduce and increase fluxes). We also hypothesized that mixing the mineral soil and organic layer would increase Rs by creating more favorable conditions for the development of microorganisms. To test these hypotheses, we artificially disturbed soil at a clear-cut site in three ways then frequently measured Rs over a two-year period. We also studied effects of the soil disturbances on decomposition rates of brown needle litter and fresh coarse roots (ø = 6 mm) up to four years after the treatment. Furthermore, we monitored nitrogen (N) and 15N contents in the litter during the decomposition, since N is closely linked to the C cycle and strongly affects decomposition and respiration rates (e.g. Berg and Matzner 1997; Schlesinger and Andrews 2000; Janssens et al. 2010). The N content in root and needle litter usually increases in early stages of decomposition through ingrowth of microorganisms and their translocation of N from other organic matter (Berg and Laskowski 2005). Since the abundance of 15N increases with depth in the soil profile (Hobbie and Högberg 2012), 15N analyses can provide information on effects of treatments on origins of the N in incubated litter.
2 Materials and methods
2.1 Site characteristics and experimental design
The experimental site was situated in eastern central Sweden (60°59´N, 16°24´E, 200 m a.s.l.), in a conifer forest, 3 km from the small municipality Åmot. The area is located in the boreal zone (cf. Ahti et al. 1968) and has a cold temperate climate (cf. Köppen 1936; Holdridge 1947). According to data recorded at Åmot from 1995 to 2009, mean annual precipitation and temperature are 593 mm yr–1 and 4.3 °C, respectively, and according to records from 1961 to 1990 snow usually covers the ground from November to mid-April (SMHI 2012).
The soil parent material is glacial sand, the soil was classified as podzol (cf. IUSS 2007) and the humus layer was ca. 5 cm thick. Before the final harvest, in May 2009, the forest stand contained 700 stems ha–1, 50% Scots pine (Pinus sylvestris L.) and 50% Norway spruce (Picea abies (L.) Karst), with a stem volume of 280 m3 ha–1. The site index, defined as the expected height of the largest trees (in meters) at age 100 years (H100) was 26. Logging residues were removed with the harvest. Following the harvest, the humus layer was ca. 5 cm thick and there was no visible ground vegetation apart from a thin moss layer.
In the clear-felled area, 16 plots (2 × 2 m) were laid out in May 2009, in four blocks with minimal distance between plots, and all blocks within a radius of 25 m, so that the environmental conditions in each block were very similar. The four plots in each block were randomly assigned to the following four treatments: control (CON), exposed mineral soil (EMS), double humus layer with mineral soil on top (DHL), and mixed mineral and humus layer (MIX). For further details regarding the treatments, see Table 1 and Fig. 1. The treatments were applied using an excavator equipped with a backhoe on June 16, 2009, and were intended to result in micro-environments mimicking four kinds of disturbances commonly seen after site preparation (such as patch scarification and harrowing) and stump harvest. No seedlings were planted in the experimental plots.
| Table 1. Description of experimental treatments, including soil depth for incubation of needle and root litter. | |||
| Treatment | Description of treatment | Incubation depth | |
| Needle litter | Root litter | ||
| Control (CON) | Undisturbed reference | 0 cm | 5 cm |
| Exposed mineral soil (EMS) | Removal of humus layer (5 cm) and the top 2 cm of mineral soil | 0 cm | 0 cm |
| Double humus layer (DHL) | Removed layers from EMS were inverted and placed on undisturbed soil | 7 cm* | 7 cm* |
| Mixed soil (MIX) | Humus layer and mineral soil were mixed to a depth of 30 cm | 5 cm | 5 cm |
| * Between the humus layers | |||
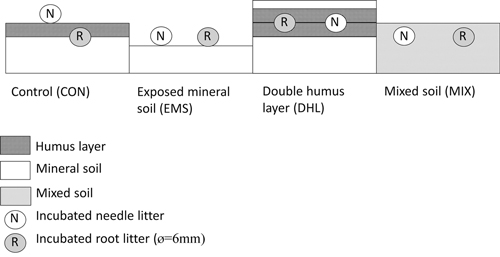
Fig. 1. Schematic diagram of the disturbance created by each of the treatments – control (CON), exposed mineral soil (EMS), double humus layer (DHL), and mixed soil (MIX) – showing locations in the soil profile of the incubated litterbags containing needle (N) and root (R) litter.
2.2 Soil-surface CO2 fluxes (Rs)
Soil-surface CO2 fluxes in each plot (Rs) were measured before the treatments on June 10, 2009, and on 10 occasions after the treatment, usually at 2–3 weeks intervals, from late June to early October in 2009. They were also measured five times, monthly, from mid-May to mid-October in 2010.
The Rs was measured with a portable soil-respiration system consisting of an infra-red gas analyzer (IRGA) connected to an opaque soil-respiration chamber (EGM-4 with a SRC-1, PP-systems, Hitchin, UK), according to Parkinson (1981). The IRGA was equipped with a humidity sensor and a pressure sensor to adjust measured CO2 concentrations to account for variations in humidity and air pressure. This soil respiration measurement system is frequently used and has been previously tested and compared to other systems, e.g., by Pumpanen et al. (2004a). During each measurement, the respiration chamber was attached to a pre-installed PVC collar (10 cm in diameter), and readings were acquired every 4.2 seconds during an 80-second period. The last 14 readings were used for estimating Rs by linear regression. At the same time, soil temperature at 10 cm depth and soil moisture at 5 cm depth were measured at a point adjacent to the collar with a STP-1 Soil Temperature Probe (PP-systems, Hitchin, UK) and a ML2x ThetaProbe (Delta-T, Cambridge, UK), respectively. The general calibration settings for mineral soil, e.g., C content < 7% and bulk density > 1 g cm–3, were used for the soil moisture sensor (Delta-T Ltd., 1999). However, since C content and bulk density in the upper 5 cm layer varied among the treatments, soil moisture was used to indicate differences between dates within treatments, rather than among the treatments.
At each plot in May 2009, four collars were inserted into the surface of the soil to approximately 1 cm depth, in order to keep them steady and ensure airtight, close contact with the ground. The height of the collars placed in the soil ranged from 5 to 10 cm. They were left to rest in the ground for five days before the first measurement and were then left in situ during the entire study period. Before further analysis, Rs measurements were corrected for differences in the chamber volumes due to the variation in collar height. All measurements were carried out between 09.00 and 15.00 throughout the snow-free seasons in 2009–2010. To avoid differences in Rs due to diurnal variation, measurements within a block were performed within an hour. Field vegetation was absent or negligible during the first year following the disturbance, but grass (mainly Deschampsia flexuosa) started to grow on all of the plots (sparsely, to heights up to ca. 10 cm) towards the end of the second year in plots subjected to all treatments except EMS (in which no field vegetation was detected).
2.3 Mass loss rates of needle litter and coarse roots
The decomposition rates of brown needle litter and fresh roots from Scots pine were studied using the litterbag technique, according to Johansson (1994b). Needle litter was sampled from trees in a nearby forest stand (Jädraås, 15 km from the site) during the annual litter fall in the autumn of 2006. The brown needles were collected by placing a tarpaulin on the ground and gently shaking branches of the trees. The needles were then sorted, and only intact needles with no visible signs of fungal infection were selected for use in the decomposition experiment. The Scots pine roots were collected in spring 2009, from a forest close to Uppsala (59°49´N, 17°40´E), 140 km southeast of the site, by digging down to the root system and cutting pieces of roots that were approximately 6–7 cm long and 6 mm in diameter. The needles and roots were dried at room temperature to moisture contents of 5.7 ± 0.5% and 9.8 ± 0.5% (mean and standard error, n = 10), respectively. The dry masses of the needle and root samples were determined by drying sub-samples at 85 °C for 48 hours then weighing.
Approximately 1.5 g samples of needles or roots were enclosed in 11 × 13 cm litterbags made of terylene netting with a 1 × 1 mm mesh. The exact weight of each sample, in grams to four decimal places, was noted on a plastic strip that was also enclosed in the bag. The litterbags were placed in the field on June 16, 2009, directly after the treatments were applied to the plots. At each plot, five sets of litterbags, each consisting of five needle and six root litterbags, were laid out. In the CON plots needle litter was placed on the soil surface, while root litter was inserted at 5 cm depth. In the other plots the litterbags were placed in positions where the site preparation treatment was presumed to move any root and needle litter: on the surface of EMS plots, between the two humus layers of DHL plots, and in the mixed layer of MIX plots (Fig. 1, Table 3). The litterbags placed on the soil surface were fastened to the ground with 5 cm long metal pins at the start of the experiment, while twine was attached to those buried in the soil to facilitate resampling.
One set of litterbags was collected from each plot every spring (May) and autumn (September–October), during the 2009–2011 measurement periods, and the last set of root litterbags was collected in October 2012. Thus, there were five and six collections of needle and root litterbags, respectively. At the time of the last collection, as several years had passed since their placement some of the litterbags could not be found, but at least three litterbags were collected from each plot. The litterbags were transported directly to the laboratory (a 2 h drive), and stored in a freezer (–18 °C) until preparation for analysis, when they were cleaned of soil particles, moss, lichen, grass, and dwarf shrubs. The dry weight of the sample from each retrieved bag was determined after drying for 48 hours at 85 °C.
2.4 Analysis of C, N, and 15N
The replicated litter samples collected on each occasion were pooled to obtain a composite needle sample and a composite root sample for each plot. These samples were subsequently ground and their C contents were analyzed following Ohlsson and Wallmark (1999), using a DeltaV Isotope ratio Mass Spectrometer coupled to a Flash 2000 elemental analyzer (both supplied by Thermo Fisher Scientific). Measured concentrations of C and N were converted to contents using appropriate mass factors, and residual amounts at each collection time were compared to initial amounts. δ15N (the difference in ratio of the rare stable isotope 15N to that of 14N in a sample and the atmosphere) was also calculated and expressed in parts per thousand (Robinson 2001).
2.5 Calculations and statistical analyses
Treatment effects on the Rs and rates of C and N losses were tested by two-factor analysis of variance (ANOVA), including treatment, sampling date and treatment × date interaction as fixed factors. The block, and interaction among block, treatment and collar, were included as random effects. The procedure “Proc mixed” in SAS Statistical software (V9.3, SAS Institute, Cary, NC, USA) was used to fit the model. All the response variables except Rs met the normal distribution and homogeneity of variance requirements for ANOVA, for all groups, and the Rs values met the criteria following log transformation, using date as a repeated measurement, and a spatial power covariance structure. The model was run using data for each year separately and for all years together. If a fixed effect was significant, a paired t-test adjusted for multiple comparisons, according to Tukey-Kramer’s method, was used to identify the differences among treatments. A difference was considered significant if p ≤ 0.05. No time-related differences among treatments were tested.
ANOVA was also used to test for the presence of any treatment effects on the temperature sensitivity of Rs and basal respiration (Rs at 0°C), using the same procedure as above (following log transformation of the Rs data), but with treatment, soil temperature, and treatment × soil temperature interaction as fixed effects.
3 Results
3.1 Treatment effect on Soil-surface CO2 fluxes (Rs), soil temperature and moisture
The average Rs before the treatments was 0.35 g CO2 m–2 h–1 (SE = ±0.02, n = 16), and there were no significant differences in this respect between sets of plots assigned to different treatments (Table 2). After treatment, the fluxes from EMS plots decreased to one third of those from CON plots (Fig. 2, Table 2) and were significantly lower than fluxes recorded from all other plots during the entire measurement period. The Rs from the DHL plots varied substantially during 2009 (Table 2), ranging from values as low as those recorded from EMS plots on some dates (0.1 g CO2 m–2 h–1) to values higher than those recorded from any other plots (1.4 g CO2 m–2 h–1). Significant differences were observed between Rs values recorded from DHL and CON plots on a few dates in 2009, but due to the large variation in DHL plots’ Rs values, there were no significant overall differences between them. In contrast, in 2010 fluxes from the DHL plots had stabilized at the same level as those observed from the CON plots.
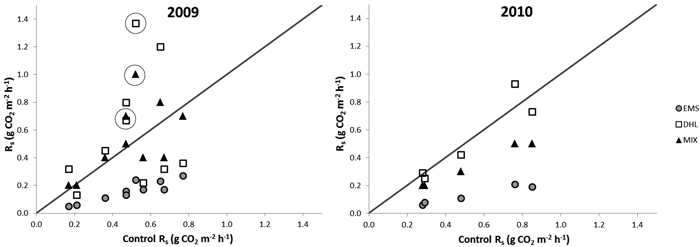
Fig. 2. Soil-surface CO2 fluxes (Rs) from exposed mineral soil (EMS), double humus layer (DHL), and mixed soil (MIX) plots (Y-axis) versus fluxes from control plots (X-axis) in 2009 and 2010. Points above the diagonals show fluxes that were higher than controls. The circles mark fluxes recorded on the first two occasions (within 2 weeks) after the MIX and DHL treatments, which indicate a possible initial increase in Rs.
| Table 2. Mean and standard error (SE) of soil-surface CO2 fluxes (Rs, g CO2 m–2 h–1), soil temperatures at 0–10 cm depth and soil moisture contents at 0–5 cm depth recorded in the control (CON), exposed mineral soil (EMS), double humus layer (DHL) and mixed soil (MIX) plots at Åmot at indicated dates. Differences in the letters a, b, and c denote significant between-treatment differences in the Rs and soil temperature values (p ≤ 0.05) at corresponding dates. As the measurements pertaining to the first date (2009-06-10) were acquired before the soil was treated (2009-06-16) they are not included in the means for 2009. Missing values are denoted m.v. View in new window/tab. |
Initially, fluxes from the MIX plots were higher than those from controls, but after a month they were not generally significantly different from control fluxes (Fig. 2, Table 2). In addition, there were some dips in their Rs values during the first year, which coincided with the dips detected in the DHL plots. In the second year MIX plots had significantly lower Rs values than CON plots (Fig. 2, Table 2).
The overall mean Rs in 2009 from EMS plots was only a quarter of the Rs from the other plots, while the mean Rs values for the CON, MIX, and DHL plots were similar, despite the large temporal variation in fluxes from the DHL and MIX plots (Table 2). In the second year, EMS plots continued to have the lowest fluxes, while fluxes from CON and DHL plots were similar (Table 2). However, fluxes from MIX plots decreased by 25%, and were lower than those from DHL and CON plots.
During the measuring periods, soil temperature (at 10 cm depth) varied between 4 °C and 17 °C (Fig. 3, Table 2). There were significant among-treatment differences in temperature in 2009, the highest temperatures being recorded in the DHL plots, followed by the MIX plots (Table 2). Temperatures were higher in the EMS plots than in the CON plots in the warmest month, but lower during the coldest month. In 2010, the temperature was higher in the DHL plots than in plots subjected to the other treatments. Although there were significant among-treatment differences in soil temperature, they were relatively small, around 0.5–1 °C (Table 2).
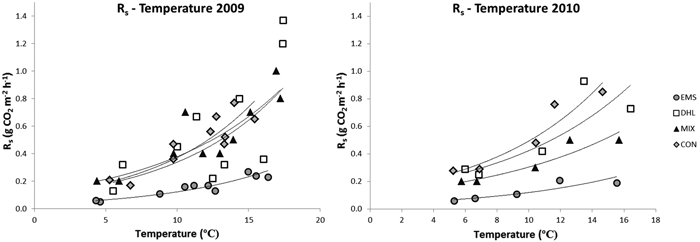
Fig. 3. Correlations between soil-surface CO2 fluxes (Rs) and soil temperatures in the control (CON), exposed mineral soil (EMS), double humus layer (DHL), and mixed soil (MIX) plots in 2009 and 2010. The curves represent the exponential trend lines, with the following regression coefficients (R2). Curves in the left figure (2009): CON; Rs = 0.09e0.14T (R2 = 0.8), DHL; 0.09e0.13T (R2 = 0.5), MIX; Rs = 0.1e0.11T (R2 = 0.8), EMS; Rs = 0.03e0.13T (R2 = 0.9). Curves in the right figure (2010): CON; Rs = 0.13e0.13T (R2 = 0.9), DHL; 0.13e0.12T (R2 = 0.8), MIX; Rs = 0.10e0.11T (R2 = 0.9), EMS; Rs = 0.04e0.12T (R2 = 0.9).
Soil moisture varied among dates, with similar patterns (including the maxima and minima occurring on the same dates) following all treatments (Table 2). The soil moisture content in the CON plots varied between 9 and 21% (v/v) throughout the measuring periods.
Soil temperature was a significant fixed effect for log Rs (p < 0.001), but not treatment (Fig. 3), implying that temperature significantly influences Rs. There were also no significant between-treatment differences in this respect, indicating that all treatments resulted in the same basal respiration (Rs at 0°C). However, the interaction between temperature and treatment was a significant fixed effect (p < 0.001), implying that the temperature sensitivity of Rs differed among treatments (Fig. 3). The temperature sensitivity was lower in EMS plots than in other plots in both years. There were no differences in Rs temperature sensitivity among CON, DHL and MIX plots in 2009 (Fig. 3). However, in 2010, the temperature sensitivity of Rs was significantly higher in CON and DHL plots than in MIX plots.
3.2 C losses in needle and root litter
After 28 months incubation, C losses from the needle litter were highest in the DHL plots followed by the MIX, CON and EMS plots (76, 66, 58 and 52% losses of initial contents, respectively; Fig. 4, Table 3). Thus, needle litter buried in the soil (in DHL and MIX plots) decomposed more rapidly than samples incubated on top of the soil (in CON and EMS plots). The C losses from the needles were also slower during the winter periods than during summer (see the changes from 4–12 and 16–24 months in Fig. 4). Between the 16th and 24th month following the treatments (winter 2010–2011), the C loss was close to zero in all except DHL plots, where a 7% loss was observed (Fig. 4, Table 3).
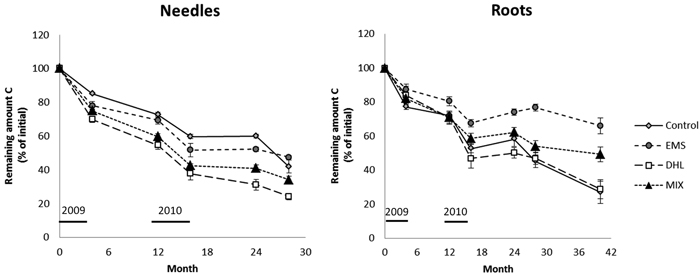
Fig. 4. Decomposition, expressed as the proportion (%) of C remaining in the needle and root litter incubated in control (CON), exposed mineral soil (EMS), double humus layer (DHL), and mixed soil (MIX) plots. The initial C content in the needle and roots was 55%. Incubation started in June 2009 (month 0), so January is represented by months 7, 19, and 31. The black bars just above the X-axis indicate the time-periods when soil-surface CO2 flux (Rs) measurements were acquired. Errors bars show standard errors.
| Table 3. Differences in remaining amounts of C, N and δ15N in the needle and root litter between plots subjected to the control (CON), exposed mineral soil (EMS), double humus layer (DHL), and mixed soil (MIX) treatments. Differences in the letters a, b, c denote significant between-treatment differences (p ≤ 0.05) in indicated months. For averages and standard error, see Fig. 4–6. | |||||||||
| Month since incubation | Needles | Roots | |||||||
| CON | EMS | DHL | MIX | CON | EMS | DHL | MIX | ||
| Remaining C | 4 | a | ab | b | b | a | a | a | a |
| 12 | a | ab | c | bc | a | a | a | a | |
| 16 | a | ab | c | bc | ab | b | a | ab | |
| 24 | a | a | b | b | ab | b | a | ab | |
| 28 | a | a | b | ab | a | b | a | a | |
| 40 | a | b | a | ab | |||||
| Remaining N | 4 | a | a | b | a | a | a | a | a |
| 12 | a | a | b | a | a | a | a | a | |
| 16 | a | a | b | ab | a | a | a | a | |
| 24 | ab | a | a | a | a | a | a | a | |
| 28 | a | a | a | a | a | a | a | a | |
| 40 | a | b | ab | ab | |||||
| δ15N | 4 | a | b | ab | b | a | a | a | a |
| 12 | a | b | b | b | a | a | a | a | |
| 16 | a | ab | b | b | a | a | a | a | |
| 24 | a | b | b | b | a | a | a | a | |
| 28 | a | b | b | b | a | ab | b | ab | |
| 40 | a | a | a | a | |||||
The roots decomposed slightly slower than the needles. After 28 months, the buried root litter samples in the CON, DHL, and MIX plots had lost about 50% of their initial amounts of C (Fig. 4, Table 3), while needles had lost 63% on average. In EMS plots (where root samples were placed on top of the soil), the C losses were significantly lower (23% after 28 months) than in other plots. The root litter was incubated for a longer time than the needle litter, and finally (after 40 months) it had lost ca. 70, 70, 51 and 34% of its initial C contents in the CON, DHL, MIX and EMS plots, respectively (Fig. 4, Table 3). The seasonal effect was also much more pronounced for the root than the needle litter. Small or negligible root C losses were noted during the winter periods (see the changes from 4–12 and 16–24 months in Fig. 4). In plots subjected to all treatments, a slight increase in C was observed during the second winter (16–24 months) and C contents continued to rise in EMS plots until the 28th month (Fig. 4, Table 3).
3.3 N losses in needle and root litter
After incubation for a year the N content in the needle litter had increased in plots subjected to all treatments. The N gain was highest in the DHL plots, followed by MIX, CON and EMS plots (100, 50, 20 and 7% increases, respectively; Fig. 5, Table 3). However, the increases did not significantly differ between CON plots and either MIX or EMS plots. After a rapid initial increase in the N content of the needles in DHL and MIX plots, the amount of N in the needle litter peaked after 12 months, then started to decline. The N content peaked a year later (after 24 months) in the EMS and CON plots. At the end of the study period (28 months), the remaining amount of N in the needle litter did not significantly differ between treatments (varying between 102 and 124% of the initial content; Fig. 5, Table 3). The remaining amount of N showed a seasonal pattern, generally increasing during the winter months and decreasing during the summer. However, exceptions to this pattern were observed during the first summer, when it increased in the DHL and MIX plots, and in the second summer period, when it continued to increase in the CON plots (Fig. 5, Table 3).
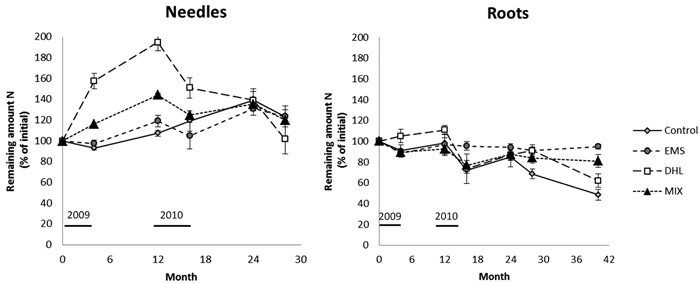
Fig. 5. Decomposition expressed as the remaining N amount in the needle and root litter for the control (CON), exposed mineral soil (EMS), double humus layer (DHL), and mixed soil (MIX) treatments. The initial N content in the needle and roots was 0.47% and 0.37%, respectively. Incubation started in June 2009 (month 0), and January is represented by month 7, 19, and 31. Black lines represents the time-period when soil-surface CO2 flux (Rs) measurements were conducted. Bars denote the size of standard errors.
There were few significant differences in the remaining amount of N in the root litter between treatments during the four years (Fig. 5, Table 3). However, it was higher in DHL plots than in plots subjected to the other treatments in the first year, and higher in these plots than in CON and EMS plots after 16 months. The remaining amount of N in the root litter generally showed a seasonal pattern following all the treatments, increasing during the winter and declining during the summer months. However, again there were exceptions, including an increase in DHL plots in the first summer, and the amount remaining the same as in the previous period in EMS plots in the second winter. The amount of N in the root litter exceeded the initial content only in DHL plots, and only during the first year in these plots (Fig. 5, Table 3).
3.4 Treatment effect on δ15N
The measured δ15N abundance of needle litter in CON plots ranged from –5 to –4.4‰ during the entire incubation period, and was generally significantly higher in plots subjected to all three disturbance treatments (Fig. 6, Table 3). The δ15N abundance in the needle litter incubated in the EMS, DHL and MIX plots increased rapidly in the first year, from –4.7‰ to values between –3.0 and –3.4‰ and remained at this level thereafter.
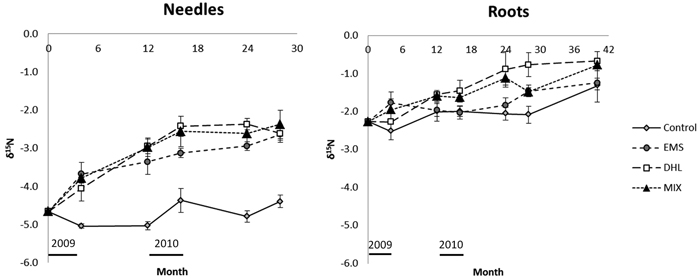
Fig. 6. Changes with time of δ15N in the needle and root litter incubated in control (CON), exposed mineral soil (EMS), double humus layer (DHL), and mixed soil (MIX) plots. Incubation started in June 2009 (month 0), so January is represented by months 7, 19, and 31. The black bars just above the X-axis indicate the time-periods when soil-surface CO2 flux (Rs) measurements were acquired. Error bars show standard errors.
The initial δ15N abundance in root litter (–2.3‰) was significantly higher than the initial needle litter abundance (–4.7‰; Fig. 6, Table 3). There were no significant between-treatment differences in this variable, except after 28 months when the abundance was significantly higher in root litter incubated in DHL plots than in the root litter incubated in CON plots. There was a general increase in δ15N abundance in root litter over time, which partly coincided with the increase in N content. After 40 months incubation, the δ15N in root litter had increased to around –1.3‰ in the CON and EMS plots, and greater increases were noted in the DHL and MIX plots (with δ15N reaching around –0.8‰).
4 Discussion
4.1 Soil-surface CO2 fluxes (Rs) and litter decomposition
The Rs values we recorded are very similar to previously recorded fluxes (0.4–0.6 g CO2 m–2 h–1) in clear-cuts in boreal forests during the warmest months, June–August (Pumpanen et al. 2004b; Strömgren and Mjöfors 2012; Strömgren et al. 2012; Uri et al. 2015). Since our study was conducted at a clear-cut site, with no standing biomass and no field layer – and autotrophic respiration ceases within two weeks to two months after girdling of trees (Högberg et al. 2001; Olsson et al. 2005) – autotrophic respiration can be assumed to have been very low or negligible.
The decomposition rate of the pine needle litter in the CON plots (33% during the first year, Fig. 4) is also consistent with rates recorded in other clear-cuts (Johansson 1994b; Prescott et al. 2000; Palviainen et al. 2004), and the loss of root mass loss in the first year (ca. 30%, Fig. 4) is consistent with recorded losses in other boreal forest stands (Berg 1984; Berg et al. 1998; Silver and Miya 2001). It should be noted that we used somewhat coarser roots (6 mm diameter) than previous researchers, Berg et al. (1998) for example (2–3 mm diameter). This may be a significant factor as roots with diameters > 5 mm reportedly decay more slowly than thinner roots (Silver and Miya 2001). Possible reasons for their slower decomposition include a relatively long time-lag before fresh, coarse wood (such as roots) is colonized by decomposers (Harmon et al. 1986; Hyvönen and Ågren 2001), slower leaching rates of water-soluble compounds (Fahey et al. 1988) and higher proportions of recalcitrant material (Berg 2000).
4.2 Does the amount of SOC affect Rs?
Our hypothesis that Rs is related to the amount of SOC was only partly confirmed. Removing the organic layer (in the EMS treatment) resulted in lower Rs values than the other treatments, in accordance with the hypothesis. However, there was no support for the related expectation that the DHL treatment would result in higher fluxes, due to the formation of a double layer of organic matter. The fluxes recorded from the EMS plots were about 75% lower than those recorded from the CON plots, implying that 75% of the fluxes from the CON plots originated from the 5 cm humus layer and the top 2 cm of mineral soil just beneath it. This percentage is lower (but similar) to the proportion of respiration (91–92%) that the top 10 cm of soil accounts for according to Pietikäinen et al. (1999). As noted, fluxes were expected to be higher from the DHL plots, since they contained more organic material to decompose. However, during the first year, the Rs from DHL plots varied from being markedly higher than from CON plots to sometimes being exceptionally low (when the moisture content was high). Thus, a possible reason for the occasionally very low fluxes from DHL plots is that high moisture levels in layers containing much of the organic matter may have suppressed decomposition and/or gas fluxes (although the moisture content measured at the top of the soil surface was not extremely high). Similarly, occasionally low values have been recorded in other site preparation studies (Mallik and Hu 1997; Pumpanen et al. 2004b), and attributed to low soil moisture contents. Another contributory factor is that micro-environments around most of the organic matter in DHL plots may have been cooler than micro-environments of litter situated on top, as in CON plots.
4.3 Does soil mixing increase decomposition and Rs?
We also hypothesized that soil disturbance would lead to higher decomposition rates and hence higher Rs. The hypothesis is apparently supported by the finding that needle litter decomposed faster in the DHL and MIX plots than in the CON plots. However, these differences could also have been due to the litter placement, as buried needle litter (in the DHL and MIX plots) decomposed more rapidly than samples incubated on the soil surface (in the CON and EMS plots) (see section 4.5). Furthermore, root litter decomposition rates in DHL and MIX plots were similar to those in CON plots. The lack of response to the treatments in these cases could have been due to root litter generally being buried in the soil (and hence not moved in DHL and MIX treatments). Thus, the biggest change caused by our site preparation treatments was the movement of root litter to the surface (where root decomposition is significantly lower) in the EMS treatment. The hypothesis that soil disturbance would increase decomposition rates is further contradicted by results from the root litter decomposition experiment, as there were no significant differences in decomposition rates among CON, DHL and MIX plots (in all of which litter was buried).
If the hypothesis that soil disturbance increases Rs is valid, fluxes from the MIX plots should have exceeded those from the CON plots, and the arithmetic average of fluxes from EMS and DHL plots should have exceeded those from CON plots. However, while we observed an initial increase in the Rs in MIX plots (Table 2, Fig. 2), the effect had disappeared after a month, and in the second year fluxes from the MIX plots were even lower than those from CON plots, and lower than the average fluxes from EMS and DHL plots during both years. Furthermore, the Rs measurements showed that soil disturbances decreased, rather than increased, fluxes in the long term. Although the reason for this phenomenon could not be established, a possible explanation is that mixing moves organic matter to deeper, cooler horizons thereby decreasing decomposition rates. Another possibility is that soil disturbance induces an increase in fluxes, but it is only temporary. Mixing of the soil destroys mycelia of soil fungi. The destroyed mycelium, in addition to other easily decomposable material made available by mixing, becomes a substrate for opportunistic saprotrophs, which can respond to a change rather quickly (Lindahl et al. 2010). However, in the long run the mixing of organic material with much less C-rich layers (as in the MIX but not DHL treatment) may disfavor decomposers, which are adapted to conditions in the organic top layer of the soil. This provides a possible explanation for the leveling of the decomposition rate in the long term (from the second year). Similar temporal trends in soil-surface Rs after stump harvest have been observed by Strömgren et al. (2012) and Uri et al. (2015).
Intriguingly, results from the decomposition study showed that root decomposition was insensitive to soil mixing. This is consistent with Rs values from the MIX plots during the first year, but conflicts with values recorded in the second year. A possible explanation for the difference in results between the methods is that the in situ measurements of Rs included emissions resulting from decomposition of the total SOC stock, while the litterbag study only followed the decomposition of a specific relatively young type of litter. Since litter becomes increasingly recalcitrant with time (Berg 2000) and the estimated average age of the humus layer in Scandinavian forest soils is 40 years (Fröberg et al. 2011b), the soil profile probably contained a higher proportion of older, recalcitrant soil organic matter than the litterbags and hence may have responded differently to the soil mixing treatment. Most C loss from soil results from heterotrophic respiration, but it should be noted that C can also be leached out of the system as dissolved organic matter (Fröberg et al. 2011a), and account for a small proportion (1–2%) of the fluxes.
4.4 Implications for site preparation and stump harvest
To test our overall hypothesis, that site preparation increases decomposition rates and soil-surface CO2 fluxes, it is necessary to consider the total, area-weighted effects of common site preparation methods, such as harrowing or patch scarification, on C emissions. We estimated these emissions by scaling up mean fluxes from the plots subjected to each of the treatments applied in this study, with weightings based on proportional areas of each type of soil disturbance typically observed following patch scarification and harrowing. Areal proportions of undisturbed (CON type) surface, and EMS-, DHL- and MIX- type disturbance were assumed to be 50, 20, 20, and 10% following harrowing, and 75, 12.5, 12.5 and 0% following patch scarification, based on previous observations of treated clear-cuts in Sweden (Strömgren and Mjöfors 2012; Strömgren et al. 2012). According to these estimates, patch scarification would have reduced C emissions by 7 and 10% in the first and second years, respectively, while harrowing would have reduced them by 11 and 17%, respectively. Stump harvest is more intrusive than ordinary site preparation, disturbing about 75% of the soil surface, mostly by mixing. Assuming that 75 and 25% of the soil surface after stump harvest would be comparable to the surfaces created by the MIX and CON treatments, respectively, stump harvest would have increased C emissions by 3% in the first year, and decreased them by ca. 30% in the second year (relative to emissions arising with no site preparation). These estimates suggest that stump harvest results in negligible increases in C emissions, relative to no site preparation during the first year, and emissions of the same magnitude or even lower than those generated by harrowing in the second year. Reductions in Rs following site preparation or stump harvest have also been observed by Strömgren and Mjöfors (2012) and Strömgren et al. (2012) at sites with other soil types and climatic conditions in Sweden.
4.5 The location of litter affects its decomposition
The results from our needle and root litter C loss studies indicate that between-treatment differences in decomposition rates are largely due to associated differences in litter positions. Litter in bags placed on the soil surface (needles and roots in EMS plots, and needles but not roots in CON plots) decomposed more slowly than litter buried in the soil (in DHL and MIX plots, and roots, but not needles, in CON plots). This can be explained by the protection from extreme conditions (e.g. aridity and/or extreme temperatures) that burial provides. The findings suggest that site preparation methods that move organic material from the soil-surface to deeper layers in the soil profile promote higher losses of litter C, at least during the first subsequent years. Accordingly, first year mass losses of Scots pine needle litter are reportedly related to climatic factors (Fox and Cleve 1983; Berg et al. 1993; Johansson 1994a; Johansson et al. 1995). Moreover, several studies have shown that litter decomposes more slowly on clear-felled sites than in closed forest (Prescott et al. 2000; Palviainen et al. 2004). Thus, the slower decomposition of litter on the surface in the EMS plots (needles and roots) and CON plots (only needles), can be explained by the relatively unfavorable conditions arising from the greater exposure to wind and sunlight (Prescott et al. 2000).
4.6 Net N uptake in litter
In early litter decomposition stages N is transported into litter from external sources via processes that have evolved under pressures for decomposers to meet their N requirements (Staaf and Berg 1982). Evidence of these processes was clearly seen in our needle litter study, as the amount of N in the litter increased substantially, especially in the first year. The N content continued to increase during the first winter, suggesting that the decomposer fungi remained active even under snow cover. In addition, the C content of the root litter increased during the second winter, indicating that ingrowth of fungi had occurred.
The δ15N abundance in needle litter was similar in plots subjected to all soil disturbance treatments (EMS, DHL, MIX), despite differences in N concentrations (Table 3), but significantly lower in the CON plots. This suggests that the litter in the disturbed plots received more N from a source with higher δ15N abundance. Since the natural abundance of δ15N increases with soil depth, being lowest in the organic layer and highest in the mineral soil (Högberg et al. 1996; Hobbie and Högberg 2012), the litter in the disturbed plots presumably received more N from the mineral soil, either through the direct contact between litter and mineral soil (in EMS and MIX plots) or via transport by decomposers from mineral soil.
4.7 Conflicting results from a common view
Our findings conflict with conclusions in most previous reviews that site preparation generally induces increases in CO2 emissions from soils and hence reduces SOC stocks (e.g., reviews by Johnson 1992; de Wit and Kvindesland 1999; Freeman et al. 2005; Jandl et al. 2007). However, the cited reviews had broader scopes, covering (inter alia) wider ranges of forest management practices. Moreover, the conclusions on effects of site preparation on soil C stocks are based on results of a few studies at sites scattered around the world. In addition, conclusions regarding effects of site preparation on decomposition in these reviews are mainly based on litterbag studies of needle litter (e.g., Johansson 1994b; Lundmark-Thelin and Johansson 1997), in which the degradation of fresh organic matter was monitored during the first years in plots subjected to various disturbances. However, our integrated study of CO2 fluxes from the soil surface and the decomposition of both young needle and root litter pools shows that there are complexities that cannot be captured solely by examining the decomposition of a specific SOC cohort in the first years following disturbances.
5 Conclusions
We conclude that soil disturbance, such as that following site preparation, can reduce soil-surface CO2 fluxes. Even if it may initially increase soil-surface CO2 fluxes, this effect is transient and limited to the first few weeks. Our results also indicate that the location of the incubated litter is the main determinant of decomposition rates, as litter decomposed more rapidly in buried bags than in those placed on top of the soil. Mixing of the soil will move litter cohorts to new locations in the soil horizon, bringing some to the surface and burying others deeper in the profile. Our results suggest that although burying litter favours decomposition, it does not necessarily lead to higher C emissions from the entire soil profile.
Acknowledgment
The study was part of the research program “Tree-stump harvesting and its environmental consequences” at the Swedish University of Agricultural Sciences with grants from the Swedish Energy Agency, the NL Faculty at the Swedish University of Agricultural Sciences, Formas strong research environment IMPRESS, and a consortium of forest companies. We would like to thank Stora Enso for endowing land for the experiment and supporting with stand history. We would also like to thank Claudia von Brömmsen for her advice and helpful suggestions regarding statistical analysis and “Jädraås Skog och Mark” for help with cleaning the litterbags.
References
Ahti T., Hämet-Ahti L., Jalas J. (1968). Vegetation zones and their sections in northwestern Europe.
Bäcke J., Larsson M., Lundmark J.-E., Örlander G. (1986). Site adapted scarification - a theoretical analysis of some scarification principles. Redogörelse nr 3. Forskningsstiftelsen Skogsarbeten, Uppsala, Sweden. 48 p. [In Swedish with English summary].
Balisky A.C., Burton P. (1997). Planted conifer seedling growth under two soil thermal regimes in high-elevation forest openings in interior British Columbia. New Forests 14(1): 63–82. http://dx.doi.org/10.1023/A:1006592705104.
Berg B. (1984). Decomposition of root litter and some factors regulating the process: long-term root litter decomposition in a Scots pine forest. Soil Biology and Biochemistry 16(6): 609–617. http://dx.doi.org/10.1016/0038-0717(84)90081-6.
Berg B. (2000). Litter decomposition and organic matter turnover in northern forest soils. Forest Ecology Management 133(1–2): 13–22. http://dx.doi.org/10.1016/S0378-1127(99)00294-7.
Berg B., Laskowski R. (2005). Nitrogen dynamics in decomposing litter. In: Björn B., Ryszard L. (eds.). Advances in ecological research 38(157–183). Academic Press. http://dx.doi.org/10.1016/s0065-2504(05)38005-6.
Berg B., Matzner E. (1997). Effect of N deposition on decomposition of plant litter and soil organic matter in forest systems. Environmental Reviews 5(1): 1–25. http://dx.doi.org/10.1139/a96-017.
Berg B., Berg M.P., Bottner P., Box E., Breymeyer A., Ca de Anta R., Couteaux M., Escudero A., Gallardo A., Kratz W., Madeira M., Mälkönen E., McClaugherty C., Meentemeyer V., Muñoz F., Piussi P., Remacle J., Vi de Santo A. (1993). Litter mass-loss rates in pine forests of Europe and Eastern United States: some relationships with climate and litter quality. Biogeochemistry 20(3): 127–159. http://dx.doi.org/10.1007/BF00000785.
Berg B., Johansson M.B., Meentemeyer V., Kratz W. (1998). Decomposition of tree root litter in a climatic transect of coniferous forests in northern Europe: a synthesis. Scandinavian Journal of Forest Research 13(4): 402–412. http://dx.doi.org/10.1080/02827589809383000.
Burton P., Bedford L., Goldstein M., Osberg M. (2000). Effects of disk trench orientation and planting spot position on the ten-year performance of lodgepole pine. New Forests 20(1): 23–44. http://dx.doi.org/10.1023/A:1006796412006.
de Wit H.A., Kvindesland S. (1999). Carbon stocks in Norwegian forest soils and effects of forest management on carbon storage. Rapport fra skogsforskningen - Supplement 14. Norsk institutt for skogforskning. 52 p. ISBN 82-7169-922-9. [In English].
Elliott J., Toth B., Granger R., Pomeroy J. (1998). Soil moisture storage in mature and replanted sub-humid boreal forest stands. Canadian Journal of Soil Science 78(1): 17–27. http://dx.doi.org/10.4141/S97-021.
Fahey T.J., Hughes J.W., Pu M., Arthur M.A. (1988). Root decomposition and nutrient flux following whole-tree harvest of northern hardwood forest. Forest Science 34(3): 744–768.
Fox J.F., Cleve K.V. (1983). Relationships between cellulose decomposition, Jenny’s k, forest-floor nitrogen, and soil temperature in Alaskan taiga forests. Canadian Journal of Forest Research 13(5): 789–794. http://dx.doi.org/10.1139/x83-109.
Freeman M., Morèn A.S., Strömgren M., Linder S. (2005). Climate change impacts on forest in Europe: biological impact mechanisms. In: Kellomäki S., Leinonen S. (eds.). Management of European forests under changing climatic conditions. Research Notes 163. University of Joensuu. p. 46–115. ISBN 952-458-652-5.
Fröberg M., Hansson K., Kleja D.B., Alavi G. (2011a). Dissolved organic carbon and nitrogen leaching from Scots pine, Norway spruce and silver birch stands in southern Sweden. Forest Ecology Management 262(9): 1742–1747. http://dx.doi.org/10.1016/j.foreco.2011.07.033.
Fröberg M., Tipping E., Stendahl J., Clarke N., Bryant C. (2011b). Mean residence time of O horizon carbon along a climatic gradient in Scandinavia estimated by 14C measurements of archived soils. Biogeochemistry 104(1–3): 227–236. http://dx.doi.org/10.1007/s10533-010-9497-3.
Goodale C.L., Apps M.J., Birdsey R.A., Field C.B., Heath L.S., Houghton R.A., Jenkins J.C., Kohlmaier G.H., Kurz W., Liu S., Nabuurs G.-J., Nilsson S., Shvidenko A.Z. (2002). Forest carbon sinks in the Northern Hemisphere. Ecol Appl 12(3): 891–899. http://dx.doi.org/10.1890/1051-0761(2002)012[0891:FCSITN]2.0.CO;2.
Harmon M.E., Franklin J.F., Swanson F.J., Sollins P., Gregory S.V., Lattin J.D., Anderson N.H., Cline S.P., Aumen N.G., Sedell J.R., Lienkaemper G.W., Cromack Jr. K., Cummins K.W. (1986). Ecology of coarse woody debris in temperate ecosystems. Advances in Ecological Research 15: 133–302. http://dx.doi.org/10.1016/S0065-2504(08)60121-X.
Hobbie E.A., Högberg P. (2012). Nitrogen isotopes link mycorrhizal fungi and plants to nitrogen dynamics. New Phytologist 196(2): 367–382. http://dx.doi.org/10.1111/j.1469-8137.2012.04300.x.
Högberg P., Högbom L., Schinkel H., Högberg M., Johannisson C., Wallmark H. (1996). 15N abundance of surface soils, roots and mycorrhizas in profiles of European forest soils. Oecologia 108(2): 207–214. http://dx.doi.org/10.1007/BF00334643.
Högberg P., Nordgren A., Buchmann N., Taylor A.F.S., Ekblad A., Högberg M.N., Nyberg G., Ottosson-Löfvenius M., Read D.J. (2001). Large-scale forest girdling shows that current photosynthesis drives soil respiration. Nature 411: 789–792. http://dx.doi.org/10.1038/35081058.
Holdridge L.R. (1947). Determination of world plant formations from simple climatic data. Science 105(2727): 367–368. http://dx.doi.org/10.1126/science.105.2727.367.
Hyvönen R., Ågren G.I. (2001). Decomposer invasion rate, decomposer growth rate, and substrate chemical quality: how they influence soil organic matter turnover. Canadian Journal Forest Research 31(9): 1594–1601. http://dx.doi.org/10.1139/x01-097.
IUSS Working Group WRB (2007). World reference base for soil resources 2006, first update 2007. World Soil Resources Reports No. 103, FAO, Rome. On-line version, 2007. http://www.fao.org/fileadmin/templates/nr/images/resources/pdf_documents/wrb2007_red.pdf.
Jandl R., Lindner M., Vesterdal L., Bauwens B., Baritz R., Hagedorn F., Johnson D.W., Minkkinen K., Byrne K.A. (2007). How strongly can forest management influence soil carbon sequestration? Geoderma 137(3–4): 253–268. http://dx.doi.org/10.1016/j.geoderma.2006.09.003.
Janssens I.A., Dieleman W., Luyssaert S., Subke J.-A., Reichstein M., Ceulemans R., Ciais P., Dolman A.J., Grace J., Matteucci G., Papale D., Piao S.L., Schulze E.-D., Tang J., Law B.E. (2010). Reduction of forest soil respiration in response to nitrogen deposition. Nature Geoscience 3: 315–322. http://dx.doi.org/10.1038/ngeo844.
Johansson M.B. (1994a). Decomposition rates of Scots pine needle litter related to site properties, litter quality, and climate. Canadian Journal Forest Research 24(9): 1771–1781. http://dx.doi.org/10.1139/x94-229.
Johansson M.B. (1994b). The influence of soil scarification on the turn-over rate of slash needles and nutrient release. Scandinavian Journal of Forest Research 9(2): 170–179. http://dx.doi.org/10.1080/02827589409382828.
Johansson M.B., Berg B., Meentemeyer V. (1995). Litter mass-loss rates in late stages of decomposition in a climatic transect of pine forests - long-term decomposition in a Scots pine forest. Canadian Journal of Botany 73(10): 1509–1521. http://dx.doi.org/10.1139/b95-163.
Johnson D.W. (1992). Effects of forest management on soil carbon storage. Water Air and Soil Pollution 64(1–2): 83–120. http://dx.doi.org/10.1007/BF00477097.
Kataja-Aho S., Saari E., Fritze H., Haimi J. (2011). Effects of stump removal on soil decomposer communities in undisturbed patches of the forest floor. Scandinavian Journal of Forest Research 26(3): 221–231. http://dx.doi.org/10.1080/02827581.2011.560183.
Köppen W. 1936. Das geographische System der Klimate. In: Köppen W., Geiger R. (eds.). Handbuch der Klimatologie. Verlag von Gebrüder Borntraeger, Berlin. 44 p.
Kubin E., Kemppainen L. (1994). Effect of soil preparation of boreal spruce forest on air and soil temperature conditions in forest regeneration areas. Acta forestalia Fennica. ISSN 0001-5636.
Lindahl B.D., de Boer W., Finlay R.D. (2010). Disruption of root carbon transport into forest humus stimulates fungal opportunists at the expense of mycorrhizal fungi. The ISME journal 4(7): 872–881. http://dx.doi.org/10.1038/ismej.2010.19.
Lundmark-Thelin A., Johansson M.B. (1997). Influence of mechanical site preparation on decomposition and nutrient dynamics of Norway spruce (Picea abies (L) Karst) needle litter and slash needles. Forest Ecology Management 96(1–2): 101–110. http://dx.doi.org/10.1016/S0378-1127(97)00040-6.
Mäkitalo K., Hyvönen J. (2004). Late-summer soil water content on clear-cut reforestation areas two decades after site preparation in Finnish Lapland. Forest Ecology Management 189(1): 57–75. http://dx.doi.org/10.1016/j.foreco.2003.07.036.
Mallik A.U., Hu D. (1997). Soil respiration following site preparation treatments in boreal mixedwood forest. Forest Ecology Management 97(3): 265–275. http://dx.doi.org/10.1016/S0378-1127(97)00067-4.
Muukkonen P., Häkkinen M., Mäkipää R. (2009). Spatial variation in soil carbon in the organic layer of managed boreal forest soil – implications for sampling design. Environmental Monitoring Assessment 158(1–4): 67–76. http://dx.doi.org/10.1007/s10661-008-0565-2.
Nohrstedt H.-O. (2000). Effects of soil scarification and previous N fertilisation on pools of inorganic N in soil after clear-felling of a Pinus sylvestris (L.) stand. Silva Fennica 34(3): 195–204. http://dx.doi.org/10.14214/sf.625.
Nordborg F., Nilsson U., Gemmel P., Orlander G. (2006). Carbon and nitrogen stocks in soil, trees and field vegetation in conifer plantations 10 years after deep soil cultivation and patch scarification. Scandinavian Journal of Forest Research 21(5): 356–363. http://dx.doi.org/10.1080/02827580600976615.
Ohlsson K.E.A., Wallmark P.H. (1999). Novel calibration with correction for drift and non-linear response for continuous flow isotope ratio mass spectrometry applied to the determination of delta N-15, total nitrogen, delta C-13 and total carbon in biological material. Analyst 124(4): 571–577. http://dx.doi.org/10.1039/a900855a.
Olsson M.T. et al. (2009). Organic carbon stocks in Swedish Podzol soils in relation to soil hydrology and other site characteristics. Silva Fennica 43(2): 209–222. http://dx.doi.org/10.14214/sf.207.
Olsson P., Linder S., Giesler R., Högberg P. (2005). Fertilization of boreal forest reduces both autotrophic and heterotrophic soil respiration. Global Change Biology 11(10): 1745–1753. http://dx.doi.org/10.1111/j.1365-2486.2005.001033.x.
Örlander G., Egnell G., Albrektson A. (1996). Long-term effects of site preparation on growth in Scots pine. Forest Ecology Management 86(1): 27–37. http://dx.doi.org/10.1016/S0378-1127(96)03797-8.
Örlander G., Gemmel P., Hunt J. (1990). Site preparation: a Swedish overview. FRDA Report 105: 1–61.
Örlander G., Hallsby G., Gemmel P., Wilhelmsson C. (1998). Inverting improves establishment of Pinus contorta and Picea abies – 10-year results from a site preparation trial in Northern Sweden. Scandinavian Journal of Forest Research 13(1–4): 160–168. http://dx.doi.org/10.1080/02827589809382972.
Palviainen M., Finér L., Kurka A.-M., Mannerkoski H., Piirainen S., Starr M. (2004). Decomposition and nutrient release from logging residues after clear-cutting of mixed boreal forest. Plant and Soil 263(1): 53–67. http://dx.doi.org/10.1023/B:PLSO.0000047718.34805.fb.
Parkinson K.J. (1981). An improved method for measuring soil respiration in the field. Journal of Applied Ecology 18(1): 221–228. http://dx.doi.org/10.2307/2402491.
Persson T. (2013). Environmental consequences of tree-stump harvesting. Forest Ecology Management 290: 1–4. http://dx.doi.org/10.1016/j.foreco.2012.09.024.
Pietikäinen J., Vaijärvi E., Ilvesniemi H., Fritze H., Westman C.J. (1999). Carbon storage of microbes and roots and the flux of CO2 across a moisture gradient. Canadian Journal of Forest Research 29(8): 1197–1203. http://dx.doi.org/10.1139/x99-066.
Prescott C.E., Blevins L.L., Staley C.L. (2000). Effects of clear-cutting on decomposition rates of litter and forest floor in forests of British Columbia. Canadian Journal Forest Research 30(11): 1751–1757. http://dx.doi.org/10.1139/x00-102.
Pumpanen J., Kolari P., Ilvesniemi H., Minkkinen K., Vesala T., Niinistö S., Lohila A., Larmola T., Morero M., Pihlatie M., Janssens I., Yuste J.C., Grünzweig J.M., Reth S., Subke J.-A., Savage K., Kutsch W., Østreng G., Ziegler W., Anthoni P., Lindroth A., Hari P. (2004a). Comparison of different chamber techniques for measuring soil CO2 efflux. Agricultural and Forest Meteorology 123(3–4): 159–176. http://dx.doi.org/10.1016/j.agrformet.2003.12.001.
Pumpanen J., Westman C.J., Ilvesniemi H. (2004b). Soil CO2 efflux from a podzolic forest soil before and after forest clear-cutting and site preparation. Boreal Environment Research 9(3): 199–212.
Raich J.W., Schlesinger W.H. (1992). The global carbon-dioxide flux in soil respiration and its relationship to vegetation and climate. Tellus Series B. Chemical and Physical Meteorology 44(2): 81–99. http://dx.doi.org/10.1034/j.1600-0889.1992.t01-1-00001.x.
Robinson D. (2001). δ15N as an integrator of the nitrogen cycle. Trends in Ecology & Evolution 16(3): 153–162. http://dx.doi.org/10.1016/S0169-5347(00)02098-X.
Schlesinger W.H., Andrews J.A. (2000). Soil respiration and the global carbon cycle. Biogeochemistry 48(1): 7–20. http://dx.doi.org/10.1023/A:1006247623877.
Silver W., Miya R. (2001). Global patterns in root decomposition: comparisons of climate and litter quality effects. Oecologia 129(3): 407–419. http://dx.doi.org/10.1007/s004420100740.
SMHI (2014). http://smhi.se. [Cited Mar 2014].
Staaf H., Berg B. (1982). Accumulation and release of plant nutrients in decomposing Scots pine needle litter. Long-term decomposition in a Scots pine forest II. Canadian Journal of Botany 60(8): 1561–1568. http://dx.doi.org/10.1139/b82-199.
Stendahl J., Johansson M.B., Eriksson E., Nilsson A., Langvall O. (2010). Soil organic carbon in Swedish spruce and pine forests – differences in stock levels and regional patterns. Silva Fennica 44(1): 5–21. http://dx.doi.org/10.14214/sf.159.
Strömgren M., Mjöfors K. (2012). Soil-CO2 flux after patch scarification, harrowing and stump harvest in a hemi-boreal forest. Scandinavian Journal of Forest Research 27(8): 754–761. http://dx.doi.org/10.1080/02827581.2012.723741.
Strömgren M., Mjöfors K., Holmström B., Grelle A. (2012). Soil CO2 flux during the first years after stump harvesting in two Swedish forests. Silva Fennica 46(1): 67–79. http://dx.doi.org/10.14214/sf.66.
Sutinen R., Pänttäjä M., Teirilä A., Sutinen M.-L. (2006). Effect of mechanical site preparation on soil quality in former Norway spruce sites. Geoderma 136(1): 411–422. http://dx.doi.org/10.1016/j.geoderma.2006.04.018.
Swedish Forest Agency (2007). Kvantifiering och beskrivning av skador till följd av markberedning ”Polytax R5/7”. [In Swedish].
Swedish Forest Agency (2014). Skogsstatistisk årsbok 2014. http://www.skogsstyrelsen.se/Myndigheten/Statistik/Skogsstatistisk-Arsbok/Skogsstatistiska-arsbocker/. [In Swedish].
Uri V., Aosaar J., Varik M, Becker H., Kukumägi M., Ligi K., Pärn L., Kanal A. (2015). Biomass resource and environmental effects of Norway spruce (Picea abies) stump harvesting: an Estonian case study. Forest Ecology Management 335(0): 207–215. http://dx.doi.org/10.1016/j.foreco.2014.10.003.
Walmsley J.D., Godbold D.L. 2010. Stump harvesting for bioenergy - a review of the environmental impacts. Forestry 83(1): 17–38. http://dx.doi.org/10.1093/forestry/cpp028.
Total of 68 references.
