Andrew McEwan,
Michal Brink,
Raffaele Spinelli 
Factors affecting the productivity and work quality of chain flail delimbing and debarking
McEwan A., Brink M., Spinelli R. (2017). Factors affecting the productivity and work quality of chain flail delimbing and debarking. Silva Fennica vol. 51 no. 2 article id 1599. https://doi.org/10.14214/sf.1599
Highlights
- Machine productivity averaged 59 m3 ub SMH–1, with a 19% incidence of delay time
- Productivity increased 70% if tree volume increased from 0.1 to 0.4 m3 ub
- Debarking quality was good for 58% of the trees, medium for 29% and poor for 13%
- The more trees in a bunch and the higher BWBS, the lower debarking quality.
Abstract
Chain flail delimbing and debarking may improve value recovery from small tree harvests, without renouncing the benefits of multi-tree processing. The technology is mature and capable of excellent performance, which has been documented in many benchmark studies. This paper offers new insights into the relationship between the performance of chain flail delimbing and debarking and such factors as tree volume, load volume, tree form and bark-wood bond strength (BWBS). The study was conducted in Chile, during the commercial harvesting of a Eucalyptus globulus Labill. plantation. In an observational study, researchers collected production data from over 780 work cycles, and work quality data from over 1000 individual trees. The analysis of these data shows that productivity is affected primarily by load volume. Work quality is affected by BWBS and by the number of trees in a load. Work quality degrades with increasing BWBS and tree number, since more trees tend to shield each other. Tree form has no effect on either productivity or work quality. Regression and probability functions are provided, and can be used for predictive purposes when trying to optimize current operations or to prospect the introduction of chain flail technology to new work environments.
Keywords
modeling;
plantation;
coppice;
efficiency;
pulpwood;
processing
- McEwan, Postgraduate Forest Programme, Faculty of Natural and Agricultural Sciences, University of Pretoria, Private Bag X20 Hatfield, Pretoria, 0028, South Africa E-mail Andrew.McEwan@nmmu.ac.za
- Brink, Postgraduate Forest Programme, Faculty of Natural and Agricultural Sciences, University of Pretoria, Private Bag X20 Hatfield, Pretoria, 0028, South Africa E-mail michal@cmo.co.za
-
Spinelli,
CNR IVALSA, Via Madonna del Piano 10, I-50019 Sesto Fiorentino (FI), Italy
 http://orcid.org/0000-0001-9545-1004
E-mail
spinelli@ivalsa.cnr.it
http://orcid.org/0000-0001-9545-1004
E-mail
spinelli@ivalsa.cnr.it
Received 23 March 2016 Accepted 22 March 2017 Published 27 March 2017
Views 95860
Available at https://doi.org/10.14214/sf.1599 | Download PDF

1 Introduction
One way to meet a growing global demand for wood fibre is to increase the harvest of small trees, as obtained from fast-growing plantations and thinning operations. The global area of fast-growing plantations is currently expanding (FAO 2009), while thinning operations represent the largest unutilized fiber source in Europe and in the temperate region (Forest Europe et al. 2011). Both sources yield a main crop of small trees, less valuable than the large trees obtained from the final cut of managed natural forests.
Harvesting small trees one at a time has always been comparatively inefficient (Johansson and Gullberg 2002) and countless efforts have been made to develop multi-tree technologies that could compensate for small tree size by handling more trees at one time (Dahlin 1991). Feller-bunchers and multi-stem harvesters used for whole-tree (WT) harvesting and cut-to-length (CTL) harvesting, all benefit from multi-tree handling.
Whole-tree harvesting is more productive and less expensive than CTL harvesting (Adebayo et al. 2007; Spinelli et al. 2009; Spinelli et al. 2014). Whole-tree harvesting requires simpler and cheaper machines than CTL harvesting, which may be an advantage when dealing with a low-value product or when operating in developing countries. The mass-handling benefit of WT harvesting is maximized when producing WT chips, but that reduces value recovery, because whole-tree chips are a low-value commodity (Spinelli and Magagnotti 2010). The financial viability of small-tree harvesting is increased by reducing cost as well as by increasing revenue, and WT chipping achieves one goal but misses the other one altogether.
Chain-flail delimbing and debarking can improve product quality without renouncing mass-handling at the time of tree processing. Such a technique allows the separation of a single stream of low-quality fuel chips into two streams with widely different values: 1) a main stream of clean chips sold as pulpwood or pellet feedstock, and 2) a secondary stream of hog fuel sold as energy feedstock. Such strategy is widely used in plantation forestry outside Europe, and it is now being explored in Europe as well (Jylhä 2011).
Chain flail delimber debarkers (CFDDs) are multi-stem processing machines that usually form part of WT harvesting systems. These machines remove branches and bark from whole trees by using hardened chain links mounted on rotating drums (rotors) that hit the trees, knocking off branches and bark (Watson et al. 1993). This system can achieve a productivity in excess of 40 t per productive machine hour, while easily removing all limbs and over 97% of the bark (Franklin 1992; Hartsough et al. 2002; Stokes et al. 1989), with fiber losses below 5% (Gingras 1992; Hartsough et al. 2000; Stokes and Watson 1991). Chain-flail technology is not at all new – in fact, it was considered an old idea already in the late 1980s (Twaddle et al. 1989), and in the 1990s was reported to be commonplace in the United States, in New Zealand and in Australia (Riddle 1995). Today, the technology has been further improved, but the basic design of commercial units remains the same, as does the strong presence in the Americas and in Australia. In contrast, chain flail technology has never obtained much success in Europe, although new efforts to mobilize the small-tree resource for pellet manufacturing might soon change the picture.
In any case, few studies have attempted modeling CFDD productivity or work quality. In particular, little research has addressed the effect of bark-wood bond strength (BWBS) on CFDD performance. Therefore, the goals of this study were: 1) to determine the main factors affecting CFDD productivity and work quality and 2) to model these effects for predictive purposes.
2 Materials and methods
2.1 Site and operation
The research site was located near the town of Concepcion in Chile. The study took place from 21 to 26 April 2008, at the Totoras farm in compartment 3 (Table 1). The compartment was level, with few obstacles, and was planted with blue gum (Eucalyptus globulus Labill.).
| Table 1. Compartment information. | |
| Harvesting contractor | Mecharv |
| Grower company | CMPC – Forestal Mininco |
| Farm | Totoras |
| Compartment number | 3 |
| Species | Eucalyptus globulus Labill. |
| Established (year/month) | 1998/05 |
| Treatment | Clear-cut |
| Fell age (years/months) | 9/11 |
| Average tree volume (m3) | 0.204 |
Trees were felled and bunched with a Tigercat 724E drive-to-tree feller-buncher, equipped with a high-speed disc saw. Two chainsaw operators topped larger trees while they lay bunched. The tops of trees that were hidden by other trees were not cut off.
A Tigercat 620C grapple skidder collected the bunches and dragged them to the infeed of a 440 kW Morbark 2455 chain flail delimber debarker (CFDD), which was parked at the roadside (Fig. 1). The grapple skidder presented the bunches to the CFDD in two lines, one slightly to the left of the infeed and one slightly to the right, so as to build a buffer without creating excessively large piles or interfering with the operation of the CFDD feeding crane. The crane picked up a bunch of trees at a time (henceforth defined as a load) and moved it to the feed rollers, which were placed at the end of 140 cm-wide chute. The hydraulically-powered feed rollers opened to a maximum height of 60 cm, grabbed the stems and pushed them into the flail chamber. The chamber contained three sets of chain flails mounted on rotating drums. The first two flails rotated in the direction of tree movement, while the third flail rotated in the opposite direction to prevent loose material from being swept out of the outfeed. Additional feed rollers inside the chamber assisted with keeping the trees moving. Debris fell to the bottom of the chamber and it was expelled by a hydraulic pusher. Debris was then collected by the skidder, which moved it to a separate pile.
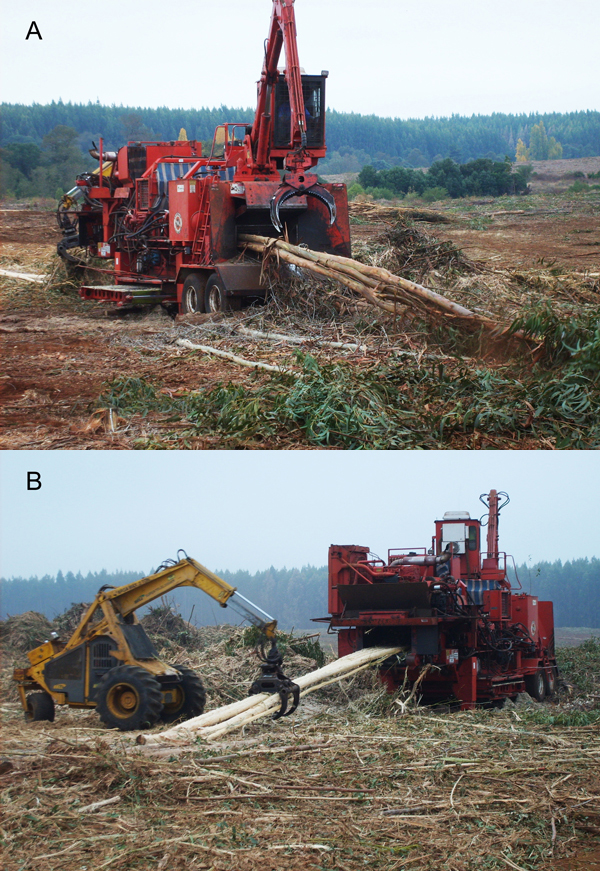
Fig. 1. The chain flail delimber debarker at work: A) feeding whole trees and B) discharging debarked stems.
As the debarked trees exited the CFDD, two Bell 220 three-wheeled loaders gripped their butt ends and pulled them to the slasher for crosscutting into 7 m lengths. Logs were then stacked along the roadside with a Tigercat 240B excavator-based loader.
All the operators had been working with their machines for at least six months and were sufficiently skilled and efficient. Operators were instructed to work at their normal pace. The rotational speed of the flail drums was set at 52 radians (rad) s–1 (500 rpm), but it was occasionally increased to 63 rad s–1 (600 rpm) if debarking quality became poor. Feeding speed was 50 m per minute (0.83 m s–1) and it was not changed for the duration of the test. Chain condition was always good. The chains were inspected at least once per shift, and more often if there were any delays. Chains were rotated after 18 hours of work, and replaced after 27 hours (total work time).
2.2 Data collection
Machine productivity was estimated with a typical time study (Magagnotti et al. 2013). The processing (i.e. delimbing and debarking) of one bunch was assumed as the observation unit. Each valid record contained information about: number of trees in the load; volume, form and bark-wood bond strength (BWBS) of each tree in the load; quality of debarking for each tree in the load; processing time.
Stem volume was determined with volume tables, which returned volume under bark in cubic meters (m3 ub) as a function of diameter at breast height and height (Bredenkamp 2000). A height-diameter curve for the test site was developed using 30 sample trees, evenly distributed across all diameter classes. Then, the diameter of all trees fed to the CFDD was measured beforehand with a diameter tape, in order to determine volume under bark. Based on that, each tree was assigned one of the five volume classes shown in Table 2, each identified with a colour code placed on its bark in highly visible paint.
| Table 2. Volume, bark-wood bond strength (BWBS) and work quality classes. | |
| Volume class | Volume range (m3 ub) |
| 1. Very small | < 0.050 |
| 2. Small | 0.051–0.099 |
| 3. Medium | 0.100–0.199 |
| 4. Large | 0.200–0.299 |
| 5. Very large | 0.300–0.499 |
| BWBS class | Description |
| 1. Very good | The bark comes off in a very long strip that can reach into the canopy before it severs (>10 m) |
| 2. Good | The bark comes off in long strips of half of the height of the tree (approximately from 4 to 10 m) |
| 3. Medium | The bark comes off in medium lengths of between one and four metres |
| 4. Poor | The bark comes off in short lengths of up to one metre |
| 5. Very poor | The bark will not come off by hand; it needs to be chiselled off by means of the hatchet |
| Quality class | Description |
| 1. Good | All bark is removed from the stem: residual bark content estimated to less than 0.5 % achieved |
| 2. Medium | Strips of residual bark remain: residual bark content estimated to less than 1 % achieved |
| 3. Poor | Sections of the tree have not had bark removed: residual bark content estimated to more than 1 % |
Bark-wood bond strength was assessed by removing a strip of bark from sample trees with a hatchet (Ramantswana and McEwan 2012). Trees were assigned to one of the five BWBS classes in Table 2. Eucalyptus trees debark the easiest immediately after felling. The longer the trees remain with their bark on, the stronger the BWBS becomes. Therefore, a time delay between felling and processing was used to produce trees that had different BWBS classes, even though all these trees originated from the same felling area. The change in BWBS was monitored over time, so that the exact BWBS for the trees being processing at a particular time was known. That way, we increased the range of variation in BWBS, so that different trees were available with different BWBS. These were identified during processing and attributed to the respective BSWB classes.
The form of each tree in a load was visually assessed using two main categories: good and poor. Good form described trees that were straight, with no visible defects. Conversely, poor form described trees that were bent, forked or flawed with a marked basal sweep (i.e. pistol-butts).
Work quality assessment reflected how thoroughly each stem had been debarked. Each tree was visually inspected, and it was attributed one of the three quality classes in Table 2. The quality assessment did not include delimbing, since all trees had been delimbed to mill specifications, and therefore delimbing quality was not an issue.
The time taken to process each individual load was recorded using an electronic stopwatch and entered into pre-printed data sheets. Productive time was separated from delay time (Björheden et al. 1995) and split into functional elements (Bergstrand 1987). Delay time was also split into the three conventional groups known as mechanical, personnel and operational delays (Spinelli and Visser 2009). The timing sessions lasted 11.4 scheduled hours, and covered the processing of 788 loads (cycles) or 3498 trees, for a total volume of 675 m3 ub.
2.3 Data analysis
Regression analysis was used to test the significance of any relationships between productive work time (dependent variable) and such influencing factors (independent variables) as: load volume; number of trees in a load; mean tree volume; tree form; BWBS. The last two factors were introduced as indicator variables, after generating as many variables as the number of levels minus one (e.g. one indicator variable for poor form; two indicator variables for BWBS classes 4 and 5, considering that the records included only classes 3, 4 and 5 because no trees matched the requirements for classes 1 and 2). Even though the characteristics of each tree were known, operational constraints made it impossible to group trees with the same characteristics together in the same load. Therefore loads contained a mix of trees with different characteristics. For this reason, the form and BWBS information associated with each load represented the average value for the trees contained in the load obtained from an assorted mix, which weakened the impact of the respective indicator variables. Different models were tested, and the final choice fell on the model that offered high significance, good correlation and a logical interpretation. Compliance with the statistical assumption was checked through the analysis of residuals.
The relation between debarking quality and the explanatory variable candidates (i.e. BWBS, volume and tree form) was assessed in a two-step approach. First, we conducted a chi-square (χ2) analysis for testing if the distribution between quality classes differed significantly between trees belonging to different BWBS classes. Second, we estimated an ordinal logistic regression to test the significance of any relationships between work quality (dependent variable) and a whole range of influencing factors (independent variables), including BWBS. Since the observation unit was the tree, not the load, the information about form and BWBS was the actual value assigned to the individual tree being tested, which guaranteed superior accuracy. In all analyses, the elected significance level was α < 0.05.
3 Results
Mean cycle time for the CFDD was 42 s, whereas the mean load contained 4.4 trees and measured 0.8 m3 ub (Table 3). Productivity averaged 74.7 m3 ub per productive machine hour (PMH), exclusive of all delays, or 59.1 m3 ub per scheduled machine hour (SMH), inclusive of all delays.
| Table 3. Main results of the productivity study. | |||||
| mean | SD | min | max | ||
| Cycle time | s | 42 | 11 | 14 | 116 |
| Trees in load | n° | 4.4 | 1.6 | 1 | 11 |
| Load volume | m3 ub | 0.857 | 0.338 | 0.025 | 2.050 |
| Tree volume | m3 ub | 0.204 | 0.078 | 0.025 | 0.475 |
| Productivity | m3 ub PMH–1 | 74.7 | 28.6 | 3.2 | 201.5 |
| m3 ub SMH–1 | 59.1 | 22.6 | 2.5 | 159.4 | |
| Utilization | % | 80.5 | - | - | - |
| DF | 0.24 | - | - | - | |
| SD = standard deviation; ub = under bark; PMH = productive machine hours, excluding delays; SMH = scheduled machine hours, including delays; Utilization = productive time/scheduled time; DF = delay factor, or delay time/productive time, where productive time is expressed in PMH | |||||
Productive work time accounted for 81% of total work site time (Fig. 2). Actual delimbing-debarking time (chain flails hitting the trees) represented 83% of the productive work time, or 67% of the total worksite time. In general, the incidence of delay time was small – especially for what concerned personnel and operational delays, which described a motivated and well-organized crew.
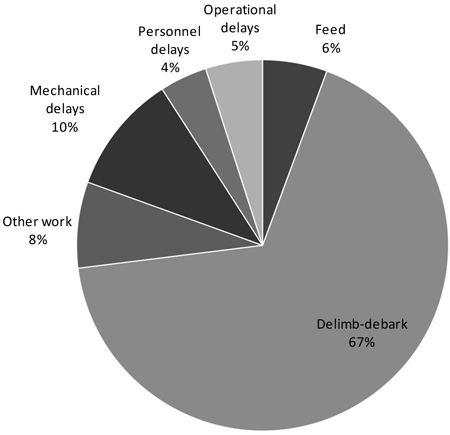
Fig. 2. Breakdown of work site time by productive tasks and delays. Other work = handling loads and residues, re-arranging stacks.
Measured in productive work time, the duration of a work cycle was weakly but significantly affected by load volume (Table 4). Larger loads generally included bigger and longer trees, which would take longer to pass through the machine, given the constant feeding speed. However, constant feeding speed meant that the rollers turned at a constant speed, not that the loads moved exactly at that speed: weight, foliage, branch position and hang-ups at the infeed sides contributed to the actual moving speed of the load, which tended to vary with load characteristics. Average tree volume and number of trees in a load were also good predictors, but they were even weaker than load volume. Besides, average tree volume was an average value calculated from actual load volume (i.e. load volume divided number of trees), and it would not impact productivity as directly as load volume did, given that the machine was actually processing one load at a time, not one tree at a time. Using tree number and average tree volume as additional variables was avoided because the three variables (i.e. load volume, tree number and average tree volume) were dependent on each other, thus verifying the risk for autocorrelation. This is demonstrated by the second regression reported in Table 3, which shows the relationship between tree volume and load volume. The model relating load volume to tree volume was calculated to assist managers when trying to predict machine productivity. Managers are likely to know the average tree volume from inventory data, while they are much less likely to know load volume. Therefore, this second equation may assist them in making an informed guess about expected load volume, if machine type and crew skills reflect those available for this study. Tree form and BWBS were all tested in the regression, but they did not prove to be significant predictors of processing time.
| Table 4. Results of the regression analysis. | ||||
| Productive time per cycle (s) = a + b × Load volume (m3 ub) | ||||
| n = 788 | R2 adjusted = 0.220 | |||
| Anova Table | ||||
| DF | SS | F-value | P-Value | |
| Regression | 1 | 372.00 | 222.41 | <0.0001 |
| Residual | 786 | 1314.72 | - | - |
| Total | 787 | 1686.72 | - | - |
| Regression Coefficients | ||||
| Coeff | SE | F-value | P-Value | |
| a | 28.50 | 0.96 | 29.30 | <0.0001 |
| b | 15.78 | 1.08 | 14.19 | <0.0001 |
| Load volume (m3 ub) = a + b ln Tree volume (m3 ub) | ||||
| n = 788 | R2 adjusted = 0.327 | |||
| Anova Table | ||||
| DF | SS | F-value | P-Value | |
| Regression | 1 | 29.43 | 383.56 | <0.0001 |
| Residual | 786 | 60.30 | - | - |
| Total | 787 | 89.73 | - | - |
| Regression Coefficients | ||||
| Coeff | SE | F-value | P-Value | |
| a | 1.63 | 0.04 | 39.97 | <0.0001 |
| b | 0.47 | 0.02 | 19.58 | <0.0001 |
| DF = degrees of freedom; SS = sum of squares; Coeff = coefficient; SE = standard error | ||||
The graph in Fig. 3 shows the relationship between load volume and productivity, expressed in cubic meters under bark per scheduled hour (m3 ub SMH–1). The graph was estimated using the first of the two equations in Table 4, which returned productive work time per load, in seconds. Delays were estimated as 24% of productive work time, based on the overall results of the study. The sum of productive work time and delays returned the total scheduled time per load. Finally, load volume was divided by total scheduled time, after conversion into hours. The graph also contains an indication of the most likely load volume and productivity positions corresponding to selected mean tree volumes (m3 ub). If mean tree volume increases fourfold from 0.1 to 0.4 m3 ub, productivity is likely to increase 70%, from 43 to 73 m3 ub SMH–1.
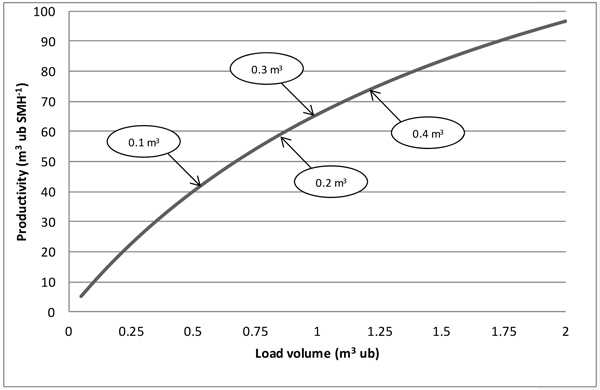
Fig. 3. Relationship between productivity and load volume. SMH = scheduled machine hours, including delays; the arrows indicate the position on the graph corresponding to the mean tree volume (m3 ub) indicated in the ellipses, based on the second equation shown in Table 4.
Work quality results showed that 58% of the trees were good, 29% medium and 13% poor (Table 5). The distribution between quality classes differed significantly with BWBS class.
| Table 5. Product quality vs. BWBS class. | ||||||
| BWBS 3 | BWBS 4 | BWBS 5 | Total | % | ||
| Quality 1 | n | 369 | 150 | 122 | 641 | 57.9 |
| % | 57.6 | 23.4 | 19.0 | 100.0 | ||
| Quality 2 | n | 56 | 49 | 214 | 319 | 28.8 |
| % | 17.6 | 15.4 | 67.1 | 100.0 | ||
| Quality 3 | n | 10 | 6 | 132 | 148 | 13.4 |
| % | 6.8 | 4.1 | 89.2 | 100.0 | ||
| Total | n | 435 | 205 | 468 | 1108 | |
| % | 39.3 | 18.5 | 42.2 | 100.0 | ||
| χ2 = 365.12, P-Value < 0.0001 | ||||||
| BWBS = bark-wood bond strength | ||||||
The results of the ordinal logistic regression analysis showed that debarking quality was significantly associated with BWBS and with the number of trees in a load (Table 6). Each additional tree in the load increased by 60 to 70% the odds that debarking quality degraded by one class. Furthermore, the odds that debarking quality dropped from good to medium doubled when moving from BWBS class 3 to BWBS class 4. If BWBS class changed from 3 to 5, then the odds that debarking quality changed from good to medium increased 8 times, and those that debarking quality changed from good to poor increased 27 times.
| Table 6. Results of the ordinal logistic regression analysis. | |||||
| n = 1108 | |||||
| R2 = 0.232 | |||||
| Quality class 2 | |||||
| Coeff | SE | e Coeff | χ2 | P-Value | |
| Constant | –3.998 | 0.310 | 0.018 | 166.257 | <0.0001 |
| BWBS 4 | 0.821 | 0.224 | 2.272 | 13.378 | 0.0003 |
| BWBS 5 | 2.158 | 0.190 | 8.656 | 128.792 | <0.0001 |
| n° trees | 0.485 | 0.060 | 1.624 | 65.835 | <0.0001 |
| Quality class 3 | |||||
| Coeff | SE | e Coeff | χ2 | P-Value | |
| Constant | –6.062 | 0.465 | 0.002 | 169.744 | <0.0001 |
| BWBS 4 | 0.455 | 0.529 | 1.576 | 0.740 | 0.3896 |
| BWBS 5 | 3.326 | 0.350 | 27.833 | 90.128 | <0.0001 |
| n° trees | 0.556 | 0.071 | 1.744 | 61.518 | <0.0001 |
| BWBS = bark-wood bond strength; Coeff = coefficient; SE = standard error; n° trees = number of trees in a load | |||||
4 Discussion
This study is just one more case study, but it is also the most recent among many other case studies available on the subject, and it is the first one to explore work quality with specific statistical techniques (i.e. chi-square analysis and OLS). Furthermore, comparison with previous case studies may lead to some moderate level of generalization, until a large-scale general study appears, which is currently missing.
The utilization figures reported in the study are quite high, but they are consistent with the industrial nature of the operation (Spinelli and Visser 2008), and in line with the figures reported in most of the previous chain flails studies (Table 7).
The productivity figures reported in this study fall within the high end of the range spanned by previous studies (Table 7), and match quite well the figures published by Ghaffariyan et al (2013a) for blue gum of about the same size, processed in Australia. Although many studies offer information regarding mean productivity under specific conditions, very few include a function for estimating productivity under changing conditions. The only exceptions are Ghaffariyan et al (2013b) and Hartsough et al. (2002) that do report such functions, but for radiata pine logs and hybrid poplar, respectively. In that regard, it is worth mentioning that all these models react to the same principle factor, and namely: piece size. This is reflected in different ways in the different studies: load volume in this study, butt end diameter in the radiata pine study and mean tree weight in the poplar study. However, the concept remains the same: it is the indicator that changes, often based on the possibility or convenience of a reasonably accurate determination.
| Table 7. Results of previous chain flail studies. View in new window/tab. |
One may also notice that all equations have a relatively low coefficient of determination: 0.22 in our case, 0.19 in Ghaffariyan et al. (2013b), 0.31 in Hartsough et al. (2002). Of course, the approximations made during measurement may have played their role in increasing error and weakening the predictive ability of the regressions. That may be the case of our use of volume classes rather than exact tree volumes, and of the adoption of butt end diameter as a predictor of piece size by Ghaffariyan et al (2013b). However, the low explanatory power of the equations is most likely to be the inevitable result of multi-tree processing, which aims specifically at dampening the impact of tree size on productivity. A successful multi-tree processing system is resilient to the effect of tree size: as tree size gets smaller, more trees are gathered in a load, in order to stabilize load size. As a result, such system will tend to produce even-sized loads, thus reducing the range of variation that can be explored in a study. In that regard, it is enlightening to notice that Mooney et al. (2000) declared that they attempted to regress productivity over tree size for a CFDD, but gave up due to the limited significance of the coefficients returned by the analysis.
It is also important to notice that neither tree form nor BWBS were significant predictors of machine productivity. Failure to assemble separate loads by tree form and BWBS certainly played a role in that, as well as the absence of trees with BWBS lower than 3. However, some effect should have emerged from the many loads where one of the characteristics was prevalent, if not exclusive. Again, it is likely that the crude operational mode of a chain flail makes it resilient to the effect of poor form as well, at least within the limits explored by this study. As to BWBS, any productivity effect should derive from the operators adjusting machine settings in order to cope with different BWBS conditions, which operators are unlikely to do unless they are confronted with a homogenous load that is large enough to justify the time spent making the necessary adjustments. That was not the case of our mix, and the operator ran the machine under the best settings for the prevalent BWBS condition. Therefore, any BWBS effects would reflect on debarking quality rather than productivity, which is exactly what was observed in this study.
The results obtained from the ordinal logistic regression (Table 6) show that debarking quality is very likely to decrease with increasing BWBS. However, our analysis did not test alternative machine settings, and therefore the odds shown in the table are valid for a machine working under an intermediate setting designed to cope with a mix of trees belonging to BWBS classes 3, 4 and 5. If one of the BWBS classes was dominant, then the operator could alter machine settings in order to achieve optimum flail and feed speed for that specific BWBS class, and then obtain possible improvements in productivity and/or work quality. Furthermore, the study could not span the entire range of possible BWBS classes, and therefore we have a picture of what can happen when BWBS degrades from medium to very poor, while we have no information about the other and more favourable segment of the curve, where BWBS goes from medium to very good. However, it might be unreasonable to expect to cover the entire range of variation within the same compartment and time, and changing compartments or coming back to the same compartment in a different season or time would likely introduce other sources of error.
Increasing the number of trees in a load has a negative impact on work quality because the trees will shield each other, reducing contact with the flails. Multi-tree processing has limits, and one cannot accumulate too many trees in a load because the productivity gain will be offset by quality losses. The study suggests that 7 trees is the maximum load size that the machine can process efficiently, in our case: beyond that, the odds that quality degrades are over twice as large as when processing with the average four-tree load.
The chain flail seems also resilient to BWBS. The machine in this study handled a very difficult mix, where no single BWBS class prevailed, but the majority of trees (60%) belonged to the poor and very poor BWBS classes. Nevertheless, work quality was found to be poor on 13% of the trees, only. In fact, several studies have already documented the good performance of CFDD equipment when processing difficult feedstock, such as frozen (Andersson et al. 1989), beetle-killed (Bicho et al. 2006) or fire-damaged (Araki 2002) trees.
5 Conclusions
This study confirms the high productivity levels that can be achieved by a modern chain flail operation, while providing a deeper insight into the main factors affecting performance. In particular, the study provides a first quantitative assessment of the relationship between work quality, BWBS and number of trees in a load. These findings have important practical implications, and they may serve as a guide to operators when assembling tree loads for flailing. Of course, many questions remain unanswered. If possible, controlled experiments should be organized to probe the effect of different machine settings on performance and debarking quality. Controlled experiments should also be conducted for gauging the impact of tree volume on productivity and work quality, by running a number of loads with homogenous tree volume, for the full range of tree volumes obtained from eucalypt plantations. Furthermore, different species should be tested, in order to determine the performance of chain-flail technology outside the specific work environment offered by eucalypt plantations. Nevertheless, this study provides a unique insight into the main factors that affect chain flail performance. Such knowledge will be very useful when fine-tuning existing operations with the intent of achieving top performance. It will also be crucial to devising optimized strategies for introducing chain flailing to new work environments, such as the European one, where work conditions are remarkably different from those encountered in North America or in the Southern Hemisphere.
References
Adebayo A., Han H., Johnson L. (2007). Productivity and cost of cut-to-length and whole-tree harvesting in a mixed-conifer stand. Forest Products Journal 57: 59–69.
Andersson B., Sauder E., Sinclair A. (1989). Field trials of a chain-flail delimber/debarker and a portable chipper, processing small diameter frozen wood. In: Proceedings of the COFE 12th Annual Meeting, August 27–30, Coeur d’Alene, ID, USA. p. 12–16.
Araki D. (2002). Fibre recovery and chip quality from de-barking and chipping fire-damaged stems. Report FRI/2002/03. FERIC, Vancouver, BC, Canada. 32 p.
Bergstrand K. (1987). Planning and analysis of time studies on forest technology. The Forest Operations Institute of Sweden. Report no 17. 58 p.
Bicho P., Hussein A., Yuen B., Gee W., Johal S. (2006). Evaluation of in-woods chipping options for beetle-killed lodgepole pine wood. Mountain Beetle Pine Initiative Working Paper 2006-19. Natural Resources Canada, Victoria, BC, Canada. 42 p.
Björheden R., Apel K., Shiba M., Thompson M. (1995). IUFRO forest work study nomenclature. Swedish University of Agricultural Science, Department of Operational Efficiency, Garpenberg. 16 p.
Bredenkamp B. (2000). Plantation inventory and volume and mass of logs and standing trees. In: Owen D.L. (ed.). South African forestry handbook 2000: volume 1. 4th ed. South African Institute of Forestry, Pretoria. p. 167–174.
Food and Agricultural Organisation (FAO). (2009). Responsible management of planted forests: voluntary guidelines – preparation for action – the country level methodology. Planted Forests and Tree Working Paper 45/E. FAO, Rome.
Forest Europe, UNECE and FAO (2011). State of Europe’s forests 2011. Status and trends in sustainable forest management in Europe. Ministerial Conference on the Protection of Forests in Europe, Oslo, Norway. 344 p.
Dahlin B. (1991). Cradle type multi-stem delimber. Studia Forestalia Suecica, Monograph no. 185. Swedish University of Agricultural Sciences, Uppsala.
Franklin G. (1992). Flail chipharvestor delimber-debarker-chipper: productivity and chip quality in hardwood. Technical Note TN-187. FERIC, Pointe Claire, PQ, Canada. 6 p
Ghaffariyan M., Brown M., Spinelli R. (2013a). Evaluating efficiency, chip quality and harvesting residues of a chipping operation with flail and chipper in Western Australia. Croatian Journal of Forest Engineering 34: 189–199
Ghaffariyan M., Sessions J., Brown M. (2013b). Roadside chipping in a first thinning operation for radiata pine in South Australia. Croatian Journal of Forest Engineering 34: 91–101.
Gingras JF. (1992). Fibre recovery efficiency of wood harvesting systems. Technical Note TN-186. FERIC, Pointe Claire, PQ, Canada. 12 p.
Hartsough B., Spinelli R., Pottle S., Klepac J. (2000). Fiber recovery with chain flail delimbing/debarking and chipping of hybrid poplar. International Journal of Forest Engineering 11: 59–65.
Hartsough B., Spinelli R., Pottle S. (2002). Delimbing hybrid poplar prior to processing with a flail/chipper. Forest Products Journal 52: 85–94.
Johansson J., Gullberg T. (2002). Multiple tree handling in the selective felling and bunching of small trees in dense stands. International Journal of Forest Engineering 13: 25–34.
Jylhä P. (2011). Harvesting undelimbed Scots pine (Pinus sylvestris L.) from first thinnings for integrated production of kraft pulp and energy. Dissertationes Forestales 133. https://doi.org/10.14214/df.133.
Kons K., Läspä O. (2013). Operational studies of a chain flail delimber. Report of the EU Biofuel Region Project. 2p. http://www.biofuelregion.se/info-sheets/.
Magagnotti N., Kanzian C., Schulmeyer F., Spinelli R. (2013). A new guide for work studies in forestry. International Journal of Forest Engineering 24(3): 249–53. https://doi.org/10.1080/14942119.2013.856613.
Mooney S., Boston K., Greene D. (2000). Production and costs of the chambers delimbinator in first thinning of pine plantations. Forest Products Journal 50: 81–84.
Ramantswana M., McEwan A., Pauw J. (2012). Determining the effect of tree size, bark-wood bond strength and tree form on the productivity of an excavator-based harvester in acacia mearnsii in the Kwazulu-Natal forestry region of South Africa. Southern Forests: a Journal of Forest Science 74(3): 151–157. https://doi.org/10.2989/20702620.2012.722823.
Riddle A. (1995). Mechanization of logging operations in New Zealand. New Zealand Journal Forestry 40: 17–22.
Spinelli R., Hartsough B. (2006). Harvesting poplar pulpwood: experience in the Pacific Northwest. Biomass and Bioenergy 30(5): 439–445. https://doi.org/10.1016/j.biombioe.2005.11.021.
Spinelli R., Magagnotti N. (2010). Comparison of two harvesting systems for the production of forest biomass from thinning of Picea abies plantations. Scandinavian Journal of Forest Research 25(1): 69–77. https://doi.org/10.1080/02827580903505194.
Spinelli R., Visser R. (2008). Analyzing and estimating delays in harvester operations. International Journal of Forest Engineering 19: 35–40.
Spinelli R., Visser R. (2009). Analysing and estimating delays in wood chipping operations. Biomass and Bioenergy 33(3): 429–433. https://doi.org/10.1016/j.biombioe.2008.08.003.
Spinelli R., Hartsough B., Owende P., Ward S. (2002). Productivity and cost of mechanized whole-tree harvesting of fast-growing Eucalypt stands. International Journal of Forest Engineering 13: 49–60.
Spinelli R., Ward S. Owende P. (2009). A harvest and transport cost model for Eucalyptus spp. fast-growing short rotation plantations. Biomass and Bioenergy 33(9): 1265–1270. https://doi.org/10.1016/j.biombioe.2009.05.010.
Spinelli R., Lombardini C., Magagnotti N. (2014). The effect of mechanization level and harvesting system on the thinning cost of Mediterranean softwood plantations. Silva Fennica 48(1) article 1003. https://doi.org/10.14214/sf.1003.
Stokes B., Watson W. (1991). Wood recovery with in-woods flailing and chipping. Tappi Journal 74: 109–113.
Stokes B., Watson W., Twaddle A., Cart I. (1989). Production and costs for in-woods flail processing of southern pines. ASAE Paper 89–7592. St. Joseph, MI, USA. 13 p.
Thompson M., Sturos J. (1991). Performance of a portable chain flail delimber/debarker processing Northern hardwoods. Research paper NC 297. USDA Forest Service, North Central Forest Experimental Station, St. Paul, MN.
Twaddle A., Stokes B., Watson W. (1989). Chain flail processing: a new look at an old idea. LIRA Technical Release 11(2). 4 p.
Watson W., Twaddle A., Hudson B. (1993). Review of chain flail delimbing-debarking. Journal of Forest Engineering 4(2): 37–52. https://doi.org/10.1080/08435243.1993.10702648.
Total of 35 references.
