Razvan Vasile Campu  ,
Arcadie Ciubotaru
,
Arcadie Ciubotaru
Time consumption and productivity in manual tree felling with a chainsaw – a case study of resinous stands from mountainous areas
Campu R. V., Ciubotaru A. (2017). Time consumption and productivity in manual tree felling with a chainsaw – a case study of resinous stands from mountainous areas. Silva Fennica vol. 51 no. 2 article id 1657. https://doi.org/10.14214/sf.1657
Highlights
- An important preoccupation in sustainable logging management is represented by the analysis of work time structure and productivity level in manual tree felling with a chainsaw
- Sound knowledge of the factors which influence work time allows better planning of harvesting operations so that deadlines could be met and damage to forest ecosystems be minimized.
Abstract
The purpose of this research is to establish time consumption and productivity when using Husqvarna 365 chainsaw for resinous tree felling in mountainous regions. The research was conducted in the Romanian Southern Carpathians, in two mixed spruce (Picea abies (L.) H. Karst.) and fir (Abies alba Mill.) tree stands (S1 and S2). Only one team of workers, made up of a feller and an assistant, was used in the felling operation. This was divided into nine specific stages for which work times were measured. Work time structure used here includes WP – workplace time (PW – productive work time; SW – supportive work time, NT – non-work time) and NW – non-workplace time. The results indicated a productivity of 10.138 m3 h–1 (4.55 tree h–1) in S1 and of 11.374 m3 h–1 (4.33 tree h–1) in S2. Work time structure was WP 88.61% (PW 19.59%; SW 33.88%; NT 35.14%) and NW 11.39% in S1 and WP 83.77% (PW 17.66%; SW 30.73%; NT 35.38%) and NW 16.23% in S2. The results obtained showed that the power function best describes the relationship between productivity expressed by tree h–1 and breast height diameter (dbh) (R2 = 0.89 in S1 and R2 = 0.94 in S2). When productivity is expressed by m3 h–1 the results obtained in the case of power, exponential and linear functions are comparable (R2 = 0.65 to 0.67 in S1 and R2 = 0.81 to 0.92 in S2). Productivity is also influenced by stump diameter and the distance between trees. Their influence on productivity was emphasized by linear regression equations.
Keywords
time study;
Husqvarna;
work time structure;
harvesting systems;
resinous temperate forest
-
Campu,
Transilvania University of Braşov, Faculty of Silviculture and Forest Engineering, Department of Forest Engineering, Forest Management Planning and Terrestrial Measurements, Şirul Beethoven no. 1, 500123, Braşov, Romania
E-mail
vasile.campu@unitbv.ro
- Ciubotaru, Transilvania University of Braşov, Faculty of Silviculture and Forest Engineering, Department of Forest Engineering, Forest Management Planning and Terrestrial Measurements, Şirul Beethoven no. 1, 500123, Braşov, Romania E-mail ciuboarc@unitbv.ro
Received 2 June 2016 Accepted 24 February 2017 Published 9 March 2017
Views 133346
Available at https://doi.org/10.14214/sf.1657 | Download PDF

Abbreviations
add – choosing the felling direction and preparing the escape routes;
AW – ancillary work time;
cc – stump debarking;
CW – complementary work time;
d – distance between harvested trees;
depl – moving to the tree to be felled;
dbh – breast height diameter;
et – sink cutting and extraction;
etpot – back-cutting;
MT – maintenance time;
MW – main work time;
nc – wood fibre cutting off the stump;
NT – non-work time;
NW – non -workplace time;
PL – planning time;
plm – preparing the workplace;
PT – preparatory time;
PW – productive work time;
RF – refuel time;
rm – fellers’ retreat, tree hitting the ground and fellers’ return;
RT – relocation time;
sd – stump diameter;
ST – service time;
SW – supportive work time;
Tadd – work time corresponding to add stage;
Tcc – work time corresponding to cc stage;
tct – wood fibre cutting off the stem;
Tdepl – work time corresponding to depl stage;
Teff – actual work time corresponding to a complete succession of stages in tree felling;
Tet – work time corresponding to et stage;
Tetpot – work time corresponding to etpot stage;
Tnc – work time corresponding to nc stage;
Tplm – work time corresponding to plm stage;
Trm – work time corresponding to rm stage;
TT – total time;
Ttct – work time corresponding to tct stage;
V – tree volume;
WP – workplace time;
WT – work time
1 Introduction
The effects of logging on forest ecosystems quality highly depend on the duration of operations characteristic of this activity. It is well-known and widely accepted that the longer the logging takes the higher the logging expenses become. This happens especially because of fixed expenses (Conway 1982) and because beneficial effects decrease (Ciubotaru 1998) as a result of the stress level increase, chiefly in the case of the forest ecosystem zoocenotic components (Krause 1993; Radle 2007; Kight and Swaddle 2011).
Under these circumstances, the planning of activities in such a way that they would fit within a maximum time span allowed by legislation and in accordance with work conditions in each felling area, becomes a major objective of forest logging (Ministerul Mediului şi Pădurilor 2011). An accurate size of the work formation along with the amount and type of equipment are essential for meeting this objective. The amount of necessary equipment depends on its efficiency and productivity under the work conditions characteristic of the felling area for which the planning is made. Time consumption (Magagnotti and Spinelli 2012) or efficiency (Richards et al. 1995; Lindroos 2010) represents the time consumed per production unit for one stage, operation or group of operations and it varies substantially depending on species, tree size, land characteristics, the treatment used and the type of felling, the equipment and its being more or less old, the workers’ qualification, etc. Productivity is influenced by the same factors and it represents the number of items produced in a time unit (Kanawaty 1992; Richards et al. 1995; Pulkki 2001).
The analysis of time consumption has been a constant preoccupation for researchers in the field of forestry. Samset (1990) dedicated an important part of his research career to studying ways of establishing work norms, improving productivity and production planning in silviculture (Magagnotti and Spinelli 2012).
Throughout the years, the research concerning time consumption focused especially on establishing a correlation between work efficiency and productivity accomplished with the help of various pieces of equipment and influenced by various factors characteristic of harvesting. One field of research that enjoyed particular attention was the one regarding time consumption in chainsaw forest operations, namely felling operations, delimbing and cross-cutting from felling areas and the landing of felling areas. The time consumption in manual tree felling with a chainsaw is studied for various reasons: (i) the typical reason is to investigate the main factors affecting work productivity and to establish a model for cost calculations and salaries or payments; (ii) an accurate model may be used in different kinds of simulations that aim to find new, more efficient and environmental friendly felling techniques and to optimize felling operations for improving the existing chainsaws and education.
The research conducted so far emphasized the fact that in felling operations time consumption is mainly influenced by tree breast height diameter (dbh) (Sobhani 1984; Kluender and Stokes 1996; Lortz et al. 1997; Ciubotaru and Maria 2012). The dependency of felling time on tree breast height diameter is expressed by linear (Samset 1990; Ghaffarian and Sobhani 2007; Uotila et al. 2014) or nonlinear (Peterson 1987; Lortz et al. 1997) correlations. The complexity of the tree felling operation with the chainsaw led to the analysis of its every stage with respect to time consumption (Nurminen et al. 2006; Azarnoush and Fathi 2014). However, the research conducted is not homogeneous as far as the number and the significance of the felling operation stages are concerned and there are important differences in the approaches of various authors. Azarnoush and Fathi (2014) define six stages in the felling operation while Mousavi et al. (2011) define thirteen stages, just to exemplify the extremes of such approaches. There is also a significant difference which occurs with regard to the content of the felling operation – Lortz et al. (1997), Wang et al. (2004) include here delimbing whereas Mousavi et al. (2011) include both delimbing and cross-cutting.
Among the numerous factors which influence time consumption in tree felling operations, the research conducted so far has taken into consideration the species (Ghaffarian and Sobhani 2007), the distance between trees and the harvested stand basal area (Kluender and Stokes 1996; Wang et al. 2004), the ground slope and route inclination where workers circulate among trees (Ghaffariyan et al. 2012), the change in the technical felling direction as opposed to the natural felling direction of trees (Azarnoush and Fathi 2014), the treatment used – clear-cut, shelter wood, even-age selection, uneven-age selection (Lortz et al. 1997) and the volume of marked trees. Snow, and especially snow thickness, may increase time consumption. More snow on the ground of the felling area produces much more resistance in workers’ movements (Yongan and Baojun 1998).
Productivity defined as the ratio of input to output (Björheden 1991; Kanawaty 1992; Lindroos 2010), is a synthetic indicator which defines the production capacity level of use in a system under certain work conditions and it is expressed, in felling operations, usually under the following form: product output/ time input (Magagnotti and Spinelli 2012). In the specific situation analysed in this paper, establishing productivity level involved measuring the volume of wood felled in a time unit. Productivity level is influenced by the same factors as time consumption, the two parameters being inversely proportional, respectively:

where:
W = productivity;
V = wood volume felled in a time unit
TU = time unit taken into consideration (hour, work shift, etc).
Mechanical saws are still an important equipment in tree felling (Jourgholami et al. 2013) in mountainous areas, where the harvester and the forwarder (Cut-to-length method) cannot be used. The use of harvesters in harvestable resinous tree stands is limited by two important factors: tree diameter at stump level and ground slope (Hiesel and Benjamin 2013). The motor-manual felling with chainsaws is still used even in Nordic countries, where it is favoured by small-scale operators, especially when dealing with biomass production (Laitila et al. 2007). In Finland the degree of mechanization (Cut-to-length method) in round wood cuttings is nearly 97% (Örn and Väkevä 2005 cited by Laitila et al. 2007). Exceptions are forest owner operations and birch veneer log harvesting, where cutting is almost invariably performed manually with a chainsaw. A combined analysis of the effect of limiting factors (tree diameter at stump level and ground slope) emphasized the fact that, in the case of Romanian resinous tree stands, the use of cut-to-length method is recommended only for 10.5% of the stand surface (Jarmo and Ciubotaru 2004).
Under these circumstances, an analysis of work time structure and of productivity level in chainsaw operations constitutes an important preoccupation of sustainable harvesting management. That is why, the main objective of this research is to establish models for time consumption and productivity level of Husqvarna 365 mechanical chainsaw in the felling of resinous trees from mountainous areas. The models to be developed should be appropriate for giving accurate productivity estimates in resinous harvestable stands from mountainous areas as well as for cost calculations and different kinds of modelling and simulation purposes. The fact that Romanian resinous forests, located in proportion of 96% in mountainous areas, represent 30% of the wood volume of standing trees and occupy 24% of the total surface is taken into account (Inventarul Forestier Național 2016).
2 Materials and methods
2.1 Research venue
The research was conducted in two experimental surfaces, called S1 and S2, located on the southern slope of Southern Carpathians in mountains Iezer Papusa – latitude 45°25´– 45°32´N and longitude 24°48´– 24°54´E at an altitude between 930 and 1500 m (Fig. 1). From a geomorphologic point of view the land has slopes with a southern aspect and average inclinations of approximately 33° (65%).
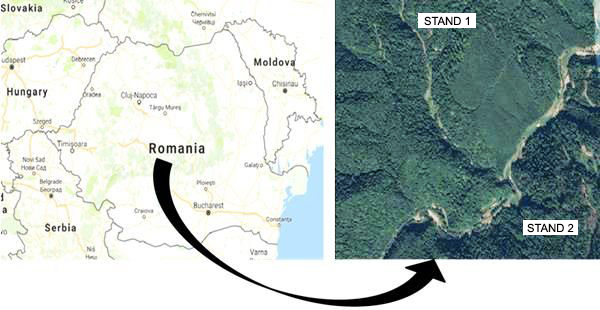
Fig. 1. Research venue.
Mixed spruce (Picea abies (L.) H. Karst.) and fir (Abies alba Mill.) tree stands were analysed where group shelter wood system was conducted at harvestable age. The main characteristics of marked resinous trees and tree stands are presented in Table 1.
| Table 1. Tree stand and marked tree characteristics. | |||||
| Tree stand characteristics | Marked tree characteristics | ||||
| Characteristic | Stand 1 | Stand 2 | Characteristic | Plot 1 | Plot 2 |
| Compartment area (ha) | 20.6 | 14.4 | Cutting area (ha) | 20.6 | 12.4 |
| Stand age (years) | 130 | 160 | Total volume (m3) | 1145 | 2376 |
| Breast height diameter (dbh) (cm) | 46 | 58 | No. of trees | 475 | 1063 |
| Average height (m) | 26 | 29 | Average tree volume (m3 tree–1) | 2.41 | 2.24 |
| Yield class | III | III | Dbh (cm) | 52 | 56 |
| Stand density (trees ha–1) | 302 | 164 | Average height (m) | 29.5 | 29 |
| Stand crown density (%) | 70 | 40 | Natural pruning (%) | 60 | 60 |
| Natural pruning (%) | 60 | 60 | Distance between marked trees (m) | 20.8 | 10.8 |
| Distance between trees (m) | 5.8 | 7.8 | - | - | - |
| Felling type | Open seeding felling | Intermediate felling | - | - | - |
2.2 Field data collection and equipment
A single team of workers, made up of a chainsaw operator and an assistant, was used. A representative team was selected formed by workers with an average level of representativeness (Groover 2007). Team selection (Kanawaty 1992) was made by calculating the average length of service as chainsaw operators for workers in the analysed area and the workers’ average age. Four teams were selected with age and length of service close to the average values determined beforehand. The team used for conducting this research was selected following the discussion with workplace leaders. The skilfulness of chainsaw operators expressed by the number of felled trees exceeded the recommended value of 8.000 (Kanawaty 1992).
The chainsaw (Husqvarna 365: cylinder displacement 65.1 cm3; power output 3.4 Kw; weight 6 kg excluding equipment) chosen for conducting this research was used for approximately 2000 hours, which is the average lifecycle of a product from this category (Monitorul Oficial 2005; Calvo et al. 2013).
Work time structure in felling operations was analysed at the level of work shift, operations and stages. The research conducted for analysing the structure of the total worktime (Fig. 2) used the classification suggested by Björheden and Thompson (2000).
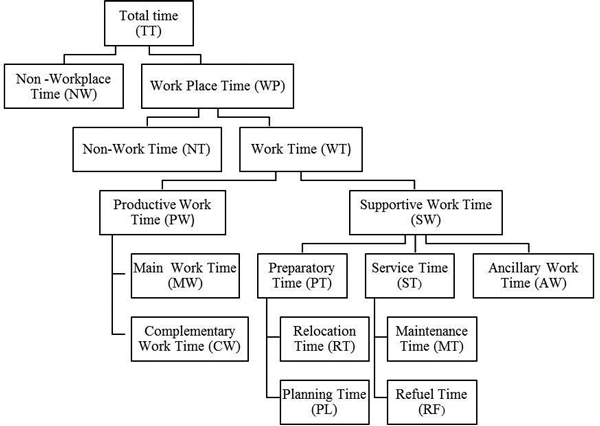
Fig. 2. Work time structure (adapted by Björheden and Thompson 2000).
The felling operation was divided into work stages according to the data in Table 2.
| Table 2. Felling operation structure. | |||
| Stage | Symbol | Start | End |
| Moving to the felled tree | depl | when the feller starts moving toward the tree to be cut | when the feller reaches the tree |
| Preparing the workplace | plm | when the feller starts clearing around the tree | when the feller ends the preparation of the workplace |
| Choosing the felling direction and preparing the escape route | add | when the feller starts judging where the tree will fall | when the feller prepared the escape route |
| Sink cutting | et | when the feller starts cutting the sink | when the feller extracted the sink |
| Back-cutting | etpot | when the feller starts cutting in the opposite direction | when the tree starts to fall |
| Fellers’ retreat, tree hitting the ground and fellers’ return | rm | when the tree starts to fall and the feller retreats on the escape route | when the tree hits the ground and the feller returns near the stump |
| Wood fibre cutting off the stump | nc | when the feller starts to cut off the stump the wood fibre split from hinge wood | when the feller finished cutting the wood fibre off the stump |
| Wood fibre cutting off the stem | tct | when the feller starts to cut off the stem the wood fibre split from hinge wood | when the feller finished cutting the wood fibre off the stem |
| Stump debarking | cc | when the assistant starts the stump debarking with an axe | when the assistant finished the stump debarking |
Activities which were strictly necessary from a technological point of view for a normal development of the production process were considered work stages (moving to the felled tree – depl; preparing the workplace – plm; choosing the felling direction and preparing the escape routes – add; sink cutting – et; back-cutting – etpot; fellers’ retreat, tree hitting the ground and fellers’ return – rm; wood fibre cutting off the stump – nc; wood fibre cutting off the stem – tct; stump debarking – cc). To these, a series of activities which were not absolutely necessary form a technological point of view were added (moving to and from the workplace at the beginning and ending of the schedule; meal, rest, needs, moving from one group of trees to another, organization; saw chain sharpening and chain tension; saw chain replacement and guide bar turning; cleaning the air filter; chainsaw fuelling with mixed fuel and oil for chain lubrication). Their acceptance was justified in order to assure the conditions imposed by work safety norms, by the specific activities from forestry as well as by ergonomic and physiological requirements.
The detailed work time structure according to operations, stages and attendant activities is presented in Table 3.
| Table 3. Work time structure according to stages and activities. | ||||||||
| Work time structure | Operations | Stages | Activities | |||||
| TT | NW | Felling | - | Moving to and from the workplace at the beginning and ending of the schedule | ||||
| WP | NT | Felling | - | Meal, rest, needs, moving from one group of trees to another, organization | ||||
| WT | PW | MW | Felling | et etpot | Sink cutting and extraction Back cutting and wedging | |||
| CW | Felling | plm add rm | Removing obstacles from around the tree and butt trimming Analysing factors involved in choosing the felling direction and establishing the felling direction Fellers’ retreat, tree hitting the ground and fellers’ return | |||||
| SW | PT | RT | Felling | depl | Moving from one tree to the next | |||
| ST | MT | Felling | - | Saw chain sharpening and chain tension Saw chain replacement and guide bar turning Cleaning the air filter | ||||
| RF | Felling | - | Chainsaw fuelling with mixed fuel and oil for chain lubrication | |||||
| AW | Felling | nc tct cc | Wood fibre cutting off the stump and stem Stump debarking with an axe | |||||
| Work time structure: TT – total time; NW – non-workplace time; WP – workplace time; NT – non-work time; WT – work time; PW – productive work time; SW – supportive work time; MW – main work time; CW – complementary work time; PT – preparatory time; ST – service time; AW – ancillary work time; RT – relocation time; PL – planning time; MT – maintenance time; RF – refuel time. | ||||||||
Time was measured in seconds (Bureau International des Poidset Mesures 2006), by using the continuous time study method. A stopwatch and a wrist watch were used to measure time by recording the inception and the ending of each operation, stage or activity during one shift. The work shift was considered to begin at the moment when the team left the felling area landing and finish when returning to the same place. All measurements regarding work time were made by the same researcher. Dendrometric elements of trees and other samples analysed were measured by a second researcher in order not to disturb the work process. The same operation was measured and conducted in one work shift. Tree height was measured with a hypsometer, log length with a forest tape measure and stump diameter and dbh with a caliper. Distances between felled trees were measured with a True Pulse 200 telemeter. For the first tree the distance was measured at the felling area entrance. The time corresponding to walking the distance from the last tree felled in one shift to the edge of the felling area was included in the non-workplace time element (NW).
2.3 Data analysis
Statistical analysis involved several steps. A first step consisted in the determination of sample size. The number of necessary measurements was established with the relation suggested by Kanawaty (1992):

where:
n = the minimum number of measurements;
p = the percentage of unproductive time;
q = the percentage of active time;
t = the value of Student distribution;
e = maximum error admitted.
Values of p and q parameters were established by trial measurements. The minimum number of measurements was established for a signification level of 95% and a maximum error admitted of 10%. In Table 4 the minimum number calculated and the number of measurements made is presented.
| Table 4. Minimum number of measurements. | ||||||
| Operation | Venue | Size of sample lot | Parameter values (%) | Number of measurements | ||
| p | q | calculated | made | |||
| Felling | Felling area | 50 | 52 | 48 | 96 | 491 |
| p – the percentage of unproductive time; q – the percentage of active time. | ||||||
A great number of measurements were made in order to normalize the distribution of the values measured and to minimize the Hawthorne effect.
The second stage involved the determination of the main statistical indicators (mean, standard error, median, standard deviation, variation coefficient) of the working time corresponding to each work stage and to the variables measured in felling areas. Based on the time consumed for each work stage, work time structure in felling trees was established. By using the total worktime, the number of trees and their volume, work productivity in felling trees with a mechanical chainsaw was determined. The next step was the identification of mathematical models which best express productivity variation. Further on, the correlations between working time corresponding to the felling stages and independent variables were identified by using the simple or multiple linear regressions. The regression significance was tested with the Fisher test (F) while the significance of the independent variables coefficients was tested using the t Student test for a transgression probability of 5%, 1% and 0.1%. The correlation intensity, expressed by the correlation coefficient was estimated by using Roemer–Orphal’s scale (0.0–0.10, no correlation; 0.10–0.25, very weak; 0.25–0.40, weak; 0.40–0.50, moderate; 0.50–0.75, strong; 0.75–0.90, very strong; 0.90–1.0, full correlation).
3 Results
A total of 491 trees were felled in the two felling areas amounting to a volume of 1193.509 m3. The total worktime (TT) necessary for felling trees in the two felling areas was of 6641.66 minutes (3181.33 minutes in S1 and 3460.33 minutes in S2) (Table 5).
| Table 5. Worktime structure in felling operations. | ||||||||||||
| Plots | No. of trees | Volume | Workplace time (WP) | Non-workplace time (NW) | Total time (TT) | |||||||
| Productive work time (PW) | Supportive work time (SW) | Non-work time (NT) | ||||||||||
| m3 | s m–3 | % | s m–3 | % | s m–3 | % | s m–3 | % | s m–3 | % | ||
| S1 | 241 | 537.528 | 69.55 | 19.59 | 120.30 | 33.88 | 124.78 | 35.14 | 40.48 | 11.39 | 355.11 | 100 |
| s tree–1 | s tree–1 | s tree–1 | s tree–1 | s tree–1 | ||||||||
| 155.12 | 268.32 | 278.31 | 90.29 | 792.03 | ||||||||
| S2 | 250 | 655.981 | 55.92 | 17.66 | 97.25 | 30.73 | 111.98 | 35.38 | 51.35 | 16.23 | 316.50 | 100 |
| s tree–1 | s tree–1 | s tree–1 | s tree–1 | s tree–1 | ||||||||
| 146.72 | 255.19 | 293.82 | 134.75 | 830.48 | ||||||||
| WP – workplace time; PW – productive work time; SW – supportive work time; NT – non-work time; NW – non-workplace time; TT – total time. | ||||||||||||
Work productivity in felling operations with Husqvarna 365 mechanical chainsaw was of 10.138 m3 h–1 (4.55 tree h–1) in S1 and of 11.374 m3 h–1 (4.33 tree h–1) in S2. Productivity is strongly influenced by dbh. In order to emphasize productivity dependence on dbh the average work time (average Teff) corresponding to a complete cycle according to diameter classes and without including delays (ST – service time, NT – non-work time and NW – non-workplace time) was taken into consideration. Thus, the main mathematical functions mentioned by literature in the field and used for estimating productivity in tree felling are presented in Fig. 3.
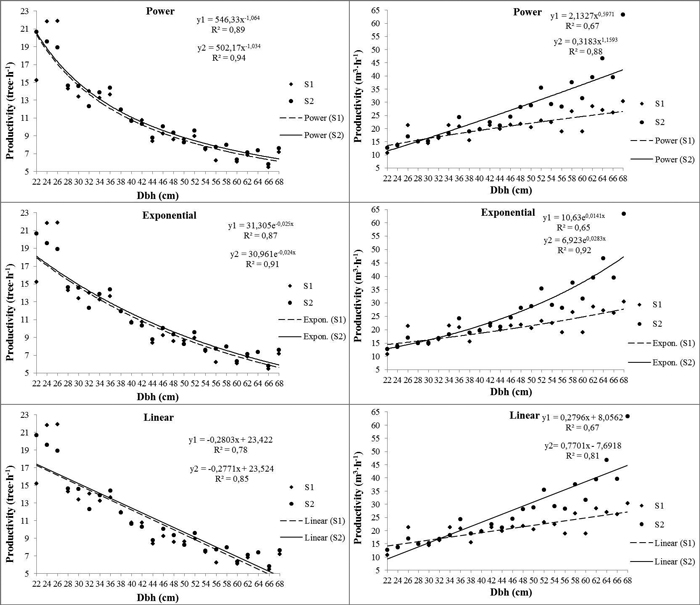
Fig. 3. Felling productivity for different tree diameters at the breast height (dbh) (without delay). View larger in new window/tab.
Work time structure according to time elements is presented in Fig. 4.
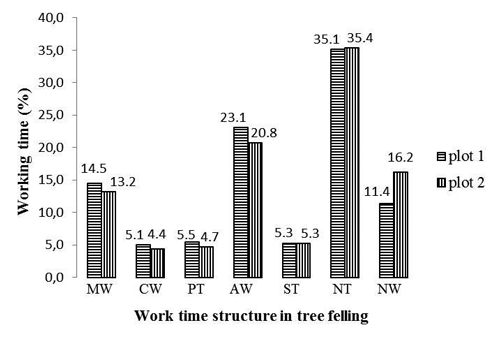
Fig. 4. Work time structure in tree felling: MW – main work time; CW – complementary work time; PT – preparatory time; AW – ancillary work time; ST – service time; NT – non-work time; NW – non-workplace time.
WT (work time) : (NT + NW) ratio is 53.5% : 46.5% in S1 and 48.4% : 51.6% in S2. Differences in work time structure between the two plots occur mainly due to the time element NW, the moving time to and from the workplace at the beginning and the ending of the schedule being longer in S2.
Work time structure in tree felling according to stages is presented in Fig. 5. It could be noticed that stages cc, et, depl and etpot prevail. Together they represent 78.6% of Teff (actual work time corresponding to a complete succession of stages in tree felling) in S1 and 78.4% of Teff in S2.
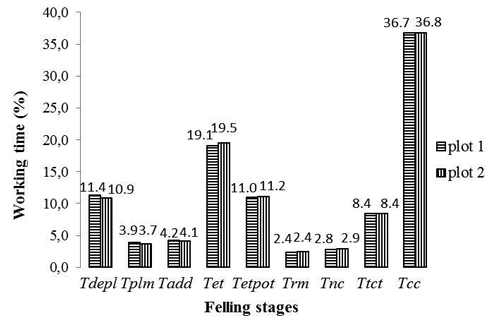
Fig. 5. Time consumption in tree felling: Tdepl – work time corresponding to depl stage; Tplm – work time corresponding to plm stage; Tadd – work time corresponding to add stage; Tet – work time corresponding to et stage; Tetpot – work time corresponding to etpot stage; Trm – work time corresponding to rm stage; Tnc – work time corresponding to nc stage; Ttct – work time corresponding to tct stage; Tcc – work time corresponding to cc stage.
The main statistical indicators of worktime variation according to stages in tree felling and of operational variables measured in the two plots are presented in Table 6.
| Table 6. Statistical indicators of work time variation corresponding to stages in the felling of one m3 of wood and to operational variables measured in felling areas. | ||||||||||
| Descriptive statistics | Mean | Median | Standard Error | Standard Deviation | Variation Coefficient (%) | |||||
| plot 1 | plot 2 | plot 1 | plot 2 | plot 1 | plot 2 | plot 1 | plot 2 | plot 1 | plot 2 | |
| Descriptive statistics of work time (s m–3) according to each stage of felling | ||||||||||
| Tdepl | 19.94 | 17.66 | 19.72 | 15.51 | 1.11 | 1.80 | 5.85 | 10.35 | 29.33 | 58.62 |
| Tplm | 7.16 | 6.83 | 7.39 | 3.40 | 1.02 | 1.27 | 5.39 | 7.30 | 75.27 | 106.9 |
| Tadd | 7.39 | 6.55 | 7.02 | 5.95 | 0.45 | 0.75 | 2.36 | 4.32 | 32.92 | 66.01 |
| Tet | 33.16 | 29.95 | 33.41 | 27.36 | 1.14 | 2.01 | 6.06 | 11.55 | 18.26 | 38.56 |
| Tetpot | 19.15 | 16.76 | 18.91 | 14.71 | 0.64 | 0.95 | 3.41 | 5.44 | 17.81 | 32.44 |
| Trm | 4.11 | 4.11 | 4.10 | 3.92 | 0.19 | 0.41 | 0.99 | 2.33 | 24.16 | 56.65 |
| Tnc | 4.86 | 4.57 | 4.62 | 4.31 | 0.26 | 0.36 | 1.38 | 2.08 | 28.34 | 45.55 |
| Ttct | 14.46 | 13.36 | 13.67 | 13.55 | 0.77 | 1.26 | 4.09 | 7.26 | 28.29 | 54.33 |
| Tcc | 64.55 | 58.84 | 61.16 | 58.55 | 2.28 | 4.00 | 12.06 | 22.98 | 18.68 | 39.06 |
| Teff | 174.78 | 158.63 | 174.76 | 163.08 | 6.31 | 11.06 | 33.37 | 63.53 | 19.09 | 40.05 |
| Descriptive statistics of dbh, sd (cm), d (m) and V (m3) | ||||||||||
| dbh | 44.6 | 43.6 | 44.0 | 44.0 | 0.66 | 0.67 | 10.18 | 10.56 | 22.80 | 24.20 |
| sd | 53.7 | 52.7 | 54.5 | 53.0 | 0.82 | 0.82 | 12.68 | 12.95 | 23.63 | 24.56 |
| d | 20.9 | 10.5 | 16.0 | 8.0 | 1.12 | 0.59 | 17.31 | 9.32 | 8.29 | 8.87 |
| V | 2.230 | 2.624 | 2.005 | 2.313 | 0.07 | 0.10 | 1.048 | 1.57 | 46.99 | 9.78 |
| Tdepl – work time corresponding to depl stage; Tplm – work time corresponding to plm stage; Tadd – work time corresponding to add stage; Tet – work time corresponding to et stage; Tetpot – work time corresponding to etpot stage; Trm – work time corresponding to rm stage; Tnc – work time corresponding to nc stage; Ttct – work time corresponding to tct stage; Tcc – work time corresponding to cc stage; Teff – actual work time corresponding to a complete succession of stages in tree felling; d – distance between harvested trees; sd – stump diameter; V – tree volume. | ||||||||||
depl stage (moving to the felled tree) – average Tdepl (work time corresponding to depl stage) was of 19.94 s m–3 (43.31 s tree–1) in S1 and of 17.66 s m–3 (38.94 s tree–1) in S2 being substantially influenced by the distance between harvested trees (d). This was of 20.9 m (min 2 m; max 105 m) in S1 and of 10.5 m (min 1 m; max 57 m) in S2. The correlation between the two variables is a very strong one (0.87 < r < 0.88) in both plots (Table 7). Tdepl depends in proportion of 77–78% on the distance between trees, the rest of 22–23% being attributed to other factors such as stand density, harvesting intensity, slope and route sinuousness, moving direction upwards or downwards, etc. which could not be quantified with a regression equation.
| Table 7. Simple linear regression analysis of Tdepl in relation to d. | ||||||||
| ANOVA | Significance of variable coefficient | |||||||
| R2 | Standard Error | Degrees of freedom | F | Variable | Coefficient | Standard Error | t Statistic | P-value |
| Simple linear regression analysis of Tdepl in relation to d | ||||||||
| Plot 1 | ||||||||
| 0.77 | 15.629 | Regression 1 Residual 239 | 779.313*** | Constant | 9.362 | 1.579 | 5.930 | < 0.001*** |
| d | 1.630 | 0.058 | 27.916 | < 0.001*** | ||||
| Plot 2 | ||||||||
| 0.78 | 14.663 | Regression 1 Residual 248 | 894.867*** | Constant | 7.527 | 1.401 | 5.372 | < 0.001*** |
| d | 2.970 | 0.099 | 29.914 | < 0.001*** | ||||
| Asterisks denote F significance and significant correlations, *** P-value < 0.001; Tdepl – work time corresponding to depl stage; d – distance between harvested trees. | ||||||||
plm stage (preparing the workplace) – average Tplm (work time corresponding to plm stage) was of 7.16 s m–3 (min 0.00 s m–3; max 26.12 s m–3) (14.95 s tree–1) in S1 and of 6.83 s m–3 (min 0.00 s m–3; max 26.32 s m–3) (13.29 s tree–1) in S2. This is influenced by the presence or absence of obstacles (seedlings, broken branches, stumps, etc) around the felled tree and tree pruning as an expression of stand density.
add stage (choosing the felling direction and preparing the escape routes) – average Tadd (work time corresponding to add stage) was of 7.39 s m–3 (min 2.48 s m–3; max 13.35 s m–3) (16.12 s tree–1) in S1 and of 6.55 s m–3 (min 1.42 s m–3; max 22.43 s m–3) (14.79 s tree–1) in S2. The time consumed for choosing the technical direction represents 4.2% in S1 and 4.1% in S2 of the actual work time consumed for felling a tree.
et stage (sink cutting) – average Tet (work time corresponding to et stage) was of 33.16 s m–3 (min 20.07 s m–3; max 44.70 s m–3) (72.92 s tree–1) in S1 and of 29.95 s m–3 (min 13.73 s m–3; max 57.65 s m–3) (69.99 s tree–1) in S2. The feller executed a standard scarf with a depth of 1/3–1/4 dbh and an opening size between 30–45°.
etpot stage (back-cutting) – average Tetpot (work time corresponding to etpot stage) was of 19.15 s m–3 (min 14.28 s m–3; max 28.99 s m–3) (42.08 s tree–1) in S1 and of 16.76 s m–3 (min 7.55 s m–3; max 27.35 s m–3) (39.95 s tree–1) in S2. In the back-cutting the feller started the felling from the stem edge opposing the sink and made a single cut horizontally.
Independent variables – breast height diameter (dbh) and stump diameter (sd) – have the greatest influence on work time in stages et and etpot. A strong correlation (0.59 < r < 0.71) was emphasized with the help of the simple linear regression (Table 8). Under these circumstances the determination coefficient R2 shows that Tet dependence on sd is in proportion of 42–49% while Tetpot dependence on sd is of 38–47%. Dbh influences Tet in proportion of 40–47% and Tetpot in proportion of 35–43%.
| Table 8. Simple linear regression analysis of Tet and Tetpot in relation to sd and dbh. | ||||||||
| ANOVA | Significance of variable coefficient | |||||||
| R2 | Standard Error | Degrees of freedom | F | Variable | Coefficient | Standard Error | t Statistic | P-value |
| Simple linear regression analysis of Tet in relation to sd | ||||||||
| Plot 1 | ||||||||
| 0.49 | 26.665 | Regression 1 Residual 239 | 234.216*** | Constant | –38.433 | 7.476 | –5.141 | < 0.001*** |
| sd | 2.072 | 0.135 | 15.304 | < 0.001*** | ||||
| Plot 2 | ||||||||
| 0.42 | 28.964 | Regression 1 Residual 248 | 182.171*** | Constant | –31.017 | 7.705 | –4.026 | < 0.001*** |
| sd | 1.917 | 0.142 | 13.497 | < 0.001*** | ||||
| Simple linear regression analysis of Tet in relation to dbh | ||||||||
| Plot 1 | ||||||||
| 0.47 | 27.349 | Regression 1 Residual 239 | 210.854*** | Constant | –39.666 | 7.951 | –4.989 | < 0.001*** |
| dbh | 2.520 | 0.174 | 14.521 | < 0.001*** | ||||
| Plot 2 | ||||||||
| 0.40 | 29.614 | Regression 1 Residual 248 | 163.506*** | Constant | –29.343 | 7.991 | –3.672 | < 0.001*** |
| dbh | 2.277 | 0.178 | 12.787 | < 0.001*** | ||||
| Simple linear regression analysis of Tetpot in relation to sd | ||||||||
| Plot 1 | ||||||||
| 0.47 | 15.112 | Regression 1 Residual 239 | 206.574*** | Constant | –17.184 | 4.237 | –4.056 | < 0.001*** |
| sd | 1.103 | 0.077 | 14.373 | < 0.001*** | ||||
| Plot 2 | ||||||||
| 0.38 | 16.543 | Regression 1 Residual 248 | 151.244*** | Constant | –12.618 | 4.401 | –2.867 | < 0.001*** |
| sd | 0.998 | 0.081 | 12.298 | < 0.001*** | ||||
| Simple linear regression analysis of Tetpot in relation to dbh | ||||||||
| Plot 1 | ||||||||
| 0.43 | 15.625 | Regression 1 Residual 239 | 177.786*** | Constant | –16.982 | 4.542 | –3.739 | < 0.001*** |
| dbh | 1.322 | 0.099 | 13.334 | < 0.001*** | ||||
| Plot 2 | ||||||||
| 0.35 | 16.912 | Regression 1 Residual 248 | 134.008*** | Constant | –11.408 | 4.564 | –2.500 | < 0.001*** |
| dbh | 1.177 | 0.102 | 11.576 | < 0.001*** | ||||
| Asterisks denote F significance and significant correlations, *** P-value < 0.001; Tet – work time corresponding to et stage; Tetpot – work time corresponding to etpot stage; sd – stump diameter; dbh – breast height diameter. | ||||||||
rm stage (fellers’ retreat, tree hitting the ground and fellers’ return) – average Trm (work time corresponding to rm stage) was of 4.11 s m–3 (9.05 s tree–1 in S1 and 8.70 s tree–1 in S2) in both plots and it varied between 2.35–9.86 s m–3. Most frequently the feller followed the recommendations (Kestel 2007) according to which the thickness of hinge wood and the safety threshold should represent 10% of dbh.
nc stage (wood fibre cutting off the stump) – average Tnc (work time corresponding to nc stage) was of 4.85 s m–3 (min 0.00 s m–3; max 9.03 s m–3) (10.70 s tree–1) in S1 and of 4.57 s m–3 (min 0.00 s m–3; max 8.52 s m–3) (10.41 s tree–1) in S2. A correlation of moderate intensity was identified between Tnc and sd (0.46 < r < 0.49), as well as between nc and dbh (0.40 < r < 0.43) (Table 9).
| Table 9. Simple linear regression analysis of Tnc in relation to sd and dbh. | ||||||||
| ANOVA | Significance of variable coefficient | |||||||
| R2 | Standard Error | Degrees of freedom | F | Variable | Coefficient | Standard Error | t Statistic | P-value |
| Simple linear regression analysis of Tnc in relation to sd | ||||||||
| Plot 1 | ||||||||
| 0.24 | 5.593 | Regression 1 Residual 239 | 74.898*** | Constant | –4.870 | 1.849 | –2.634 | 0.009** |
| sd | 0.290 | 0.033 | 8.654 | < 0.001*** | ||||
| Plot 2 | ||||||||
| 0.21 | 6.503 | Regression 1 Residual 248 | 65.385*** | Constant | –3.180 | 1.730 | –1.838 | 0.067 |
| sd | 0.258 | 0.032 | 8.086 | < 0.001*** | ||||
| Simple linear regression analysis of Tnc in relation to dbh | ||||||||
| Plot 1 | ||||||||
| 0.18 | 6.821 | Regression 1 Residual 239 | 54.356*** | Constant | –3.555 | 1.983 | –1.793 | 0.074 |
| dbh | 0.319 | 0.043 | 7.373 | < 0.001*** | ||||
| Plot 2 | ||||||||
| 0.16 | 6.712 | Regression 1 Residual 248 | 46.223*** | Constant | –1.563 | 1.811 | –0.863 | 0.388 |
| dbh | 0.274 | 0.040 | 6.799 | < 0.001*** | ||||
| Asterisks denote F significance and significant correlations, *** P-value < 0.001; Tnc – work time corresponding to nc stage; sd – stump diameter; dbh – breast height diameter. | ||||||||
tct stage (wood fibre cutting off the stem) – average Ttct (work time corresponding to tct stage) was of 14.46 s m–3 (min 4.57 s m–3; max 22.54 s m–3) (32.17 s tree–1) in S1 and of 13.36 s m–3 (min 3.28 s m–3; max 28.21 s m–3) (30.08 s tree–1) in S2. Weak correlations (0.35 < r < 0.36) were emphasized between Ttct and independent variables sd and dbh.
cc stage (stump debarking) – average Tcc (work time corresponding to cc stage) was of 64.55 s m–3 (min 44.62 s m–3; max 97.11 s m–3) (140.13 s tree–1) in S1 and of 58.84 s m–3 (min 30.57 s m–3; max 111.96 s m–3) (131.90 s tree–1) in S2. Direct correlations of strong intensity (0.66 < r < 0.68 between Tcc and sd; 0.67 < r < 0.70 between Tcc and dbh) exist between Tcc and independent variables sd and dbh (Table 10).
| Table 10. Simple linear regression analysis of Tcc in relation to sd and dbh. | ||||||||
| ANOVA | Significance of variable coefficient | |||||||
| R2 | Standard Error | Degrees of freedom | F | Variable | Coefficient | Standard Error | t Statistic | P-value |
| Simple linear regression analysis of Tcc in relation to sd | ||||||||
| Plot 1 | ||||||||
| 0.50 | 35.323 | Regression 1 Residual 239 | 237.089*** | Constant | –14.057 | 10.269 | –1.369 | < 0.001*** |
| sd | 3.452 | 0.224 | 15.398 | < 0.001*** | ||||
| Plot 2 | ||||||||
| 0.44 | 38.100 | Regression 1 Residual 248 | 197.969*** | Constant | –8.728 | 10.282 | –0.849 | < 0.001*** |
| sd | 3.223 | 0.229 | 14.070 | < 0.001*** | ||||
| Simple linear regression analysis of Tcc in relation to dbh | ||||||||
| Plot 1 | ||||||||
| 0.47 | 36.399 | Regression 1 Residual 239 | 209.360*** | Constant | –3.572 | 10.205 | –0.350 | < 0.001*** |
| dbh | 2.674 | 0.185 | 14.469 | < 0.001*** | ||||
| Plot 2 | ||||||||
| 0.43 | 38.529 | Regression 1 Residual 248 | 188.092*** | Constant | –4.634 | 10.250 | –0.452 | < 0.001*** |
| dbh | 2.591 | 0.189 | 13.715 | < 0.001*** | ||||
| Asterisks denote F significance and significant correlations, *** P-value < 0.001; Tcc – work time corresponding to cc stage; sd – stump diameter; dbh – breast height diameter. | ||||||||
Actual work time (Teff) corresponding to the complete succession of stages in tree felling represents the sum of work times corresponding to each stage and it can be expressed by (s m3) or (s tree–1):
![]()
Considering the work time structure used in this paper the relation above corresponds to the following relation:
![]()
Average Teff was of 174.78 s m–3 (min 117.43 s m–3; max 257.38 s m–3) (381.43 s tree–1) in S1 and of 158.63 s m–3 (min 69.46 s m–3; max 290.22 s m–3) (358.06 s tree–1) in S2. It is to be noted that Teff expressed in s m–3 represents 49.21% of TT in S1 and 50.12% of TT in S2, and when expressed by s tree–1 it represents 48.16% in S1 and 43.11% in S2.
The multiple linear regression was used to estimate Teff while sd and d were independent variables. The use of sd instead of dbh was preferred because in all correlations obtained the correlation coefficient was greater when sd was used as an independent variable. Therefore, the multiple correlation coefficient is R = 0.80 in S1 and R = 0.76 in S2 (Table 11).
| Table 11. Multiple linear regression analysis of Teff in relation to sd and d. | ||||||||
| ANOVA | Significance of variable coefficient | |||||||
| R2 | Standard Error | Degrees of freedom | F | Variable | Coefficient | Standard Error | t Statistic | P-value |
| Simple linear regression analysis of Teff in relation to sd and d | ||||||||
| Plot 1 | ||||||||
| 0.65 | 86.320 | Regression 1 Residual 239 | 218.149*** | Constant | –77.353 | 24.486 | –3.159 | 0.002** |
| sd | 7.146 | 0.442 | 16.169 | < 0.001*** | ||||
| d | 3.590 | 0.325 | 11.043 | < 0.001*** | ||||
| Plot 2 | ||||||||
| 0.58 | 97.215 | Regression 1 Residual 248 | 170.368*** | Constant | –48.664 | 26.036 | –1.869 | 0.062 |
| sd | 6.258 | 0.483 | 12.959 | < 0.001*** | ||||
| d | 7.277 | 0.667 | 10.917 | < 0.001*** | ||||
| Asterisks denote F significance and significant correlations, *** P-value < 0.001; Teff – actual work time corresponding to a complete succession of stages in tree felling; d – distance between harvested trees; sd – stump diameter. | ||||||||
4 Discussion
The development of mathematical methods for determining work productivity in tree felling with a manual chainsaw helps forest managers establish the human and material resources needed for operation planning so that they would fit in the time available for harvesting and the impact on the forest ecosystem would be minimum. The productivity models and work time structure used in this research will also be useful in the development of simulations and in training of chainsaw operators. This research methodology is based on the use of one single work team. Consequently, the results obtained do not indicate the variations which may be caused by the human factor. It is common knowledge in the literature in the field that, under the same work conditions, different work teams achieve a different productivity. Also, it is well known that the operator has a large influence on productivity in most types of forest works (Gullberg 1955). In comparative time studies it is difficult to provide the exact same conditions. Actually, out of all factors which influence time consumption, the most difficult to keep constant is the operator (Gullberg 1995). The present methodology can also be used in the case of other harvestable tree-stands. The results obtained can be compared with the ones presented in this paper as well as with those displayed in other papers in the field obtained under similar conditions.
In similar studies it has been found that productivity in coniferous tree felling is less time consuming than in broadleaf species (Nurminen et al. 2006; Liepiņš et al. 2015). Tree size is the main characteristic influencing tree felling with a mechanical chainsaw. Most research uses dbh as the main factor for estimating productivity and worktime either by linear equations (Samset 1990; Ghaffarian and Sobhani 2007; Uotila et al. 2014) or by the power function (Peterson 1987; Lortz et al. 1997; Liepiņš et al. 2015) and sd in an exponential model.
The results obtained by this research highlighted the fact that the power function best describes the relationship between productivity and dbh (R2 = 0.89 in S1 and R2 = 0.94 in S2) when productivity is expressed by (tree h–1). Good results were also obtained by using exponential (R2 = 0.87 in S1 and R2 = 0.91 in S2) and linear (R2 = 0.78 in S1 and R2 = 0.85 in S2) functions. When productivity is expressed by (m3 h–1) the results obtained with the three functions are comparable: power function R2 = 0.67 in S1 and R2 = 0.88 in S2; exponential function R2 = 0.65 in S1 and R2 = 0.92 in S2; linear function R2 = 0.67 in S1 and R2 = 0.81 in S2. Still, in practice, linear functions are preferred because they are very easy to use. In the current research productivity was of 10.138 m3 h–1 in S1 and of 11.374 m3 h–1 in S2.
A characteristic of this research is represented by the use of sd in estimating work time according to stages in tree felling and by using linear regression. The determination coefficient was higher when using sd as opposed to dbh in estimating worktime for stages et, etpot, nc, tct, cc. The distance between trees to be extracted (d) influences Tdepl and by this it also influences Teff (Wang et al. 2004). As a result, a multiple linear model where the independent variables were sd and d was used in estimating Teff. The determination coefficient (R2 = 0.65 in S1 and R2 = 0.58 in S2) shows that 58–65% of Teff variation is due to sd and d. Behjou et al. (2009) used variables dbh and d in a linear model and obtained a determination coefficient R2 = 0.84.5. Besides independent variables sd and d, Teff is influenced in proportion of 35–42% by other factors mentioned by literature in the field. Thus, Tdepl is influenced by stand density, harvesting intensity (Wang et al. 2004) and slope between two harvested trees (Behjou et al. 2009; Mousavi et al. 2011). Steep terrain makes operators’ movement and felling more difficult than in the case of gentle terrain. The productivity of felling and bucking on gentle terrain is higher than on steep and uneven terrain (Ghaffarian and Sobhani 2007). Another factor is represented by slope in the sump area (Behjou et al. 2009) which influences work times corresponding to the other stages as a result of the feller’s posture during work. Similarly, low temperature decreases productivity. Operators need to wear more clothes and experience more difficulties in moving from one tree to the other. Also, low temperature made operators’ arms and legs and even fingers more stiff than under normal temperatures (10 °C) (Yongan and Baojun 1998). Failure to comply with recommendations as far as sink depth, hinge wood thickness and safety threshold height are concerned may cause delays in Tet, Tetpot, Trm times (Wójcik 2014). A sink that is too deep might be especially dangerous in terms of too fast and out-of-control breaking of the hinge and also impossibility of inserting wedges into the felling cut, while a sink that is too shallow might result in decreased productivity by long lasting operation of chain saw in the kerf (Wójcik 2014). Too thin hinge wood might lead to the tree hitting the ground in an uncontrolled manner, while too thick hinge wood might lead to an increase in the work time necessary for tree felling (lower productivity), but also to an increased effort from the part of the feller caused by wedging and an increased fuel consumption resulting from additional undercutting of the hinge. At the same time, a safety threshold that is too low might cause the felling direction to get out of control, while one that is too high might increase the work time necessary for tree felling. Thus, the importance of the sound training of the chainsaw operator is noticed so that the latter should be familiar with felling operations that ensure maximum productivity and safety.
There are other factors which are not mentioned by literature in the field and which are related to work conditions from the felling area and the tree and tree stand characteristics. These factors may influence work times corresponding to felling stages and by these Teff. Tplm, for example, is influenced by the presence of obstacles around the tree (seedlings, shoots, stumps, rocks, etc.) as well as by the presence of branches near the tree base. Tcc is influenced by stump size (stump diameter 0.47 < R2 < 0.50). However, taking into account that this operation is performed by an assistant with an axe, Tcc size might also be influenced by stump shape, root-swelling as well as the assistant’s experience.
An important part in work time structure is represented by delays which are part of time elements ST (5.3%), NT (35.1% in S1; 35.4% in S2) and NW (11.4% in S1; 16.2% in S2). Maintenance and fuelling ensure that the chainsaw works within optimum parameters and, as a result, delays which are part of the time element ST, are difficult to reduce. The same thing is valid for delays included in the time element NW, caused by going to the felling area when the schedule begins and back home when the schedule ends. Delays included in the time element NT (personal delay, operational delay and technical delay) could be reduced by a better organization and planning of operations.
The structure of the felling operation suggested by the authors of this paper allows the labelling of felling operation stages in accordance with the specifications made by Kanawaty (1992), Björheden and Thompson (2000) and Groover (2007). Thus, the share of each stage in the felling operation was established and the factors which influence the work time of each stage were identified along with the manner in which these work. A detailed analysis of work time structure in manual tree felling with a chainsaw, under specific work conditions, has an important role in finding the limiting factors of this activity and, by this, in taking technical and technological measures that would lead to an increased productivity level.
References
Azarnoush M.R., Fathi J. (2014). Efficiency economic of chainsaw and Timber Jack 450C Skidder evaluation in felling operation and ground-base skidding system. Journal of Advances in Biology 4(3): 461–476.
Behjou F.K., Majnounian B., Dvořák J., Namiranian A., Saeed M., Feghhi J. (2009). Productivity and cost of manual felling with a chainsaw in Caspian forests. Journal of Forest Science 55(2): 96–100.
Björheden R. (1991). Basic time concepts for international comparisons of time study reports. Journal of Forest Engineering 2(2): 33–39. https://doi.org/10.1080/08435243.1991.10702626.
Björheden R., Thompson M.A. (2000). An international nomenclature for forest work study. In: Field D.B. (ed.). Proceedings, IUFRO 1995 S3:04, 20th World Congress, August 6–12, Tampere, Finland. Misc. Rep. 422. University of Maine, Orono, ME. p. 190–215.
Bureau International des Poidset Mesures (2006). The International System of Units (SI). 8th edition. 97 p.
Calvo A., Manzone M., Spinelli R. (2013). Long term repair and maintenance cost of some professional chainsaws. Croatian Journal of Forest Engineering 34(2): 265–272.
Ciubotaru A. (1998). Exploatarea pădurilor. [Forest Harvesting]. Editura Lux Libris, Braşov, 351 p.
Ciubotaru A., Maria G.D. (2012). Research regarding structure of working time in spruce felling with mechanical chainsaw Husqvarna 365. In: Bulletin of the Transilvania University of Brașov, series II: forestry. Wood industry. Agricultural Food Engineering 5(54): 43–48.
Conway S. (1982). Logging practices. Principles of timber harvesting systems. Miller Freeman Publications, Inc. 432 p.
Ghaffarian M.R., Sobhani H. (2007). Cost production study of motor-manually felling and processing of logs. Forest Science 3: 69–76.
Ghaffariyan M.R., Naghdi R., Ghajar I., Nikooy M. (2012). Time prediction models and cost evaluation of cut-to-length (CTL) harvesting method in a mountainous forest. Small-scale Forestry 12(2): 181–192. https://doi.org/10.1007/s11842-012-9204-4.
Groover M.P. (2007). Work systems and methods, measurement, and management of work. Upper Saddle River (NJ), Pearson Prentice Hall. 778 p.
Gullberg T. (1995). Evaluating operator-machine interactions in comparative time studies. Journal of Forest Engineering 7(1): 51–61. https://doi.org/10.1080/08435243.1995.10702678.
Hiesl P., Benjamin J.G. (2013). Applicability of international harvesting equipment productivity studies in Maine, USA: a literature review. Forests 4(4): 898–921. https://doi.org/10.3390/f4040898.
Inventarul Forestier Naţional (2016). Evaluarea resurselor forestiere din România. [National Forest Inventory. Forest resources assesment in Romania]. http://roifn.ro/site/rezultate-ciclul-i/. [Cited 2 Feb 2016].
Jarmo Y., Ciubotaru A. (2004). Technology transfer mechanism, indicators, measurement and evaluation in harvesting operations. A case strudy of the Nordic harvesting technology to wood exploitation in Târlung Valley conditions. In: Proceedings of Forestry and Sustainable Development, Braşov. p. 329 – 334.
Jourgholami M., Majnounian B., Zargham N. (2013). Performance, capability and costs of motor-manual tree felling in Hyrcanian hardwood forest. Croatian Journal of Forest Engineering 34(2): 283–293.
Kanawaty G. (1992). Introduction to work study (4th edition). International Labour Office, Geneva. 524 p.
Kestel B.R. (2007). Chainsaw operator’s manual. The safe use of chainsaws. 6th edition. Landlinks Press, Collingwood, Australia. 101 p.
Kight C.R., Swaddle J.P. (2011). How and why environmental noise impacts animals: an integrative, mechanistic review. Ecology Letters 14(10): 1052–1061. https://doi.org/10.1111/j.1461-0248.2011.01664.x.
Kluender R.A., Stokes B.J. (1996). Felling and skidding productivity and harvesting cost in southern pine forests. In: Proceedings of Certification-Environmental implications for forestry operations, September 9–11. p. 35–39.
Krause B. (1993). The niche hypothesis. The Soundscape Newsletter, June 6. http://www.appohigh.org/ourpages/auto/2010/12/21/52074732/niche.pdf.
Laitila J., Asikainen A., Nuutinen Y. (2007). Forwarding of whole trees after manual and mechanized felling bunching in pre-commercial thinnings. Journal of Forest Engineering 18(2): 29–39.
Liepiņš K., Lazdiņš A., Liepiņš J., Prindulis U. (2015). Productivity and cost–effectiveness of mechanized and motor-manual harvesting of grey alder (Alnus incana (L.) Moench): a case study in Latvia. Small-scale Forestry 14(4): 493–506. https://doi.org/10.1007/s11842-015-9302-1.
Lindroos O. (2010). Scrutinizing the theory of comparative time studies with operator as a block effect. Journal of Forest Engineering 21(1): 20–30.
Lortz D., Kluender R., McCoy W., Stokes B., Klepac J. (1997). Manual felling time and productivity in southern pine forests. Forest Product Journal 47(10): 59–63.
Magagnotti N., Spinelli R. (2012). Good practice guidelines for biomass production studies. COST Action FP-0902, WG 2 Operations research and measurement methodologies. CNR IVALSA. 50 p.
Ministerul Mediului și Pădurilor (2011). Ordinul 1540 pentru aprobarea Instrucţiunilor privind termenele, modalităţile şi perioadele de colectare, scoatere şi transport a materialului lemnos. [Directive 1540 for the approval of instructions concerning forest harvesting periods and procedures]. 26 p.
Monitorul Oficial (2005). H.G. nr.2139/2004, pentru aprobarea catalogului privind clasificarea şi duratele normale de funcţionare a mijloacelor fixe. [Government directive no. 2139/2004 for the approval of the catalogue concerning the classification and normal infrastructure and equipment life-cycle]. Monitorul Oficial [State Gazette] no. 46, 13 January 2005, 15 p.
Mousavi R., Nikouy M., Uusitalo J. (2011). Time consumption, productivity, and cost analysis of the motor manual tree felling and processing in the Hyrcanian Forest in Iran. Journal of Forestry Research 22(4): 665–669. https://doi.org/10.1007/s11676-011-0208-2.
Nurminen T., Korpunen H., Uusitalo J. (2006). Time consumption analysis of the mechanized cut-to-length harvesting system. Silva Fennica 40(2): 335–363. https://doi.org/10.14214/sf.346.
Örn J., Väkevä J. (2005). Puunkorjuu ja kaukokuljetus vuonna 2004. [Timber harvesting and long distance transportation in 2004]. Metsätehon Katsaus no. 4. 4 p.
Peterson J.T. (1987). Harvesting economics: hand falling second-growth timber. Technical Research Note TN-98, Forest Engineering Research Institute of Canada, Vancouver, BC. 12 p.
Pulkki R. (2001). Forest harvesting I. On the procurement of wood with emphasis on boreal and Great Lakes St. Lawrence forest regions. Lakehead University, Faculty of Forestry and Forest Environement, Forestry 3211 Lecture Notes. 156 p.
Radle A.L. (2007). The effect of noise on wildlife: a literature review. http://interact.uoregon.edu/medialit/wfae/library/articles/radle_effect_noise_wildlife.pdf.
Richards J., Skaar R., Häberle S., Apel K., Björheden R. (1995). Forest work study – nomenclature. Swedish University of Agricultural Science, Department of Operational Efficiency. 16 p.
Samset I. (1990). Some observations on time and performance studies in forestry. Meddelelserfra Norsk Institutt for Skogforskning 43(5). 80 p.
Sobhani H. (1984). A method data collection for the evaluation of forest harvesting systems. PhD Thesis, Virginia Tech University. 150 p.
Uotila K., Saksa T., Rantala J., Kiljunen N. (2014). Labour consumption models applied to motor-manual pre-commercial thinning in Finland. Silva Fennica 48(2) article 982. https://doi.org/10.14214/sf.982.
Wang J., Long J., McNeel J., Baumgras J. (2004). Productivity and cost of manual felling and cable skidding in central Appalachian hardwood forests. Forest Product Journal 54(12): 45–51.
Wójcik K. (2014). Effect of kerf execution correctness during felling with internal combustion chain saw on direction of tree fall. Annals of Warsaw University of Life Sciences – SGGW, Agriculture 64: 89–96.
Yongan W., Baojun J. (1998). Effects of low temperature on operation efficiency of tree – felling by chainsaw in North China. Journal of Forestry Research 9(1): 57–58. https://doi.org/10.1007/BF02856458.
Total of 42 references.
