Sima Mohtashami  ,
Lars Eliasson,
Gunnar Jansson,
Johan Sonesson
,
Lars Eliasson,
Gunnar Jansson,
Johan Sonesson
Influence of soil type, cartographic depth-to-water, road reinforcement and traffic intensity on rut formation in logging operations: a survey study in Sweden
Mohtashami S., Eliasson L., Jansson G., Sonesson J. (2017). Influence of soil type, cartographic depth-to-water, road reinforcement and traffic intensity on rut formation in logging operations: a survey study in Sweden. Silva Fennica vol. 51 no. 5 article id 2018. https://doi.org/10.14214/sf.2018
Highlights
- Soil type and traffic intensity had significant effects on rut formation
- Further studies are required to identify all factors affecting rut formation, especially on soils with medium bearing capacity
- The cartographic depth-to-water index (DTW) alone did not predict rut formation, but used in combination with other information, e.g. soil type, could be an interesting tool for delineating soil areas that are potentially vulnerable to rut formation in logging operations.
Abstract
Rut formation caused by logging operations has been recognised as a challenge for Swedish forestry. Frequent traffic with heavy machines on extraction roads, together with a warmer climate, is one of the factors that increases the risk of rut formation in forests. One possible way to control this impact of logging operations is to design and apply decision support tools that enable operators to take sensitive areas into account when planning extraction roads. In this study, 16 different logging sites in south-eastern Sweden were surveyed after clear-cut. Information was collected about extraction roads (i.e. traffic intensity, whether the roads had been reinforced with slash) and ruts. Digital maps such as cartographic depth-to-water (DTW) index and soil type were also examined for any connection to rut positions. Soil type and traffic intensity were found to be significant factors in rut formation, while DTW and slash reinforcement were not. However, the DTW map combined with other information, such as soil type, could contribute to decision support tools that improve planning of extraction roads.
Keywords
soil disturbance;
forestry;
forwarder;
decision support tool
-
Mohtashami,
The forestry research institute of Sweden, Skogforsk, Uppsala Science Park, SE-751 83 Uppsala, Sweden
E-mail
sima.mohtashami@skogforsk.se
-
Eliasson,
The forestry research institute of Sweden, Skogforsk, Uppsala Science Park, SE-751 83 Uppsala, Sweden
 http://orcid.org/0000-0002-2038-9864
E-mail
lars.eliasson@skogforsk.se
http://orcid.org/0000-0002-2038-9864
E-mail
lars.eliasson@skogforsk.se
-
Jansson,
The forestry research institute of Sweden, Skogforsk, Uppsala Science Park, SE-751 83 Uppsala, Sweden
http://orcid.org/0000-0002-3018-9161
E-mail
gunnar.jansson@skogforsk.se
-
Sonesson,
The forestry research institute of Sweden, Skogforsk, Uppsala Science Park, SE-751 83 Uppsala, Sweden
http://orcid.org/0000-0002-2018-7496
E-mail
johan.sonesson@skogforsk.se
Received 16 January 2017 Accepted 16 November 2017 Published 5 December 2017
Views 117080
Available at https://doi.org/10.14214/sf.2018 | Download PDF

1 Introduction
Forest harvesting takes place all year round in Sweden, as forest industries need fresh wood to produce high-quality sawn goods and to reduce the need for chemicals in pulping. Modern timber harvesting machinery is costly, but high annual utilisation rates help reduce harvesting costs and provide operators with full-time employment throughout the year, which could compensate for the investment cost. Operating heavy forest machinery all year round poses many challenges, not least negative environmental impact on the physical and chemical properties of soil.
Depending on ground bearing capacity, rut formation and soil compaction may occur in forest soil during ground-based logging operations with heavy machines (Kozlowski 1999; Williamson and Neilsen 2000; Eliasson 2005; Horn et al. 2007). Soil compaction occurs when applied load on soil exceeds the ground bearing capacity, destroying air-filled pores among the soil particles (McNabb 2001). This increases the soil strength and may reduce root penetration (Taylor 1971), and disturbs water drainage and air infiltration, which promotes anaerobic conditions in the soil and affects site fertility (Kozlowski 1999; Cambi et al. 2015).
The level of soil compaction resulting from forestry operations depends on several factors, including machine-applied pressure, soil texture and its organic matter and water content (Ampoorter et al. 2010). Ground bearing capacity of a specific site may even vary significantly between seasons, depending on variability in flow discharge amounts and soil wetness (Ågren et al. 2015). When moisture content of the soil increases beyond a critical level, extra pressure would cause soil displacement at the site of machine tracks, contributing to rut formation after vehicle passages (Cambi et al. 2015). Consequently, degree of rut occurrence also depends on site-specific factors such as soil texture and moisture content, vehicle specifications and driving behaviour e.g. velocity and turning radius (Braunak et al. 1993; Liu et al. 2010). Rut formation may imply higher bulk density and lower hydraulic conductivity at the tracks that, in turn, leads to higher risk of surface run-off and erosion (Shack-Krichner et al. 2007) and could be followed by higher loads of sediments (Ågren et al. 2015), nutrients and accumulated mercury in soils of Swedish boreal forests to water environments (Futter et al. 2016). Field studies, however, have shown both positive and negative effects of soil disturbance on forest growth (Wronski and Murphy 1994), and effects can change over time (Passauer et al. 2013).
According to Swedish forestry legislation, “severe ruts” are ruts that may affect soil and water status negatively, disturb accessibility of pathways, reduce aesthetic values of the forest, or damage cultural heritage sites. Severe ruts should be avoided in forestry operations (Swedish Forest Agency 2015). Protecting water bodies by leaving trees in 8–10 m buffer zones and avoiding driving heavy machinery across flow channels and ditches are examples of preventive actions suggested in a handbook provided for forest machine operators in Sweden (Ring et al. 2008).
A commonly used method to reduce soil disturbance is to use tops and branches from harvested trees, slash, to strengthen the ground on extraction roads where the soil is moist, i.e. more susceptible to rut formation, or where the extraction roads are expected to be trafficked more intensively. Eliasson and Wästerlund (2007) showed that application of slash on extraction roads reduces soil compaction on the upper parts of the soil, but soil compaction tends to increase with the number of passages, even on reinforced extraction roads. Slash has an economic value as biomass for energy production, so it is only used to reinforce extraction roads where necessary. The extraction of biomass for fuel therefore competes with the application of slash as a reinforcement element in improving the soil bearing capacity (Labelle and Jaeger 2012).
Other methods are used to reduce ground impact. Planning or decision support tools have been developed as a function of topography and soil type (Mohtashami et al. 2012) or combined with other factors like vehicle wheel specifications (Suvinen 2006) to predict terrain trafficability. These planning tools could be regarded as possible best-management practices to minimise soil disturbances, and their performance could improve if the models predict soil hydrological characteristics in the terrain more dynamically. LiDAR (light detection and ranging) extracted digital terrain models (DTM) have been used to map different soil moisture indexes that capture the paths of water flows on terrain surfaces, considering both surface topography and gravitational differentiation as driving forces for water drainage (Seibert and McGlynn 2007; Grabs et al. 2009; Qin et al. 2009). In the 1970s, Beven and Kirkby (1979) introduced the topographic wetness index (TWI), which is based on local upslope area draining through a certain point, divided by the gradient at that point.
A variety of methods are used to calculate TWI. Sørensen et al. (2006) studied different versions of TWI, applying different approaches to calculate catchment area and slope, and evaluated them against field-measured variables such as vegetation, soil chemistry and hydrology in boreal forests in northern Sweden. Beven and Kirkby’s TWI was seen to be site-specific and dependent on the type of variable it was to estimate; different versions might perform better than others, so local verification would be needed to achieve optimum results. In general, a modified Tarboton et al. (1991) method for calculating flow distribution resulted in improved matches for ground water level estimations.
Murphy et al. (2006) developed a cartographic depth-to-water (DTW) index based on topographic conditions and hydrographic data. DTW is also defined as the “tendency of the soil to be saturated” (Murphy et al. 2007). The model is mathematically described in Eq. 1:
![]()
where dzi / dxi is the smallest elevation path between cells of the landscape and nearest surface water with highest probability for hydrological connectivity to that cell; a is a constant parameter adjusting for direction of movement from cell to cell, and is equal to 1 when the path is parallel to the cell edge and 1.414214 when it passes the cells diagonally; Xc is the grid cell size (m) (Murphy et al. 2009).
Murphy et al. (2009) also compared the wet areas captured by DTW and those of the TWI with field-mapped soil wet areas for a 193-ha watershed in Alberta, Canada. Results showed that DTW had a better conformance, probably because it accounted for the local downslope topography and hydrological conditions, while omitting the effect of overdependence on convergent flow accumulation in TWI. However, in areas with different climatic and topographic conditions, field verification would be required to attain better DTW conformance. Ågren et al. (2014) compared several wetness indexes, e.g. Tarboton’s TWI, and Murphy’s DTW, in a Swedish landscape to evaluate which had the best capability for capturing the watersheds. TWI and DTW were identified as best matches; TWI is scale-sensitive while DTW is not. It was also shown that the optimal threshold for flow channel initiation in the DTW model needed to be adjusted to the surrounding soil type.
Most studies of the effect of specific factors on rut formation have applied controlled study designs to avoid confounding factors. However, a major factor influencing rut formation during logging operations is decisions taken by the machine operators, such as where to locate extraction roads, where to reinforce them, and which areas to avoid. Furthermore there are areas close to landings, where all logs are collected for final transportation, where driving cannot be avoided. This complexity of site conditions, operator decisions and interaction of influential factors are difficult to capture in controlled studies, so a survey study of several logging sites is needed in order to describe rut formation during practical harvesting conditions.
This study aims to evaluate whether cartographic soil moisture (DTW index), slash reinforcement of extraction roads, traffic intensity presented as number of machine passages, and expected bearing capacity of different soil type influence the risk for rut formation in commercial harvesting operations. Another aim was to evaluate whether a DTM-based soil wetness index would contribute to a decision support tool that could help logging planners and forest operators detect sensitive parts of the forest soil prior to logging operations, thereby enabling them to make better decisions regarding protection of moist soil.
2 Materials and methods
Sixteen logging sites, totalling 171 ha, were surveyed by two field technicians in summer 2013 to collect information on extraction roads and ruts in practical operating conditions. The logging sites belonged to Bergvik Skog AB and were located in Österbybruk, south-eastern Sweden. The logging operations involved mechanised cut-to-length (CTL) systems consisting of a single grip harvester and a forwarder. Operators and logging machines varied from site to site. To prevent rut formation, harvester operators reinforced extraction roads with slash where it was deemed necessary according to instructions given by the company responsible for harvesting operations in Bergvik Skog’s forest lands, Stora Enso. The sites were harvested between October 2011 and March 2013, and logs were forwarded immediately after felling. The surveyed data was collected using Arcpad software installed on a Yuma Trimble field computer.
2.1 Field data collection on extraction roads
All extraction roads, strip and base, used by forwarders were surveyed and described in line shapefiles with field-related attributes: (1) whether they had been reinforced with slash, and (2) traffic intensity, expressed as road class. Road classification – small strip roads, strip roads, base roads – was based on an estimated number of forwarder passages and the position of the extraction road on the logging site. Little-used peripheral road segments were combined into roads with more passages, and an intensively used road segment cannot become less trafficked as it approaches the landing. This might introduce some bias in the data, but the two field technicians agreed on the classification system applied to the surveyed roads (Table 1). All the extraction roads had been trafficked once by the harvester prior to forwarding, but this passage was not included in the classification procedure, since harvesters cause much less soil disturbance than a laden forwarder.
| Table 1. Classification of extratrion roads based on the estimated number of forwarder passages. | |
| Road class | Number of passages |
| (1) Small strip road | 1–2 |
| (2) Strip road | 3–5 |
| (3) Base road | 6–10 |
| (4) Main base road | >10 |
2.2 Field data collection on ruts
Ruts were defined as parts of a road surface where the soil had been disturbed by being pushed downwards or sideways due to machine passage. They were visually detectable, with depths greater than 10 cm in the deepest part of the cross-section of the tracks measured from adjacent ground level. The ruts of each site were surveyed and collected in either point or line shapefiles. The surveyed ruts were described by the following attributes: (1) length and width, (2) the road class on which they were located, and (3) whether they were located on slash-reinforced/non-reinforced segments of the roads. If severe ruts appeared in both tracks of the roads, they were measured separately but were given a single GPS-positioned point. Shape and raster files were processed in ArcMap 10.1.
2.3 Extracted data from digital maps
In addition to field-collected attributes, information about soil type and wetness condition was retrieved from soil and DTW maps for all surveyed roads and ruts. As the soil type classification in the maps is imprecise, they were grouped into three bearing capacity classes to simplify the analysis (Table 2).
| Table 2. Soil bearing capacity classification based on soil type. | |
| Soil bearing capacity class | Soil type |
| (1) High bearing capacity | Bedrock, stony soils, gravely till soils |
| (2) Medium bearing capacity | Sand and gravel sediments, sandy till soils |
| (3) Low bearing capacity | Peat soils, clay and silt sediments, clayey silt and silty till soils |
A DTW index map with 1-ha flow initiation, was prepared for the logging areas by the Forestry and Watershed Department at the University of New Brunswick. The saturated areas captured by the DTW index were classified in two main groups: areas where the depth to the nearest surface water was equal to or less than 1 m (DTW ≤ 1 m), and areas where the depth to the nearest surface water was more than 1 m (DTW > 1 m).
GPS-positioned roads and ruts were projected onto the maps to extract corresponding soil and moisture classes to the field data and to measure the length of road segments in corresponding classes on each map. Fig. 1 illustrates one of the logging sites, surveyed roads and ruts on the DTW map and the soil map.
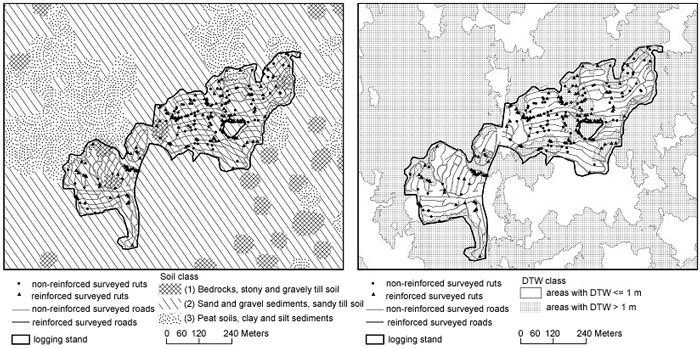
Fig. 1. One of the 16 logging sites with surveyed roads and ruts over soil map (left), and the reclassified cartographic depth-to-water (DTW) map (right). View larger in new window/tab.
A summary of variations in size of logging sites, soil bearing capacity, share of saturated areas in the logging sites, and total length of extraction roads is presented in Table 3.
| Table 3. Summary of the surveyed sites and extraction roads trafficked by forwarders. Areas with depth-to-water (DTW) <= 1 m were supposed to be more vulnerable for rut formations at trafficking. | |||||||
| Object no | Area, (ha) | Share of area with soil type of different bearing capacity, (%) | Share of area with DTW <= 1 m, (%) | Total length of roads, (m) | Share of roads with ruts deeper than 10 cm, (%) | ||
| low | medium | high | |||||
| 1 | 39.27 | 13 | 73 | 14 | 14 | 23062 | 28 |
| 2 | 20.15 | 7 | 86 | 7 | 7 | 12210 | 8 |
| 3 | 4.87 | 11 | 65 | 25 | 25 | 3392 | 28 |
| 4 | 2.97 | 1 | 52 | 48 | 48 | 1641 | 20 |
| 5 | 1.86 | 0 | 64 | 36 | 36 | 1038 | 25 |
| 6 | 2.65 | 0 | 88 | 12 | 12 | 1624 | 18 |
| 7 | 15.61 | 2 | 71 | 27 | 27 | 8900 | 21 |
| 8 | 0.85 | 12 | 88 | 0 | 0 | 410 | 5 |
| 9 | 5.92 | 2 | 75 | 22 | 22 | 3300 | 7 |
| 10 | 3.94 | 0 | 65 | 35 | 35 | 2249 | 6 |
| 11 | 18.15 | 4 | 79 | 17 | 17 | 10042 | 7 |
| 12 | 7.99 | 0 | 79 | 21 | 21 | 4258 | 2 |
| 13 | 18.38 | 5 | 70 | 25 | 25 | 9833 | 1 |
| 14 | 7.08 | 0 | 97 | 3 | 3 | 4171 | 0 |
| 15 | 16.26 | 19 | 77 | 4 | 4 | 8811 | 2 |
| 16 | 12.19 | 0 | 98 | 2 | 2 | 4836 | 3 |
2.4 Data processing and evaluation
Where a point-registered rut involved ruts in both tracks, the lengths of these segments were summed to give the total length of the rut at that point. In areas where the ruts had been collected in line shapefiles, the length of the lines was doubled if there were ruts in both tracks. The same procedure was applied to measure the length of the extraction roads: GPS-recorded roads were measured in ArcGIS and their length was multiplied by two to account for both tracks of a single machine. The share of roads with ruts deeper than 10 cm was calculated by dividing the total length of ruts, either as point or line, by the doubled length of the lines representing the road segments in each road class, soil class, reinforcement and DTW class. Collected data was evaluated to: illustrate how mean value and standard deviation of the extraction roads looked like by road class in the surveyed sites (Fig. 2, left), how the extraction roads were distributed in terms of slash reinforcement and correspondent DTW index (Fig. 2, right), and how they were distributed over road class and soil type (Fig. 3).
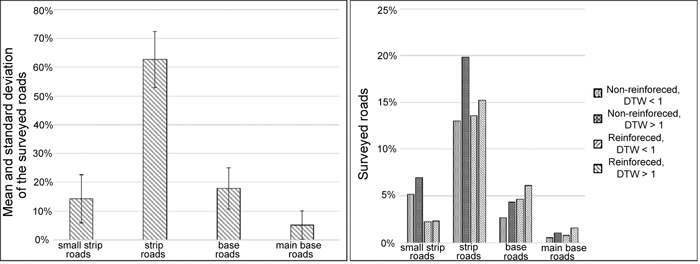
Fig. 2. Mean value and standard deviation of the surveyed roads on 16 logging sites by road class: (1) small strip road with 1–2 passages, (2) strip road with 3–5 passages, (3) base road with 6–10 passages and (4) main base road with >10 passages (left); Distribution of surveyed roads by road class and the cartographic depth-to-water (DTW), (right).
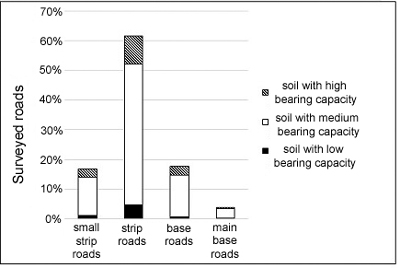
Fig. 3. Distribution of the surveyed roads by road class and soil type.
2.5 Statistical analysis
All the statistical analysis involved shares of ruts on road segments in the defined classes of road class, soil type, slash reinforcement and DTW. The mixed linear model in Eq. 2 describes the statistical model used to analyse the data. Since the share of roads with ruts was not normally distributed, the share of ruts was logit transformed to (yijklm) before analysis to fulfil the normal distribution requirement of the mixed model analysis. The logit transformation was necessary since it transforms the primary range of shares sm ϵ [0, 1] onto the interval [-∞, ∞] assumed by the normal distribution (Olsson 2002).
![]()
where
yijklm is the logit value of the response variable for observation ijklm,
µ is the overall mean,
ai is the fixed effect of road class i (where i is small strip road, strip road, base road or main base road),
bj is the fixed effect of DTW class j (where j is DTW ≤ 1 or DTW > 1),
ck is the fixed effect of slash class k (where k is reinforced or non-reinforced with slash),
dl is the fixed effect of soil class l (where l is high, medium or low bearing capacity),
sm is the random effect of site m (where m is stand 1, 2, …, 16); where we assume sm ![]()
abij, acik, adil, bcjk, bdjl, cdkl are interaction effects, and
eijklm is the random residual of observation ijklm; where we assume eijklm ![]()
Sites were regarded as a random factor in the analysis, since they had been chosen randomly from the landowners’ stand databases for logging operations. A level of p < 0.05 was chosen to distinguish significant factors. The analyses were carried out using the Proc MIXED procedure in the SAS® statistical software (Ver 9.4 SAS Institute Inc.).
Since site has a large influence in the joint analysis above, the GLM (General Linear Model) in Eq. 3 was used to analyse which factors had a significant effect within each site.
![]()
3 Results
Distribution of the surveyed extraction roads by road class varied from site to site. Analysis of the mean value of the road lengths among the studied sites showed that the most common road class was strip roads with 3 to 5 passages (Fig. 2, left). Non-reinforced roads constituted almost 54% of the roads in surveyed sites. In total, 21% of the surveyed roads were non-reinforced and were located on saturated areas with DTW ≤ 1 m, while a further 33% of the roads were non-reinforced with slash but situated on drier soils with DTW > 1 m (Fig. 2, right). The surveyed extraction roads were distributed differently on soil with low, medium and high bearing capacity types; 7%, 77%, 16% respectively. Fig. 3 shows shares of soil type over road class; the biggest share of soil type in each road class had medium bearing capacity.
The share of roads with ruts varied considerably among the logging sites (Table 3). In a statistical analysis of the share of roads with ruts deeper than 10 cm, using the variables road class, DTW, slash reinforcement, soil class and their interactions, both soil class and road class had significant effect on the share of rutted roads (Table 4). The variance between sites was 42% of residual variance. Analysis of the share of roads with ruts deeper than 10 cm in relation to soil class showed that soil types with medium bearing capacity had the largest share of ruts compared to the other two classes, and that share of ruts in all road classes clearly increased with the number of machine passages (Fig. 4).
| Table 4. Statistical analysis of share of roads with ruts, and explanatory variables: road class, cartographic depth-to-water index (DTW), slash reinforcement, soil classes and their interactions. A level of p < 0.05 was chosen to distinguish significant factors. | |||
| Variable | Degrees of freedom | F-value | p-value |
| Road class | 3 | 13.29 | <0.0001 |
| DTW | 1 | 1.68 | 0.1960 |
| Slash reinforcement | 1 | 0.43 | 0.5144 |
| Soil class | 2 | 12.18 | <0.0001 |
| Road class × DTW | 3 | 0.39 | 0.7613 |
| Road class × Slash reinforcement | 3 | 0.64 | 0.5887 |
| Road class × Soil class | 6 | 1.37 | 0.2266 |
| DTW × Slash reinforcement | 1 | 0.88 | 0.3488 |
| DTW × Soil class | 2 | 0.92 | 0.3986 |
| Slash reinforcement × Soil class | 2 | 0.00 | 0.9977 |
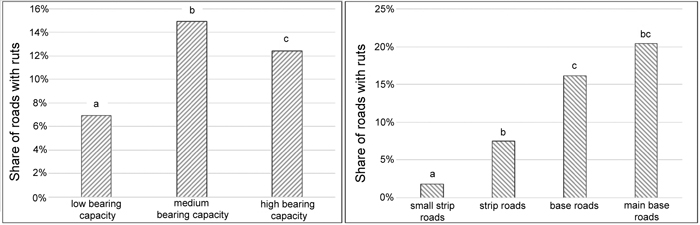
Fig. 4. Share of roads with ruts deeper than 10 cm by soil class (left) and road class (right) in all surveyed sites. Bars with different letters are statistically significant from each other according to the Tukey test.
The site wise analyses showed that more factors can have a significant influence on rut formation in an individual site than those that proved to be significant in the general mixed model. The two factors that most commonly had a significant or near significant influence on rut formation were, as expected from the mixed model, road class (traffic intensity) in 8 of 16 stands and soil type (soil bearing capacity) in 9 of 16 stands. The DTW index was influential in 8 of 16 stands, but this was almost always in interaction with another factor (Table 5).
| Table 5. Analysis of the influence of road class, cartographic depth-to-water (DTW) index class, soil class and slash reinforcement on the share of roads with ruts in the different sites, p-values from the 16 stand-based ANOVAS. A level of p < 0.05 was chosen to distinguish significant factors, cells with * indicate a significant influence and cells ** with are the ones with a near significant influence. View in new window/tab. |
4 Discussion
Several factors determine the severity of rut formation during logging operations. Soil bearing capacity, wetness of the ground, intensity of traffic on logging roads, and applied mitigating measures such as reinforcement of the extraction roads with slash are among the factors that can affect the level of soil disturbance in forest operational activities.
Some parameters such as road class (traffic intensity) and soil bearing capacity influenced the share of ruts mainly in the expected way, i.e. the share of ruts increases with traffic intensity, which corresponds with the findings of others (Ezzati et al. 2012; Agherkakli et al. 2010) and decreases for soils with high bearing capacity. One important finding of this study is that the main trafficked soil type with the greatest share of rut occurrence on the surveyed sites is soils of medium bearing capacity. There have been far more controlled experimental studies on soil with a low bearing capacity (Eliasson 2005; Eliasson and Wästerlund 2007; Bygdén et al. 2004), so there is a need for controlled experiments on factors affecting rut formation on soils of medium bearing capacity.
DTW had no significant influence on predicting rut frequency in the analyses of the total survey data. However, when the data was separated by site, DTW had an impact on the frequency of ruts in some sites, often in interaction with other parameters. This is logical, as soil moisture could be expected to have a larger effect on the probability of rut formation on weak (fine grained) soils than soils with high bearing capacity or on bedrock. Furthermore, the calculated DTW is a continuous variable, so the boundary between the two DTW classes used in this study does not mean that DTW > 1 equals dry soil and DTW ≤ 1 equals wet soil, but rather that the former is probably drier then the latter. Our findings support those of Ågren et al. (2015), who showed that DTW maps alone cannot be used as a tool for predicting rut locations, but can delineate saturated areas connected to main flow channels where rut occurrence may increase the risk for sediment transportation.
The cartographic depth-to-water index, DTW, when used together with other site-specific information such as soil type and topography (Mohtashami et al. 2012), could be used as a planning tool that can help detect sensitive areas in logging sites. Such a tool can assist planners and machine operators in making decisions about where to locate roads and where slash reinforcement is necessary. In the surveyed sites, neither planners nor operators had information about the cartographic soil moisture and soil type maps prior to logging operations. A comparison with a complementary survey study where a decision support tool had been applied at the time of road planning, is necessary before a conclusion can be drawn on how much the DTW index and soil type information could help to reduce rut frequency.
Slash reinforcement had no effect in the surveyed sites. This is probably an effect of the harvester operators reinforcing the roads they expect to be vulnerable to rut formation, and forwarder operators placing extra slash at the road surface where they observe rut development during the forwarding operation. Consequently, ruts observed in reinforced roads is not a true measure of the probability of rut formation on a road reinforced with slash by the harvester; instead, it is a combination of that probability with the probability that a road is first reinforced with slash by the forwarder when rut formation has begun. In the first case, slash reinforcement was probably not sufficient to cope with the amount of traffic. This could be the result of machine operators underestimating the amount of slash required, since there were no specific guidelines defining how much slash was needed. Similar results were found in cases where a small amount of slash was not effective in reducing ground damage when the ground was moist (Han et al. 2006; McDonald and Seixas 1997). Wood et al. (2003) also linked the failure of slash-covered roads to terrain conditions, especially water content.
Since the study was a field survey, road class had to be estimated. This may induce some subjectivity in the collected data, as it not is easy to estimate the exact number of passages. There is always a risk that the number of passages is overestimated on a rutted section of the road, but as this would then also influence the classification on the next section without ruts, the bias in road classification should be small.
A common challenge of survey studies like this is that, unlike a designed experiment, not all possible factors affecting the occurrence of ruts could be controlled or measured. For instance, it was not possible to account for the season in which the logging operation was performed, so meteorological factors, and consequently variations in soil bearing capacity caused by temperature and precipitation, were excluded.
Another important issue is that, in practice, roads are planned by the machine operators. They try to avoid causing ruts, since ruts are considered to be a negative impact on soil and have undesired effects on forwarding operation. Consequently, operators actively choose to locate roads in areas that they perceive as having sufficient bearing capacity where passage is unavoidable, and try to reinforce the road surface. In other words, they are motivated to select appropriate road locations and reinforce them if they assume the road segment will be used by more traffic. This behaviour will influence the results of the survey and must be considered when interpreting the results.
5 Concluding remarks
Further studies are required to identify the effects of all factors included in this survey on rut formation, especially on soils with medium bearing capacity. The cartographic depth-to-water index (DTW) could be an interesting tool for delineating wet soils that are potentially vulnerable to rut formation during logging operations when combined with other information, e.g. soil type. Decision support tools that incorporate these variables could help forestry operators plan extraction roads in areas with best bearing capacity, or give an indication of where the soil bearing capacity needs to be improved by, for example, slash reinforcement.
Acknowledgements
The authors wish to thank Bergvik Skog AB for allowing us to perform this study on their logging sites. The authors wish also to thank Professor Tomas Nordfjell for his valuable comments on the manuscript, and Michael Krook and Gustav Friberg for conducting the field work.
References
Agherkakli B., Najafi A., Sadeghi S.H. (2010). Ground based operation effects on soil disturbance by steel tracked skidder in a steep slope of forest. Journal of Forest Science 56(6): 278–284.
Ågren A.M., Lidberg W., Strömgren M., Ogilvie J., Arp P.A. (2014). Evaluating digital terrain indices for soil wetness mapping – a Swedish case study. Hydrology and Earth System Sciences Discussions 11(4): 4103–4129. https://doi.org/10.5194/hessd-11-4103-2014.
Ågren A.M., Lidberg W., Ring E. (2015). Mapping temporal dynamics in a forest stream network – implications for riparian forest management. Forests 6(9): 2982–3001. https://doi.org/10.3390/f6092982.
Ampoorter E., Van Nevel L., De Vos B., Hermy M., Verheyen K. (2010). Assessing the effects of initial soil characteristics, machine mass and traffic intensity on forest soil compaction. Forest Ecology and Management 260(10): 1664–1676. https://doi.org/10.1016/j.foreco.2010.08.002.
Beven K.J., Kirkby M.J. (1979). A physically based, variable contributing area model of basin hydrology / Un modèle à base physique de zone d’appel variable de l’hydrologie du bassin versant. Hydrological Sciences Bulletin 24(1): 43–69. https://doi.org/10.1080/02626667909491834.
Braunack M.V., Williams B.G. (1993). The effect of soil initial water content and vegetation cover on surface soil disturbance by tracked vehicle. Journal of Terramechanics 30(4): 299–311. https://doi.org/10.1016/0022-4898(93)90017-R.
Bygdén G., Eliasson L., Wästerlund I. (2004). Rut depth, soil compaction and rolling resistance when using bogie tracks. Journal of Terramechanics 40(4): 179–190.
Cambi M., Certini G., Neri F., Marchi E. (2015). The impact of heavy traffic on forest soils: a review. Forest Ecology and Management 338: 124–138. https://doi.org/10.1016/j.foreco.2014.11.022.
Eliasson L. (2005). Effects of forwarder tyre pressure on rut formation and soil compaction. Silva Fennica 39(4): 549–557. https://doi.org/10.14214/sf.366.
Eliasson L., Wästerlund I. (2007). Effects of slash reinforcement of strip roads on rutting and soil compaction on a moist fine-grained soil. Forest Ecology and Management 252(1–3): 118–123. https://doi.org/10.1016/j.foreco.2007.06.037.
Ezzati S., Najafi A., Rab M.A., Zenner E.K. (2012). Recovery of soil bulk density porosity and rutting from ground skidding over a 20-year period after timber harvesting in Iran. Silva Fennica 46(4): 521–538. https://doi.org/10.14214/sf.908.
Grabs T., Seibert J., Bishop K., Laudon H. (2009). Modeling spatial patterns of saturated areas: a comparison of the topographic wetness index and a dynamic distributed model. Journal of Hydrology 373(1–2): 15–23. https://doi.org/10.1016/j.jhydrol.2009.03.031.
Han H.-S., Page-Dumroese D., Han S.-K., Tirocke J. (2006). Effects of slash, machine passes, and soil moisture on penetration resistance in a cut-to-length harvesting. International Journal of Forest Engineering 17(2): 11–24.
Horn R., Vossbrink J., Peth S., Becker S. (2007). Impact of modern forest vehicles on soil physical properties. Forest Ecology and Management 248(1–2): 56–63. https://doi.org/10.1016/j.foreco.2007.02.037.
Kozlowski T.T. (1999). Soil compaction and growth of woody plants. Scandinavian Journal of Forest Research 14(6): 596–619. https://doi.org/10.1080/02827589908540825.
Labelle E.R., Jaeger D. (2012). Quantifying the use of brush mats in reducing forwarder peak loads and surface contact pressures. Croatian Journal of Forest Engineering 33(2): 249–274.
Liu K., Ayers P., Howard H., Anderson A. (2010). Influence of soil and water parameters on soil rut formation. Journal of Terramechanics 47(3): 143–150. https://doi.org/10.1016/j.jterra.2009.09.001.
McDonald T.P., Seixas F. (1997). Effect of slash on forwarder soil compaction. Journal of Forest Engineering 8(2): 15–26.
McNaab D.H., Startstev A.D., Nguyen H. (2001). Soil wetness and traffic effect levels on bulk density and air-filled porosity of compacted boreal forest soil. Soil Science Society of American Journal 65(4): 1238–1247. https://doi.org/10.2136/sssaj2001.6541238x.
Mohtashami S., Bergkvist I., Löfgren B., Berg S. (2012). A GIS approach to analyzing off-road transportation: a case study in Sweden. Croatian Journal of Forest Engineering 33(2): 275–284.
Murphy P.N.C., Ogilvie J., Castunguay M., Connors T., Meng F.R., Arp P. (2006). DEM-derived flow channel and wet area mapping: a new tool for forest operations planning. Sustainable Forest Management Network, Fourth International Conference. Edmonton, Canada.
Murphy P.N.C., Ogilvie J., Connor K., Arp P.A. (2007). Mapping wetlands: a comparison of two different approaches for New Brunswick, Canada. Wetlands 27(4): 846–854. https://doi.org/10.1672/0277-5212(2007)27[846:MWACOT]2.0.CO;2.
Murphy P.N.C., Ogilvie J., Arp P. (2009). Topographic modelling of soil moisture conditions: a comparison and verification of two models. European Journal of Soil Science 60(1): 94–109. https://doi.org/10.1111/j.1365-2389.2008.01094.x.
Olsson U. (2002). Generalized linear models. An applied approach. Studentlitteratur, Lund, Sweden. ISBN 91-44-04155-1.
Passauer D.P., Aust W.M., Chad Bolding M., Strahm B.D., Burger J.M., Patterson S.C., Vance E., Tal Roberts E. (2013). Potential above-ground biomass losses from severe soil rutting during wet weather timber harvests of coastal plain loblolly pine (Pinus taeda) plantations mitigated by mechanical site preparation. Forest Ecology and Management 307: 266–273. https://doi.org/10.1016/j.foreco.2013.07.019.
Qin C.-Z., Zhu A.X., Pei T., Li B.-L., Scholten T., Behrens T., Zhou C.-H. (2009). An approach to computing topographic wetness index based on maximum downslope gradient. Precision Agriculture 12(1): 32–43. https://doi.org/10.1007/s11119-009-9152-y.
Ring E., Löfgren S., Sandin L., Högbom L., Goedkoop W. (2008). Skogsbruk och vatten, en kunskapsöversikt. Forestry and water, a review. Skogforsk Redogörelse 3.
Seibert J., McGlynn B.L. (2007). A new triangular multiple flow direction algorithm for computing upslope areas from gridded digital elevation models. Water Resources Research 43(4).
Shack-Krichner H., Fenner P.T., Hildebrand E.E. (2007). Different responses in bulk density and saturated hydraulic conductivity to soil deformation by logging machinery on a Ferralsol under native forest. Soil Use and Management 23: 286–293. https://doi.org/10.1111/j.1475-2743.2007.00096.x.
Sørensen R., Zinko U., Seibert J. (2006). On the calculation of the topographic wetness index: evaluation of different methods based on field observations. Hydrology and Earth System Sciences Discussions 10(1): 101–112. https://doi.org/10.5194/hess-10-101-2006.
Suvinen A. (2006). A GIS-based simulation model for terrain tractability. Journal of Terramechanics 43(4): 427–449. https://doi.org/10.1016/j.jterra.2005.05.002.
Tarboton D.G., Bras R.L., Rodriguez-Iturbe I. (1991). On the extraction of channel networks from digital elevation data. Hydrological Processes 5: 81–100. https://doi.org/10.1002/hyp.3360050107.
Taylor H.M. (1971). Effect of soil strength on seedling emergence, root growth and crop yield. In: Barnes K.K., Carleton W.M., Taylor H.M., Throckmorton R.I., van den Berg G.E. (eds.). Compaction of agricultural soils. American Society of Agricultural Engineers, St. Joseph. p. 292–305.
The Swedish Forest Agency (2015). The Swedish forestry legislation. Skogsvårdslagstiftning. [In Swedish].
Williamson J.R., Neilsen W.A. (2000). The influence of forest site on rate and extent of soil compaction and profile disturbance of skid trails during ground-based harvesting. Canadian Journal of Forest Research 30(8): 1196–1205. https://doi.org/10.1139/x00-041.
Wood M.J., Moffat A.J., Carling P.A. (2003). Improving the design of slash roads used to reduce soil disturbance during mechanised harvesting of coniferous forest plantations in the UK. International Journal of Forest Engineering 14(1): 11–23.
Wronski E.B., Murphy G. (1994). Responses of forest crops to soil compaction. In: Soane B.D., van Ouwerkerk C. (eds.). Soil compaction in crop production. p. 317–342. Elsevier, New York. https://doi.org/10.1016/B978-0-444-88286-8.50022-2.
Total of 37 references.
