Andis Lazdiņš,
Ainārs Lupiķis,
Kaspars Polmanis  ,
Arta Bārdule,
Aldis Butlers,
Santa Kalēja
,
Arta Bārdule,
Aldis Butlers,
Santa Kalēja
Carbon stock changes of drained nutrient-rich organic forest soils in Latvia
Lazdiņš A., Lupiķis A., Polmanis K., Bārdule A., Butlers A., Kalēja S. (2024). Carbon stock changes of drained nutrient-rich organic forest soils in Latvia. Silva Fennica vol. 58 no. 1 article id 22017. https://doi.org/10.14214/sf.22017
Highlights
- In moderate nutrient-rich forest site type (Myrtillosa turf. mel.), a significant subsidence of peat layer after drainage is associated with compaction rather than decomposition of peat
- In nutrient-rich forest site type (Oxalidosa turf. mel.), a contribution of soil C stock losses to subsidence of the peat layer is significant
- In moderate nutrient-rich forest site type (Myrtillosa turf. mel.), type of dominant tree species has higher impact on changes in soil C stock after drainage than in nutrient-rich forest site type (Oxalidosa turf. mel.)
- Distribution of different forest site types involving soil nutrient status has to be taken into account when CO2 emissions from drained organic soil in forest land are estimated at national level.
Abstract
Impact of drainage of organic soils in forest land on soil carbon (C) stock changes is of high interest not only to accurately estimate soil C stock changes, but also to provide scientifically based recommendations for forest land management in context of climate change mitigation. To improve knowledge about long-term impact of drainage on nutrient-rich organic soils in hemiboreal forests in Latvia, 50 research sites representing drained conditions (Oxalidosa turf. mel. (Kp) and Myrtillosa turf. mel. (Ks) forest site types) and undrained conditions as control areas (Caricoso-phragmitosa, Dryopterioso-caricosa and Filipendulosa forest site types) were selected. Soil C stock changes after drainage was evaluated by comparing current C stock in drained organic soils to theoretical C stock before drainage considering impact of soil subsidence. During the 53-years period after drainage, the peat subsidence was higher in nutrient-rich Kp forest site type compared to moderate nutrient-rich Ks forest site type (peat subsided by 37.0 ± 4.8 and 23.3 ± 4.8 cm, respectively). In nutrient-rich Kp forest site type, soil C stock decreased by 4.98 ± 1.58 Mg C ha-1 yr-1 after drainage, while no statistically significant changes in soil C stock (0.19 ± 1.31 Mg C ha-1 yr-1) were observed in moderate nutrient-rich soils in Ks forest site type. Thus, in Ks forest site type, the main driver of the peat subsidence was the physical compaction, while in Kp forest site type contribution of organic matter decomposition and consequent soil C losses to subsidence of the peat was significant.
Keywords
drainage;
hemiboreal forests;
organic soil;
peat compaction;
peatland forests;
subsidence of the peat layer
-
Lazdiņš,
Latvian State Forest Research Institute ‘Silava’ (LSFRI Silava), Rigas str. 111, Salaspils, LV-2169, Latvia
 https://orcid.org/0000-0002-7169-2011
E-mail
andis.lazdins@silava.lv
https://orcid.org/0000-0002-7169-2011
E-mail
andis.lazdins@silava.lv
- Lupiķis, Latvian State Forest Research Institute ‘Silava’ (LSFRI Silava), Rigas str. 111, Salaspils, LV-2169, Latvia E-mail ainars.lupikis@inbox.lv
-
Polmanis,
Latvian State Forest Research Institute ‘Silava’ (LSFRI Silava), Rigas str. 111, Salaspils, LV-2169, Latvia
https://orcid.org/0000-0003-2579-353X
E-mail
kaspars.polmanis@silava.lv
-
Bārdule,
Latvian State Forest Research Institute ‘Silava’ (LSFRI Silava), Rigas str. 111, Salaspils, LV-2169, Latvia
https://orcid.org/0000-0003-0961-5119
E-mail
arta.bardule@silava.lv
-
Butlers,
Latvian State Forest Research Institute ‘Silava’ (LSFRI Silava), Rigas str. 111, Salaspils, LV-2169, Latvia
https://orcid.org/0000-0003-3118-1716
E-mail
aldis.butlers@silava.lv
- Kalēja, Latvian State Forest Research Institute ‘Silava’ (LSFRI Silava), Rigas str. 111, Salaspils, LV-2169, Latvia E-mail santa.kaleja@silava.lv
Received 23 December 2022 Accepted 12 December 2023 Published 4 January 2024
Views 96847
Available at https://doi.org/10.14214/sf.22017 | Download PDF

Supplementary Files
1 Introduction
Organic soils cover about 3–4% of the Earth’s total terrestrial land area, and are considered one of the largest C stocks on the planet representing up to 30% of the total soil carbon (FAO 2020). Northern peatlands store ~80% of the global peatland C stocks (Hugelius et al. 2019), while the total peat C storage of Europe is about 10–15% of the total northern peatland C storage (Byrne et al. 2004). In Europe, most peatlands are located within European Russia, Fennoscandia, British Isles as well as in Baltic countries and Belarus (Schils et al. 2008).
Drainage of peatlands enhances soil aeration, resulting in anaerobic processes being replaced by aerobic processes in the aerated soil layers that change C cycling, including the exchange of carbon dioxide (CO2) between the soil and the atmosphere. Under drained conditions the C-rich soils can become net sources of CO2 emissions due to increased mineralisation of soil organic matter (Houghton et al. 1990; Hargreaves et al. 2003; Arnold et al. 2005b; Lohila et al. 2007; Minkkinen et al. 2007a; Hooijer et al. 2010). At the same time, under drained conditions a new equilibrium can be reached between C inputs with above- and below-ground litter and C loss associated with decomposition and leaching (Houghton et al. 1990; Hermans et al. 2021). For this reason, soil C stocks can even continue to increase, which is particularly characteristic of boreal forests with organic soils (Minkkinen 1999; Ojanen et al. 2010; Lohila et al. 2011). When C cycle is considered at the ecosystem level, the increase in total C stock of the forest has observed not only in drained boreal forests but also in temperate forests where the tree stands (C sequestration in tree biomass) have been able to compensate C losses from the soil (Hargreaves et al. 2003; Arnold et al. 2005b; Byrne and Farrell 2005; Meyer et al. 2013; Hommeltenberg et al. 2014). Thus, contrasting results are observed and reported so far – drained forests with organic soils can act as both a C source and sink. Afforestation can be an effective land management technique to reduce CO2 emissions, including in drained agricultural land, grassland and abandoned peat extraction fields. After afforestation of such lands, net soil CO2 emissions may decrease (Mäkiranta et al. 2007), with additional CO2 captured in tree biomass. However, it is stressed that to determine if drained organic soils in afforested land are a long-term C sink or source, the balance between soil C input and loss should be quantified over the lifespan of the stand (Hermans et al. 2021).
The intensity of CO2 emissions after drainage depends on both abiotic and biotic factors through complex mechanisms (Laiho 2006). One of the main factors affecting the forest soil C cycling is soil nutrient status and the composition of the tree species (Meyer et al. 2013). Mostly, nutrient-poor soils in conifer forests have the lowest CO2 emissions, while the greatest increase in CO2 emissions is observed from drained nutrient-rich soil in deciduous forests (Minkkinen 1999; Arnold et al. 2005a, 2005b; Ojanen et al. 2010; Lohila et al. 2011). Soil nutrient availability are closely linked to biological processes in the soil provided by a more basic pH, optimal stocks of nitrogen (N) and other elements in the soil that have a beneficial effect on the activity of microorganisms and fungi (Martin and Holding 1978; Bridgham and Richardson 1992; Kang and Freeman 1999; Stark et al. 2014). Meteorological conditions and soil temperature play an important role; soil temperature largely explains the amount of CO2 emissions (Chapman and Thurlow 1996; Silvola et al. 1996; Salm et al. 2011; Mäkiranta 2012; Jauhiainen et al. 2014). At lower temperatures, CO2 emissions are reduced, but emissions increase as temperature rise. This explains why C stock often continues to increase in boreal forests with drained organic soil, while no such trends can be observed further south. However, some authors point to exceptions. Elevated temperatures in interaction with moisture unsuitable for the activity of microorganisms can reduce CO2 emissions (Allison and Treseder 2008). Similar observations have been made in studies of mineral soils, where prolonged droughts and elevated temperatures have been found to reduce CO2 emissions from soil (Dato et al. 2009; Grünzweig et al. 2009; Joos et al. 2010).
In drained forests, the most important transporter of C from the atmosphere to the soil is a tree stand. The mechanisms by which C is brought to the soil through a tree stand differ. The sequestered C during the photosynthesis is transported from the needles and leaves of the trees to the roots. Proper drainage under appropriate conditions leads to a significant increase of stand productivity (Socha 2012; Zālītis et al. 2012; Sisak 2013), which also leads to an increase in root biomass (Laiho and Finér 1996; Bardulis et al. 2012); thus, C directly enters the soil. The second mechanism by which C gets into the soil is through tree litter and woody debris that increase after drainage (Cannell et al. 1993; Laine et al. 1996; Domisch et al. 1998; Silvan et al. 2000). Furthermore, it cannot be argued unequivocally that land drainage leads to faster decomposition of litterfall and dead wood; increased temperature and stress caused by drought after drainage can significantly slow down the decomposition of organic matter, including tree litter (Laiho et al. 2004; Cisneros-Dozal et al. 2007). In areas with sphagnum peat and poorly decomposed peat, the capillary ascent of water is weaker, and during periods of low precipitation the surface of drained soil suffers from drought and the mineralisation of organic matter becomes much slower than in undrained forests or in forests with well-decomposed peat (Domisch et al. 2000; Laiho et al. 2004). Studies of litter marked with the 14C isotope have shown that several years after the litter entered the soil, some of its C was still present in the soil (Domisch et al. 2000).
In addition to CO2 emissions, C losses are also caused by the release of methane (CH4) from the soil. Organic soils are one of the largest sources of CH4 emissions, with approximately 12% of the total CH4 emissions released from the biosphere into the atmosphere (Gorham 1991; Wuebbles and Hayhoe 2002). However, unlike CO2 emissions, which usually increase as a result of the decrease in groundwater levels, the majority of CH4 is formed in organic soils with high groundwater levels. As a rule, these are undrained soils or soils where drainage ditches no longer function. Land drainage usually leads to a reduction in CH4 emissions, and drained forests often also become a CH4-sequestering ecosystem (Martikainen et al. 1993; Regina et al. 1996; Nykänen et al. 1998; Mäkiranta et al. 2007; Minkkinen et al. 2007b; Riutta 2008; Lohila et al. 2011), which makes role of the CH4 emissions in total C cycle insignificant. Forest ecosystems are considered some of the largest CH4 consumers (Le Mer and Roger 2001), thus reducing the concentration of CH4 in the atmosphere. At the same time, drained forests still have high CH4 emissions from drainage ditches when they contain accumulated water (Best and Jacobs 1997; Minkkinen 1999; Minkkinen and Laine 2006).
In Latvia, forest is the only land use type in the Land Use, Land-Use Change and Forestry (LULUCF) sector where CO2 removals exceed greenhouse gas (GHG) emissions, although there is a downward trend in net CO2 removals, largely due to a high proportion of mature forest stands, an increase in logging volume, and natural mortality. Since 2010, the LULUCF sector has periodically become a net source of emissions in Latvia, mainly due to the reduction of CO2 removals in living biomass in forest lands, as there have been no significant changes in other land uses (Latvia National Inventory Report 2022). Apart from logging and the increase in senescence caused by changes in the age structure of forest stands, GHG emissions from the soil play a significant role in the emissions balance in forest lands. GHG emissions of forest land occur mainly from organic soils. Mineral soils on forest lands are considered emission-neutral based on the Intergovernmental Panel on Climate Change (IPCC) guidelines (Eggleston et al. 2006). According to the IPCC default CO2 emission factor (2.6 Mg CO2-C ha–1 yr–1, Hiraishi et al. 2013), annual CO2 emissions from drained organic soils in forest land in Latvia exceed 3.6 million Mg CO2 (since 2011), while the share of the area of drained organic soils is only ~12% of the total area of forest land. The results of the previous study carried out in a drained transition mire in Vesetnieki, Latvia in 2014 showed that 50 years after the construction of the drainage system, organic soils were a CO2 sink (Lazdiņš et al. 2014a, 2014b; Lazdiņš and Lupiķis 2014), which put the IPCC default emission factor for the temperate climate region applicability for hemiboreal region into question. However, the obtained results cannot be applied to all drained organic forest soils, because only a small proportion of them is known to have formed in the place of transition mires. Organic soils are one of the main sources of GHG emissions in Latvia, and a national calculation methodology including national emission factors should be used in the National GHG Inventory of such GHG emission sources (United Nations 1998; Eggleston et al. 2006). The improvement (increase of accuracy) of emission factors, based on the results of scientific research, is also necessary to obtain an objective picture of the potential contribution of various forest management measures to the reduction of GHG emissions, and to develop solutions for reducing GHG emissions in the LULUCF sector.
The aim of this study was to evaluate soil C stock changes in nutrient-rich organic forest soils after drainage using information on the long-term land surface level changes and soil properties (soil bulk density and organic C content) in drained and naturally wet (undrained) forest site types in hemiboreal region of Europe (in Latvia).
2 Materials and methods
2.1 Characteristics of research sites
The study was performed in 50 research sites representing typical hemiboreal forests in Latvia with nutrient-rich organic soils. 35 research sites were selected in drained forest land (Oxalidosa turf. mel. (Kp) and Myrtillosa turf. mel. (Ks) forest site type) and 15 research sites – in naturally wet (undrained) forest land used as control areas (Caricoso-phragmitosa (Nd), Dryopterioso-caricosa (Db) and Filipendulosa (Lk) forest site types). Although all research sites represent forests with nutrient-rich soils, subdivision of forest site types by soil nutrient status was stated: i) moderate-nutrient-rich forest site types (Ks and Nd); ii) nutrient-rich forest site types (Kp and Db/Lk). It was assumed that corresponding undrained or control area of Kp is Db/Lk forest site types, while corresponding control area of Ks is Nd forest site type according to the national forest site type classification system involving soil nutrient status (Bušs 1981). The research sites were in the western, central and eastern regions of Latvia, and were dominated by Scots pine (Pinus sylvestris (L.)), Norway spruce (Picea abies (L.) H. Karst.), silver birch (Betula pendula Roth) and black alder (Alnus glutinosa (L.) Gaertn). In the research sites, the thickness of peat varied from 80–350 cm. The stand age ranged from 7–186 years, and the growing stock ranged from 12–512 m3 ha–1. The selected Kp and Ks research sites were in forest stands, where forest drainage systems were built in 1962–1963 and reconstructed in 2005–2015. In Latvia, the mean annual temperature is 6.8 °C (climatic standard norm 1991–2020), and the mean annual precipitation is 685.6 mm (LVĢMC 2023).
In each research site, one sampling plot (area 500 m², radius 12.62 m) was selected randomly by using the QGIS application tool ‘random points’. In drained research sites, the distance from the sampling plots to the ditches ranged from 3–90 m. In undrained research sites, sampling plots were not affected by drainage, as indicated by the assigned forest site type (according to the national forest site type classification site is undrained if there is no drainage ditch adjacent to the forest compartment and understory vegetation corresponds to forest site types that are not directly affected by drainage systems). Undrained research sites were located not further than 15 km from the drained research sites, thus the meteorological conditions and soil parent material are assumed to be comparable. Summary of characteristics of the research sites is provided in Table 1, while the detailed characteristics of the research sites including center coordinates (LKS92 EPSG:3059) of sampling plot are given in the Supplementary file S1.
| Table 1. Summary of the main characteristics (including forest site type, soil nutrient status and type of dominant tree species) of the research sites included in the study (in Latvia). | ||||
| Drainage regime | Forest site type | Soil nutrient status, conditions | Type of dominant tree species | Number of research sites |
| Drained | Oxalidosa turf. mel. (Kp) | nutrient-rich, eutrophic | coniferous | 10 |
| deciduous | 2 | |||
| Myrtillosa turf. mel. (Ks) | moderate nutrient-rich, mesoeutrophic | coniferous | 17 | |
| deciduous | 6 | |||
| Naturally wet (undrained) | Dryopterioso-caricosa (Db), Filipendulosa (Lk) | nutrient-rich, eutrophic and mesoeutrophic | coniferous | 4 |
| deciduous | 4 | |||
| Caricoso-phragmitosa (Nd) | moderate nutrient-rich, mesotrophic | coniferous | 5 | |
| deciduous | 2 | |||
2.2 Assessment of land surface level changes after drainage
2.2.1 Evaluation of land surface level before drainage
Information on the land surface level before drainage was obtained from the design plans and implementation reports of the drainage systems containing records of the georeferenced topographic measurements. The design plans and implementation reports of the drainage systems have been stored in the archives of state-owned limited liability company ‘Meliorprojekts’ (Latvia) since the beginning of the 20th century. However, a large proportion of the plans are not available in the archives which limited the selection of suitable research sites.
Drainage system plans elaborated since 1955 provide historical spatially explicit topographic information of the area, including altitude markings on the designed ditch routes with an mean step of 40 m. The plans also include information on peat soil layers and peat thickness.
Drainage system plans were georeferenced or bounded to a coordinate system in the QGIS program (QGIS Development Team 2009), using a georeference tool with a built-in ‘Thin Plate Spin’ transformation method and a ‘Cubic Spline resampling’ transformation method. Roads and intersections of ditches were used as reference points. After binding, the altitude marks were digitised.
2.2.2 Evaluation of land surface level after drainage
To estimate the surface topography after drainage, levelling was performed in June 2015 in all research sites using a SEOP DS24 optical levelling device. The device’s double-step uncertainty per 1 km was 2 mm, and it had 24 × optical level magnification. The mean distance between stations was 40–60 m. The height mark was determined for each sampling plot. The rappers installed during the survey of the ditches within the framework of the Latvian State Forest Drainage System Restoration Project were used as reference points for the levelling march. In the center of each sampling plot, the telescopic survey levelling staff measurement was read 3 times: in the center of the plot, 1 m north and 1 m south of the center of the sampling plot.
2.3 Soil sampling and analysis
Soil samples were collected in each sampling plot in 3 replicates down to a depth of 80 cm in June 2015. Soil samples were collected using a soil sampling probe with a 100 cm3 steel cylinder at layers of 0–10 cm, 10–20 cm, 20–40 cm and 40–80 cm, i.e. 12 samples were collected in each sampling plot. Soil samples were transported to the laboratory of the Latvian State Forest Research Institute ‘Silava’ and were prepared for analyses according to the LVS ISO 11464:2005 standard. The following physio-chemical parameters were determined: soil bulk density (kg m–3) was calculated from the dry mass and the volume of a soil samples according to LVS ISO 11272:2014 (soil samples were dried in an oven at 105 °C until constant mass was reached), pH (CaCl2) was determined using a glass electrode in a 1:5 (volume fraction) suspension of soil in 0.01 mol L–1 calcium chloride (CaCl2) solution according to LVS ISO 10390:2002, total C concentration using elementary analysis (dry combustion) according to LVS ISO 10694:2006, and carbonate concentration using an Eijkelkamp calcimeter according to ISO 10693:1995. The organic C concentration (g kg–1) in soil was calculated as the difference between total C concentration and inorganic C (carbonate) concentration.
2.4 Data analysis
2.4.1 Change of land surface level
Land surface level changes were calculated as differences between the land surface level before drainage and after drainage for each sampling plot. To estimate the land surface level before drainage, the digitised topographic survey data were interpolated with the ‘kriging’ or Gaussian regression method to obtain a surface terrain model. Interpolation was performed in the software R using the ‘kriging’ function, which is built into the ‘kriging’ package (Suppl. file S2) (Olmedo 2014). To work with data in the QGIS environment, ‘kriging’ interpolation was also performed with the ‘krige.conv’ function, which is built into the ‘geoR’ package (Ribeiro Jr and Diggle 2015). The data were exported as a *.csv file, converted to a ‘shp’ file and rasterised in a QGIS environment to calculate the surface subsidence in the plots (Suppl. file S2).
2.4.2 Soil carbon stock changes
To calculate soil carbon stock changes after drainage it was assumed that i) the formation of peat in the undrained and drained research sites before drainage was similar and ii) in depth at which the impact of drainage is minimal (i.e below the groundwater level by taking into account of the peat subsidence), C stocks in the corresponding soil layers in the drained and undrained areas are similar (Lazdiņš et al. 2014a, 2014b; Lazdiņš and Lupiķis 2014). Five research sites were excluded from soil C stock calculation because no conformity of the soil bulk density in drained and corresponding undrained research sites was observed.
Soil carbon stock in layers of 0–10 cm, 10–20 cm, 20–40 cm and 40–80 cm was calculated for both drained and undrained research sites. However, as the peat has subsided by Δh cm after drainage, soil samples collected down to a depth of 80 cm in the undrained area represent a peat layer with thickness of less than 80 cm at drained sites (layer from 0to 80-Δh cm illustrated in Fig. 1).
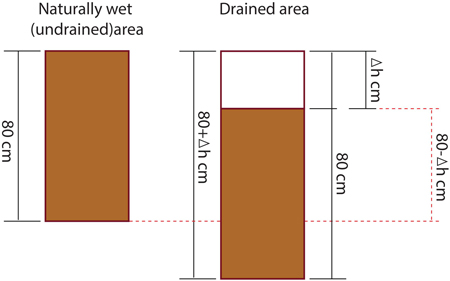
Fig. 1. Significance of peat subsidence in the calculation of soil carbon stocks.
Therefore, while to express soil C stock in undrained soil down to a depth of 80 cm direct measurements were used (sum of C stock in layers 0–10, 10–20, 20–40 and 40–80 cm), cumulative soil C stock in drained sites was calculated by summing C stock in peat layers of 0–40 cm and 40 to 80-Δh cm. To calculate C stock in 0–40 cm layer, directly measured C stock in layers at depth of 0–10 cm, 10–20 cm and 20–40 cm was summed. While C stock for a depth of 40 cm to 80-Δh in drained sites was calculated using the integral of the regression equation obtained by comparing the C stock from a depth of 30 cm (midpoint of layer of 20–40 cm) to a depth of 80 cm. It was assumed that C stock at midpoints of layers of 20–40 cm and 40–80 cm was equal to directly measured C stock at depths of 20–40 cm and 40–80 cm, respectively. Consequently, the total C stock in drained sites in a layer 0to 80-Δh cm was calculated by Eq. 1 where resulting value is the C stock and the variable value is the depth of the soil layer:
![]()
where:
![]() = soil carbon stock in the drained area at depth from 0to 80-Δh cm, Mg ha–1;
= soil carbon stock in the drained area at depth from 0to 80-Δh cm, Mg ha–1;
![]() = directly measured soil carbon stock in the drained areas at depth from 0to 40 cm, Mg ha–1;
= directly measured soil carbon stock in the drained areas at depth from 0to 40 cm, Mg ha–1;
a + bx = linear regression equation according to the least squares method, where the variable value is the soil depth (cm) and the resulting value is the mean carbon stock (Mg ha–1) at the corresponding depth in a 1 cm thick soil layer (for Kp a = 9.18 ± 0.69 and b = –0.013 ± 0.012; for Ks a = 9.63 ± 0.63 and b = –0.026 ± 0.010).
Soil C stock change after drainage, was calculated as a difference between estimated theoretical C stock in the drained sites before drainage and after the drainage in layer 0to 80-Δh cm (results acquired by Eq. 1). Theoretical C stock in the 0–80 cm layer before drainage in drained sites was reconstructed by summing the measured C stocks in different soil layers in the undrained sites corrected based on differences in C stock at 80 cm depth between undrained and drained area (Eq. 2):

where:
![]() = theoretical carbon stock at a-b cm layer (for instance, 0–10 cm, 10–20 cm, etc.) before the drainage, Mg ha–1;
= theoretical carbon stock at a-b cm layer (for instance, 0–10 cm, 10–20 cm, etc.) before the drainage, Mg ha–1;
![]() = carbon stock at a-b cm layer (for instance, 0–10 cm, 10–20 cm, etc.) in undrained area, Mg ha–1;
= carbon stock at a-b cm layer (for instance, 0–10 cm, 10–20 cm, etc.) in undrained area, Mg ha–1;
![]() = carbon stock in a 1 cm thick soil layer at depth of 80-Δh cm, where Δh corresponds to the subsidence of the peat in cm (theoretical value estimated by Eq. 1), Mg ha–1;
= carbon stock in a 1 cm thick soil layer at depth of 80-Δh cm, where Δh corresponds to the subsidence of the peat in cm (theoretical value estimated by Eq. 1), Mg ha–1;
![]() = carbon stock in a 1 cm thick soil layer at 80 cm depth in undrained area, Mg ha–1;
= carbon stock in a 1 cm thick soil layer at 80 cm depth in undrained area, Mg ha–1;
b = lower border of the estimated soil layer, cm;
a = upper border of the estimated soil layer, cm.
2.4.3 Statistical analysis
Statistical analyses were conducted using software R and ‘LibreOffice’. Normal distribution and homogeneity of variance of the data was tested using a Shapiro–Wilk normality test and Quantile-Comparison Plot (function ‘qqPlot()’ from R package ‘car’). Significance of difference in between research sites grouped, for instance, by forest site type or dominant tree species were evaluated using the Wilcoxon rank sum test with continuity correction; a significance level of 0.05 was used.
In the Results section, mean values of peat subsidence, physical and chemical parameters and soil C stock changes ± uncertainty expressed as a 95% confidence interval are presented. The variation of peat subsidence within one sampling plot resulting from the variable in microrelief formed by wrinkles, tree roots etc. was evaluated; it reached 0.6 cm. It was assumed that the accuracy of the historical measurements of land surface level was the same as that of remeasured altitude marks in 2015 and total uncertainty of land surface level was ±2.0 cm.
3 Results
3.1 Peat subsidence after drainage
After drainage, the subsidence of peat was observed. The level of the land surface in the studied stands decreased by a mean of 27.1 ± 4.0 cm. A significant difference in peat subsidence between different groups of forest site types was observed. In Kp forest site type, the level of the land surface decreased by 37.0 ± 4.8 cm, while in the Ks forest site type – by 23.3 ± 4.8 cm. Difference in subsidence of peat was also found between stands with different type of dominant tree species. In deciduous tree stands, the peat subsided by 38.0 ± 7.8 cm, while in coniferous tree stands by 22.9 ± 4.1 cm. Differences in peat subsidence between Ks and Kp forest site types as well as between deciduous and coniferous tree stands indicated that peat subsidence was more intense in forest site types with higher nutrient availability (Fig. 2).
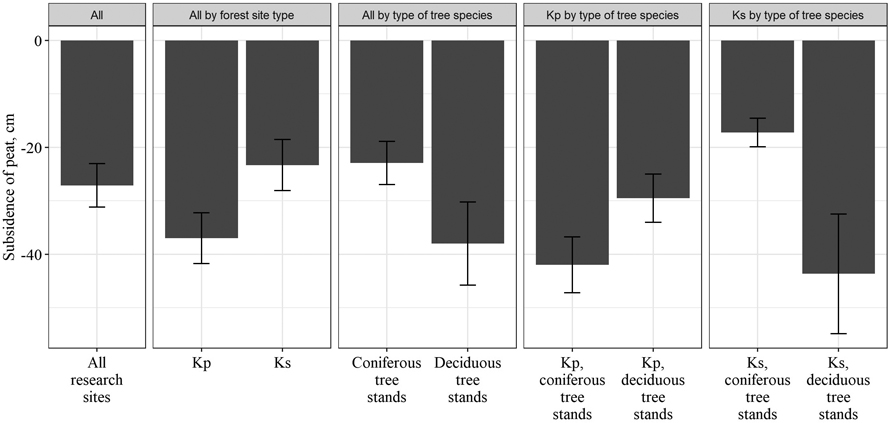
Fig. 2. Subsidence of peat after drainage in different forest site types (Kp – Oxalidosa turf. mel.; Ks – Myrtillosa turf. mel.).
The relationship between the magnitude of peat subsidence and distance from the ditch is shown in Fig. 3. Although peat subsidence by the ditch was expected to be more pronounced, we did not observe such a trend in the sampling plots. We evaluated magnitude of peat subsidence to the thickness of the peat layer and to the combined factor of distance from the ditch and thickness of the peat layer; however, no relationships were found.
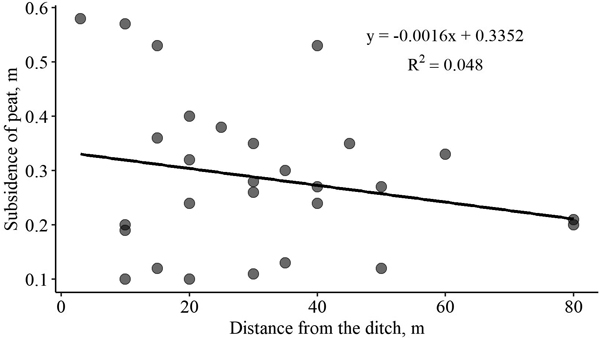
Fig. 3. Relationship between peat subsidence after drainage and distance from the ditch in forest stands with drained organic soils.
3.2 Soil physical and chemical parameters
In drained research sites (Ks and Kp forest site types), soil bulk density in the upper peat layers was significantly higher than in the corresponding undrained research sites (Nd and Db/Lk forest site types, Table 2). The largest difference was observed in the 0–10 cm peat layer, where the bulk density in Ks forest site types was by 43 kg m–3 or 26% higher than in Nd forest site type, while the difference between Kp and Db/Lk was 31 kg m–3 or 16%. Significant difference in soil bulk density between drained and undrained research sites remained also at a layer of 10–20 cm, but in the deeper peat layers, the difference was no longer significant. In addition, at a layer of 40–80 cm, mean soil bulk density in Nd forest site type (165 ± 4 kg m–3) was found to be significantly higher than in the corresponding layer of Ks forest site type (148 ± 7 kg m–3), which is contrary to the assumption that soil density in drained areas is higher or equal to that of the corresponding naturally wet (pristine) areas. In this case, the obtained results indicate the need to make adjustments to the calculation of C stocks. It should be noted that the groundwater level in both drained and undrained research sites was around 40 cm bellow the land surface; therefore, it also can be assumed that peat properties at a layer of 40–80 cm were not affected by drainage.
| Table 2. Soil bulk density (mean values ± confidence intervals, kg m–3) in different soil layers in hemiboreal forests in Latvia with drained and undrained organic soils depending on forest site type and type of dominant tree species. | ||||||
| Drainage regime | Forest site types | Type of dominant tree species | Soil layer | |||
| 0–10 cm | 10–20 cm | 20–40 cm | 40–80 cm | |||
| Drained | Oxalidosa turf. mel. (Kp) | all | 191.1 ± 10.05 | 190.3 ± 8.96 | 165.2 ± 9.58 | 156.5 ± 4.79 |
| deciduous | 190.7 ± 16.05 | 189.2 ± 15.18 | 184.1 ± 12.37 | 161.2 ± 4.13 | ||
| coniferous | 191.3 ± 13.69 | 191.1 ± 11.73 | 152.7 ± 11.86 | 153.4 ± 7.49 | ||
| Myrtillosa turf. mel. (Ks) | all | 165.2 ± 6.92 | 171.8 ± 6.57 | 155.2 ± 6.42 | 147.7 ± 6.82 | |
| deciduous | 176.2 ± 13.25 | 165.5 ± 13.50 | 151.9 ± 7.21 | 138.5 ± 7.49 | ||
| coniferous | 161.5 ± 7.83 | 173.9 ± 7.50 | 156.3 ± 8.24 | 150.8 ± 8.56 | ||
| Naturally wet (undrained) | Dryopterioso-caricosa (Db), Filipendulosa (Lk) | all | 159.8 ± 6.63 | 175.6 ± 6.75 | 160.2 ± 7.10 | 145.9 ± 8.21 |
| Caricoso-phragmitosa (Nd) | all | 121.8 ± 8.31 | 134.9 ± 8.38 | 155.9 ± 6.33 | 165.0 ± 4.21 | |
| All | All | deciduous | 181.1 ± 9.00 | 173.4 ± 9.35 | 162.6 ± 7.72 | 146.0 ± 5.25 |
| coniferous | 167.4 ± 6.95 | 177.3 ± 6.08 | 155.6 ± 6.28 | 151.3 ± 5.96 | ||
The mean soil bulk density in Kp forest site type was higher than in Ks forest site type in all studied peat layers. In 0–10 cm peat layer, the difference in soil bulk density between Kp and Ks was the largest (26 kg m–3, corresponding to 14%), while in the deeper soil layers the difference gradually decreased (for instance, 9 kg m–3, corresponding to 6% at the 40–80 cm layer). Thus, more intensive mechanical peat subsidence and/or faster mineralisation of organic matter was observed in more nutrient-rich Kp forest site type, which was also confirmed by the data of peat subsidence measurements and C stock change calculations. Similarly to drained research sites, also in undrained research sites soil bulk density was higher in more nutrient-rich forest site types (Db/Lk).
In all studied forest site types excluding Db/Lk, the mean soil bulk density in the deepest studied soil layer (40–80 cm) was lower compared to the upper soil layers (0–40 cm). This may indicate the impact of a periodic decrease of groundwater level that have contributed to soil compaction and/or mineralisation of organic matter. This is also indicated by the differences in degree of decomposition of the peat between the upper and deeper soil layers. In Ks and Kp forest site types, peat was highly decomposed in the upper soil layers, while weakly or moderately decomposed in the deeper soil layers.
When comparing the mean soil bulk density in deciduous and coniferous stands within the same forest site type, no significant differences were observed. When comparing the mean soil bulk density in deciduous and coniferous stands when all studied forest site types are pooled, at the 0–10 cm layer deciduous stands had a higher soil density (181 ± 9 kg m–3) than conifer stands (167 ± 7 kg m–3); however, the difference was not statistically significant. Also no significant differences were found in deeper soil layers.
In studied soil layers down to 20 cm depth, mean C content in peat in Kp forest site type was significantly higher than in corresponding Db/Lk forest site types, while the difference was not significant in deeper soil layers (Table 3). Significant differences were not observed when comparing Ks forest site type with the corresponding Nd forest site type. In general, the mean C content in peat is significantly lower in more nutrient-rich forest site types (Kp and Db/Lk) in comparison to less nutrient-rich forest site types (Ks and Nd).
| Table 3. Carbon content (mean values ± confidence intervals, g kg–1) in different soil layers in hemiboreal forests in Latvia with drained and undrained organic soils depending on forest site type and type of dominant tree species. | ||||||
| Drainage regime | Forest site types | Type of dominant tree species | Soil layer | |||
| 0–10 cm | 10–20 cm | 20–40 cm | 40–80 cm | |||
| Drained | Oxalidosa turf. mel. (Kp) | all | 501.9 ± 4.1 | 524.7 ± 3.6 | 537.3 ± 8.4 | 538.3 ± 10.8 |
| deciduous | 497.0 ± 2.1 | 542.6 ± 0.8 | 543.9 ± 1.7 | 540.9 ± 3.5 | ||
| coniferous | 505.2 ± 2.9 | 512.8 ± 3.0 | 532.9 ± 5.8 | 536.5 ± 8.4 | ||
| Myrtillosa turf. mel. (Ks) | all | 520.9 ± 3.4 | 560.2 ± 4.1 | 569.9 ± 7.7 | 553.0 ± 11.7 | |
| deciduous | 504.8 ± 1.7 | 572.2 ± 3.5 | 577.2 ± 6.8 | 574.7 ± 3.9 | ||
| coniferous | 525.5 ± 5.3 | 559.1 ± 5.1 | 569.5 ± 10.0 | 544.7 ± 14.2 | ||
| Naturally wet (undrained) | Dryopterioso-caricosa (Db), Filipendulosa (Lk) | all | 478.6 ± 2.9 | 498.1 ± 2.9 | 521.2 ± 9.2 | 523.0 ± 20.0 |
| Caricoso-phragmitosa (Nd) | all | 527.6 ± 4.5 | 541.8 ± 5.3 | 575.0 ± 9.1 | 593.1 ± 18.5 | |
| All | All | deciduous | 502.2 ± 2.9 | 562.3 ± 4.1 | 566.1 ± 8.2 | 563.4 ± 9.2 |
| coniferous | 521.4 ± 3.5 | 549.8 ± 3.6 | 562.2 ± 6.9 | 543.0 ± 11.3 | ||
At the 0–10 cm layer, mean C content in peat was significantly lower in deciduous tree stands in comparison to conifer stands; moreover, this trend could be observed in both Ks and Kp forest site types. At a layer of 10–20 cm, the opposite situation occurred – the C content was higher in deciduous stands.
Although the difference in mean peat pH(CaCl2) between drained and corresponding undrained research sites was not statistically significant, more acidic peat was observed in drained forest site types (Table 4). In addition, in drained research sites (Ks and Kp), peat pH at 0–10 cm layer was more acidic than at 40–80 cm layer. This difference was not observed in the undrained research sites (Nd and Db/Lk), where the peat pH did not differ significantly between upper and lower studied peat layers. Both in drained and undrained research sites, a more acidic peat pH was found in the less nutrient-rich forest site types (Ks and Nd) compared to more nutrient-rich forest site types (Kp and Db/Lk). No significant differences were found in peat pH between deciduous and coniferous tree stands.
| Table 4. Soil pH (mean soil pH (CaCl2) values ± confidence intervals) in different soil layers in hemiboreal forests in Latvia with drained and undrained organic soils depending on forest site type and type of dominant tree species. | ||||||
| Drainage regime | Forest site types | Type of dominant tree species | Soil layer | |||
| 0–10 cm | 10–20 cm | 20–40 cm | 40–80 cm | |||
| Drained | Oxalidosa turf. mel. (Kp) | all | 4.7 ± 0.3 | 4.9 ± 0.3 | 5.0 ± 0.3 | 5.2 ± 0.2 |
| deciduous | 4.4 ± 0.6 | 4.4 ± 0.6 | 4.5 ± 0.6 | 5.0 ± 0.3 | ||
| coniferous | 4.9 ± 0.2 | 5.2 ± 0.3 | 5.3 ± 0.3 | 5.4 ± 0.3 | ||
| Myrtillosa turf. mel. (Ks) | all | 3.1 ± 0.1 | 3.3 ± 0.1 | 3.4 ± 0.1 | 4.2 ± 0.2 | |
| deciduous | 3.3 ± 0.2 | 3.3 ± 0.1 | 3.4 ± 0.1 | 4.4 ± 0.5 | ||
| coniferous | 3.1 ± 0.1 | 3.3 ± 0.2 | 3.4 ± 0.1 | 4.2 ± 0.2 | ||
| Naturally wet (undrained) | Dryopterioso-caricosa (Db), Filipendulosa (Lk) | all | 5.1 ± 0.2 | 5.0 ± 0.3 | 5.2 ± 0.3 | 5.0 ± 0.3 |
| Caricoso-phragmitosa (Nd) | all | 3.4 ± 0.3 | 3.2 ± 0.2 | 3.3 ± 0.2 | 3.4 ± 0.3 | |
| All | All | deciduous | 3.7 ± 0.3 | 3.7 ± 0.3 | 3.8 ± 0.3 | 4.6 ± 0.3 |
| All | coniferous | 3.5 ± 0.2 | 3.7 ± 0.2 | 3.8 ± 0.2 | 4.4 ± 0.2 | |
3.3 Changes in soil carbon stock after drainage
After drainage, in Kp forest site type, a significant reduction of soil C stock in 0–80 cm layer was observed (Fig. 4); soil C stock decreased by 180 ± 84 Mg ha–1 or by 4.98 ± 1.58 Mg ha–1 yr–1 in a 53-year period after drainage. In Ks forest site type, soil C stock decreased by 9.8 ± 82.2 Mg ha–1 over 53 years or by 0.19 ± 1.31 Mg ha–1 yr–1, and the changes were not significant. Furthermore, in Ks forest site type dominated by coniferous trees, an increase in soil C stock was detected; the soil C stock increased by 0.46 ± 1.50 Mg ha–1 yr–1, although the increase was not statistically significant. At the same time, in Ks forest site type dominated by deciduous tree, the C stock in soil decreased by 3.40 ± 1.62 Mg ha–1 yr–1. In Kp forest site type, the opposite situation occurred: in deciduous tree stands, soil C stock decreased more slowly (by 4.05 ± 1.47 Mg ha–1 yr–1) than in coniferous stands (by 5.29 ± 1.98 Mg ha–1 yr–1), although the difference in reduction between deciduous and coniferous stands was not significant. Thus, an ambiguous effect of type of dominated tree species in stand on the soil C stock changes was not observed. To draw conclusions about species-specific effects on the soil C stock changes, it is necessary to increase the number of research sites included in the study. The need to increase the sample group is also indicated by the comparison of all coniferous and deciduous tree stands, which did not show statistically significant differences, although the loss of soil C stock in coniferous stands was still smaller (0.48 ± 1.47 Mg ha–1 yr–1) than in deciduous trees stands (3.43 ± 1.56 Mg ha–1 yr–1).
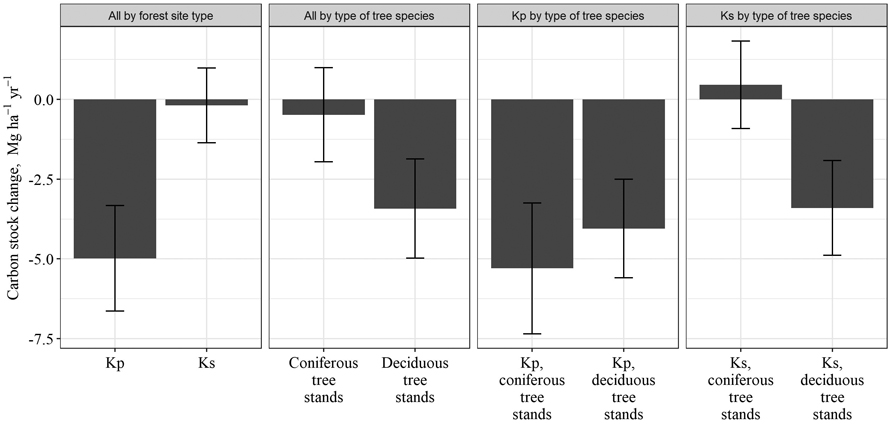
Fig. 4. Mean annual changes in soil carbon stock in drained organic soils over 53 years after drainage in Oxalidosa turf. mel. (Kp) and Myrtillosa turf. mel. (Ks) forest site types in Latvia.
4 Discussion
The study demonstrates a significant subsidence of the peat both in Ks forest site type (by an mean of 23.3 ± 4.8 cm) and Kp forest site type (by an mean of 37.0 ± 4.8 cm) after drainage (during the 53-years period after drainage). In moderate nutrient-rich Ks forest site type, the main reason for subsidence is the compaction of the peat layer; however, it is also affected by the mineralisation of organic matter (especially in nutrient-rich Kp forest site type). The dominating role of soil compaction was demonstrated in Ks forest site type where no significant reduction in soil C stock after drainage was observed, thus the mineralisation of organic matter and CO2 emissions from the soil was not the main cause of reduction of the thickness of the peat layer. Similar results were obtained in study in Canada conducted by Glenn et al. (1993), whose calculations underlined that only 10% of peat subsidence is associated with CO2 emissions. Peat subsidence as a result of drainage has also been reported in studies conducted in Finland, for instance, Minkkinen and Laine (1998a) found peat subsidence by 22 cm due to compaction, while Lukkala (1949) found subsidence of 14–43 cm and indicated that the most rapid peat subsidence occurred immediately after drainage. In the previous study implemented in Latvia in 2014, the observed mean peat subsidence was 26 cm (Lupiķis and Lazdiņš 2015).
With the peat subsidence, the density of the soil increases, especially in the upper layers. Our results by comparing soil bulk density in drained and undrained research sites showed that in the upper soil layers (down to 20 cm depth) soil density was increased significantly after drainage in both Ks and Kp forest site types. Similar results were reported by previous studies, for instance, Pitkänen et al. (2013) reported the mean soil bulk density of undrained peat profile (0–60 cm) was 55 kg m–3, while in the roughly-corresponding 0–30 cm of drained soil profile the mean soil bulk density value was 79 kg m–3. Minkkinen and Laine (1998b) found even a higher increase in peat density at a layer of 0–20 cm, from 40 kg m–3 before drainage to 120 kg m-3 after drainage. Soil compaction is rapid especially during the first 2–3 years after drainage when the density of peat at the topsoil layer (0–30 cm layer) can increase by 40–50%, and by more than 100% at a layer of 0–10 cm (Rothwell et al. 1996; Silins 1997). This is caused by the destruction of large soil pores due to the replacement of water with air. However, soil compaction is also associated with humification processes – the more peat decomposes, the higher its density (Silc and Stanek 1977). Drainage can impact soil density at depths of more than 80 cm (Minkkinen and Laine 1998b), which is probably the case in the nutrient-rich drained organic soils included in this study, potentially resulting in overestimates of the calculated CO2 emissions in comparison to real C losses.
Results of our study indicated that C losses from the soil after drainage in Kp forest site type significantly exceeded C removal by soil, resulting in an mean reduction in C stocks by 4.98 Mg C ha–1 yr–1. No significant changes in C stock were detected in the Ks forest site type. In general, results obtained so far in different studies on the changes in soil C stock after drainage are contradictory. Some studies report a decline in C stocks (Brække and Finér 1991; Sakovets and Germanova 1992), while others report an increase (Minkkinen and Laine 1998a; Turetsky et al. 2011; Lupiķis and Lazdiņš 2015; Minkkinen et al. 2018). According to the results obtained in the Ks forest site type, where coniferous trees were the dominant tree species, the C stock even slightly increased, while in deciduous stands, it decreased. Other authors have also reported that conifers have a positive effect on the increase of soil C stock (Arnold et al. 2005a, 2005b). This may be due to the lignin-rich litter produced by coniferous trees (Berg and Lundmark 1987). Our study also demonstrates that higher nutrient availability in organic forest soil can result in higher C losses after drainage. Similar conclusions have been obtained by other researchers (Minkkinen and Laine 1998a; Minkkinen et al. 2007a). However, there are studies demonstrating that soil nutrient availability does not have a significant effect on soil C stocks (Simola et al. 2012).
In general, the calculated C losses from soil are highly uncertain; the uncertainty is ±1.6 Mg ha–1 yr–1 and ±1.3 Mg ha–1 yr–1 in the Kp and Ks forest site type, respectively. The uncertainty of the latest IPCC default emission factor for drained organic soils in forest land in the temperate climate region (2.6 Mg CO2-C ha–1 yr–1, Hiraishi et al. 2013) is ±0.7 Mg ha–1 yr–1 (95% confidence interval is from 2.0 to 3.3 Mg CO2-C ha–1 yr–1). This uncertainty is of the mean value of different studies representing different regions. By inclusion of the developed CO2 emission factors into the national GHG inventory, the uncertainty of the calculated results will increase. To reduce uncertainty below that provided by the default IPCC 2014 Wetlands supplement (Hiraishi et al. 2013), it is necessary to increase the number of measurement sites at least to 60 research sites for each forest site type. As it might not be possible to achieve the necessary extent due to the lack of relevant undrained research sites and/or historical information, other methods, like long-term GHG flux measurements and C input monitoring, should be applied to increase the accuracy of CO2 emission factor.
Using the default CO2 emission factor for the drained organic soils in forest land in the temperate climate region provided by the IPCC guidelines (2.6 Mg CO2-C ha–1 yr–1, Hiraishi et al. 2013), the C losses from drained organic soils in forest land are equal to range from 3.6 to 3.9 million Mg CO2 yr–1 during the 2011–2021 in Latvia. Following this assumption, drained organic soils in forest land are one of the largest key source of GHG emissions in the LULUCF sector in Latvia. The CO2 emission factors for nutrient-rich drained organic soils elaborated in the study are 4.98 ± 1.58 Mg C ha-1 yr-1 for Kp forest site type and 0.19 ± 1.31 Mg C ha–1 yr–1 for Ks forest site type. Thus, estimated C stock changes in moderate nutrient-rich drained organic soils (Ks forest site type) are not statistically significant. An earlier study in Latvia found that nutrient-poor drained organic soil is a net sink of C removals (–0.36 ± 0.91 Mg C ha–1 yr–1); however, the study was implemented in only three study sites in drained transition mire and the uncertainty is high (Lupiķis and Lazdiņš 2015). Nevertheless, this result is in line with our findings in moderate nutrient-rich drained organic soils (Ks forest site type). To characterise mean C losses from all drained organic soils in forest land in Latvia (Table 5), the weighted mean CO2 emission factor was calculated using the information on the distribution of forest site types according to the results of the 3rd cycle of the National Forest Inventory (NFI) and assuming that after drainage there are no soil C losses from the nutrient-poor drained organic soils in the Vacciniosa turf. mel. (Km) and Callunosa turf. mel. (Kv) site types as well as in moderate nutrient-rich Ks forest site type (mean CO2 emission factor is equal to 0.00 ± 1.24 Mg C ha–1 yr–1). The resulting weighted mean soil CO2 emission factor for all drained organic forest soils is 1.08 ± 1.31 Mg C ha-1 yr–1. The obtained CO2 emission factor is considerably smaller than the default emission factor according to the IPCC guidelines (2.6 Mg CO2-C ha–1 yr–1, Hiraishi et al. 2013). Using the elaborated factor in calculations of CO2 emissions from drained organic forest soils in Latvia would decrease the CO2 emissions from drained organic soils by mean 2.2 million Mg of CO2 yr–1 during the period of 2011–2021 if compared to the default CO2 emission factor for the temperate climate region provided by the IPCC guidelines (2.6 Mg CO2-C ha–1 yr–1, Hiraishi et al. 2013).
| Table 5. Weighted mean CO2 emission factor for drained organic soils in forest land in Latvia based on distribution of different forest site types and emission factors obtained in the study. | |||||
| Parameters | Forest site types with drained organic soils | All forests with drained organic soils | |||
| Callunosa turf. mel. (Kv) | Vacciniosa turf. mel. (Km) | Myrtillosa turf. mel. (Ks) | Oxalidosa turf. mel. (Kp) | ||
| Total area in Latvia according to the results of the 3rd cycle of the NFI, kha | 19.9 | 68.5 | 242.1 | 91.4 | 421.9 |
| Emission factor, Mg CO2-C ha–1 yr–1 | 0.00 ± 1.24 | 4.98 ± 1.58 | 1.08 ± 1.31 | ||
Within this study, the research sites represent drained nutrient-rich forest areas with deep peat layer (thicker than 80 cm). It can be assumed as a limiting factor for applying emission factors to the national level, because the mean proportion of the organic matter or peat layer (H horizon) in the top 70 cm soil layer in forests with drained organic soils in Latvia is 54 ± 2% of the top 70 cm (Bārdule et al. 2021). Study in Finland showed that there were no clear differences in GHG emissions among the plots with different thickness of peat layer (Yli-Halla et al. 2022). However, in studies conducted so far, impact of the thickness of peat layer on CO2 emissions has not been explicitly considered (Yli-Halla et al. 2022). Thus, one of the main directions of the further research is covering not only a larger number of research sites in general to reduce uncertainty of elaborated CO2 emissions factors, but also covering research sites with both shallow and deep peat layer to obtain more representative data set for drained forest land with organic soils in Latvia.
Results obtained within this study reflect soil C stock changes in nutrient-rich organic forest soils after drainage conducted in 1962–1963. In general, the response of peatlands including those drained for forestry to further global climate warming remains somewhat uncertain (Loisel et al. 2021). However, the general assumption is that along with the warming climate, CO2 emissions are likely to increase due to enhanced decomposition of organic matter (Hiraishi et al. 2013; Chaudhary et al. 2020). In addition, increased evapotranspiration as a result of global warming can lead to lowered groundwater level (Hogg et al. 1992). At the same time, drought period can significantly decrease gross primary production as well as ecosystem respiration (Minkkinen et al. 2018). Simultaneously, increased regional drought events can lead to drying of organic soil and thus enhancing risks of wildfires (Turetsky et al. 2011; Hiraishi et al. 2013; Chaudhary et al. 2020). It is stressed that management including prevention of wildfires is one of the key drivers in determining the future GHG balance of drained peatland ecosystems (Petrescu et al. 2015). Thus, other direction of the further research is elaboration of climate-sensitive emission factors for drained organic soils.
5 Conclusions
The study in hemiboreal forest land with nutrient-rich organic soils demonstrated a significant soil subsidence after drainage in both studied forest site types (Oxalidosa turf. mel. and Myrtillosa turf. mel.). Simultaneously, there was a significant difference in soil C stock changes after drainage between both forest site types representing differences in soil nutrient status. In nutrient-rich soils (Oxalidosa turf. mel. forest site type), C stock decreased by 4.98 ± 1.58 Mg C ha–1 yr–1, while no statistically significant changes in soil C stock (0.19 ± 1.31 Mg C ha–1 yr–1) were observed in moderate nutrient-rich soils (Myrtillosa turf. mel. forest site type). Thus, in moderate nutrient-rich forest site type, the main driver of the subsidence of the peat layer is the physical processes of compaction, rather than CO2 emissions from soil, while in nutrient-rich forest site type, contribution of CO2 emissions from soil to subsidence of the peat layer is significant.
Author’s contributions
Conceptualization, Andis Lazdiņš; methodology, Ainārs Lupiķis and Andis Lazdiņš.; data curation, Kaspars Polmanis and Aldis Butlers; writing – original draft preparation, Ainārs Lupiķis and Kaspars Polmanis; writing – review and editing, Arta Bārdule, Aldis Butlers and Santa Kalēja; supervision, Andis Lazdiņš. All authors have read and agreed to the published version of the manuscript.
Acknowledgments
The contribution of Andis Lazdiņš, Arta Bārdule, Santa Kalēja and Kaspars Polmanis was funded by the by European Regional Development Fund project “Evaluation of factors affecting greenhouse gas (GHG) emissions reduction potential in cropland and grassland with organic soils”, No 1.1.1.1/21/A/031. The contribution of Aldis Butlers was funded by the LIFE Programme project “Demonstration of climate change mitigation measures in nutrients rich drained organic soils in Baltic States and Finland”, LIFE OrgBalt, No. LIFE18 CCM/LV/001158. The contribution of Ainārs Lupiķis was funded by the LIFE Programme project “Sustainable and responsible management and re-use of degraded peatlands in Latvia”, LIFE REstore, No. LIFE14 CCM/LV/001103.
Funding
This research was funded by the research project “Development of greenhouse gas emission factors and decision support tools for management of peatlands after peat extraction” (No. 1.1.1.1/19/A/064).
Declaration of openness of research materials and data
The research materials and data presented here is available on request from the corresponding author (kaspars.polmanis@silava.lv).
References
Allison SD, Treseder KK (2008) Warming and drying suppress microbial activity and carbon cycling in boreal forest soils. Glob Chang Biol 14: 2898–2909. https://doi.org/10.1111/j.1365-2486.2008.01716.x.
Arnold KV, Nilsson M, Hånell B, Weslien P, Klemedtsson L (2005a) Fluxes of CO2, CH4 and N2O from drained organic soils in deciduous forests. Soil Biol Biochem 37: 1059–1071. https://doi.org/10.1016/j.soilbio.2004.11.004.
Arnold KV, Weslien P, Nilsson M, Svensson BH, Klemedtsson L (2005b) Fluxes of CO2, CH4 and N2O from drained coniferous forests on organic soils. For Ecol Manag 210: 239–254. https://doi.org/10.1016/j.foreco.2005.02.031.
Bārdule A, Butlers A, Lazdiņš A, Līcīte I, Zvirbulis U, Putniņš R, Jansons A, Adamovičs A, Razma Ģ (2021) Evaluation of soil organic layers thickness and soil organic carbon stock in hemiboreal forests in Latvia. Forests 12, article id 840. https://doi.org/10.3390/f12070840.
Bardulis A, Jansons A, Liepa I (2012) Below-ground biomass production in young stands of Scots pine (Pinus sylvestris L.) on abandoned agricultural land. Proceedings of the International Scientific Conference Research for Rural Development 2012, Jelgava, Latvia, 16–18 May 2012. Latvia University of Agriculture, Jelgava, Latvia, pp. 49–54.
Berg B, Lundmark J (1987) Decomposition of needle litter in Pinus contorta and Pinus sylvestris monocultures – a comparison. Scand J For Res 2: 3–12. https://doi.org/10.1080/02827588709382441.
Best EPH, Jacobs FHH (1997) The influence of raised water table levels on carbon dioxide and methane production in ditch-dissected peat grasslands in the Netherlands. Ecol Eng 8: 129–144. https://doi.org/10.1016/s0925-8574(97)00260-7.
Brække FH, Finér L (1991) Fertilization effects on surface peat of pine bogs. Scand J For Res 6: 433–449. https://doi.org/10.1080/02827589109382681.
Bridgham SD, Richardson CJ (1992) Mechanisms controlling soil respiration (CO2 and CH4) in southern peatlands. Soil Biol Biochem 24: 1089–1099. https://doi.org/10.1016/0038-0717(92)90058-6.
Bušs K (1981) Forest ecology and typology. Zinātne, Rīga.
Byrne A, Farrell EP (2005) The effect of afforestation on soil carbon dioxide emissions in blanket peatland in Ireland. Forestry 78: 217–227. https://doi.org/10.1093/forestry/cpi020.
Byrne KA, Chonjicki B, Christensen TR, Drosler M, Freibauer A, Friborg T, Frolking S, Lindroth A, Mailhammer J, Malmer N, Selin P, Turunen J, Valentini R, Zetterberg L (2004) EU peatlands: current carbon stocks and trace gas fluxes. Carbo-Europe Report, Christensen TR, Friborg T (eds) [Dataset] https://scholars.unh.edu/cgi/viewcontent.cgi?article=1489&context=earthsci_facpub. Accessed 6 October 2023.
Cannell MGR, Dewar RC, Pyatt DG (1993) Conifer plantations on drained peatlands in Britain: a net gain or loss of carbon? Forestry 66: 353–369. https://doi.org/10.1093/forestry/66.4.353.
Chapman SJ, Thurlow M (1996) The influence of climate on CO2 and CH4 emissions from organic soils. Agric For Meteorol 79: 205–217. https://doi.org/10.1016/0168-1923(95)02283-X.
Chaudhary N, Westermann S, Lamba S, Shurpali N, Sannel ABK, Schurgers G, Miller PA, Smith B (2020) Modelling past and future peatland carbon dynamics across the pan-Arctic. Glob Chang Biol 26: 4119–4133. https://doi.org/10.1111/gcb.15099.
Cisneros-Dozal LM, Trumbore SE, Hanson PJ (2007) Effect of moisture on leaf litter decomposition and its contribution to soil respiration in a temperate forest. J Geophys Res 112: 1–10. https://doi.org/10.1029/2006jg000197.
Dato GD, de Angelis PD, Sirca C, Beier C (2009) Impact of drought and increasing temperatures on soil CO2 emissions in a Mediterranean shrubland (gariga). Plant Soil 327: 153–166. https://doi.org/10.1007/s11104-009-0041-y.
Domisch T, Finér L, Karsisto M, Laiho R, Laine J (1998) Relocation of carbon from decaying litter in drained peat soils. Soil Biol Biochem 30: 1529–1536. https://doi.org/10.1016/s0038-0717(97)00233-2.
Domisch T, Finér L, Laiho R, Karsisto M, Laine J (2000) Decomposition of Scots pine litter and the fate of released carbon in pristine and drained pine mires. Soil Biol Biochem 32: 1571–1580. https://doi.org/10.1016/s0038-0717(00)00070-5.
Eggleston S, Buendia L, Miwa K, Ngara T, Kiyoto T (eds) (2006) 2006 IPCC Guidelines for National Greenhouse Gas Inventories. Agriculture, Forestry and Other Land Use. In: 2006 IPCC Guidelines for National Greenhouse Gas Inventories. Institute for Global Environmental Strategies (IGES), Japan, p. 678.
FAO (2020) Drained organic soils 1990–2019. Global, regional and country trends. FAOSTAT Analytical Brief Series 4, Rome. [Dataset] https://www.fao.org/3/cb0489en/cb0489en.pdf. Accessed 6 October 2023.
Glenn S, Heyes A, Moore T (1993) Carbon dioxide and methane fluxes from drained peat soils, southern Quebec. Global Biogeochem Cycles 7: 247–257. https://doi.org/10.1029/93gb00469.
Gorham E (1991) Northern peatlands: role in the carbon cycle and probable responses to climatic warming. Ecol Appl 1: 182–195. https://doi.org/10.2307/1941811.
Grünzweig JM, Hemming D, Maseyk K, Lin T, Rotenberg E, Raz-Yaseef N, Falloon P, Yakir D (2009) Water limitation to soil CO2 efflux in a pine forest at the semi-arid “timberline”. J Geophys Res 114, article id G03008. https://doi.org/10.1029/2008jg000874.
Hargreaves KJ, Milne R, Cannell MGR (2003) Carbon balance of afforested peatland in Scotland. Forestry 76: 299–317. https://doi.org/10.1093/forestry/76.3.299.
Hermans R, McKenzie R, Andersen R, Teh YA, Cowie N, Subke J-A (2021) Separating autotrophic and heterotrophic soil CO2 effluxes in afforested peatlands. Biogeosciences [Preprint]. [Dataset] https://doi.org/10.5194/bg-2021-126.
Hiraishi T, Krug T, Tanabe K, Srivastava N, Fukuda M, Troxler T, Jamsranjav B (2013) 2013 supplement to the 2006 IPCC guidelines for national greenhouse gas inventories: wetlands. Switzerland. [Dataset] https://www.ipcc.ch/site/assets/uploads/2018/03/Wetlands_Supplement_Entire_Report.pdf. Accessed 6 October 2023.
Hogg EH, Lieffers VJ, Wein RW (1992) Potential carbon losses from peat profiles: effects of temperature, drought cycles, and fire. Ecol Appl 2: 298–306. https://doi.org/10.2307/1941863.
Hommeltenberg J, Schmid HP, Drösler M, Werle P (2014) Can a bog drained for forestry be a stronger carbon sink than a natural bog forest? Biogeosciences 11: 3477–3493. https://doi.org/10.5194/bg-11-3477-2014.
Hooijer A, Page S, Canadell JG, Silvius M, Kwadijk J, Wösten H, Jauhiainen J (2010) Current and future CO2 emissions from drained peatlands in Southeast Asia. Biogeosciences 7: 1505–1514. https://doi.org/10.5194/bg-7-1505-2010.
Houghton JT, Jenkins GJ, Ephraums JJ (eds.) 1990. Climate change. The IPCC Scientific Assessment. Cam-bridge University Press, Cambridge. [Dataset] https://www.ipcc.ch/site/assets/uploads/2018/03/ipcc_far_wg_I_full_report.pdf. Accessed 6 October 2023.
Hugelius G, Loisel J, Chadburn S, Jackson RB, Jones M, MacDonald G, Marushchak M, Olefeldt D, Packalen M, Siewert MB, Treat C, Turetsky M, Voigt C, Yu Z (2019) Large stocks of peatland carbon and nitrogen are vulnerable to permafrost thaw. PNAS 117: 20438–20446. https://doi.org/10.1073/pnas.1916387117.
Jauhiainen J, Kerojoki O, Silvennoinen H, Limin S, Vasander H (2014) Heterotrophic respiration in drained tropical peat is greatly affected by temperature – a passive ecosystem cooling experiment. Environ Res Lett 9, article id 105013. https://doi.org/10.1088/1748-9326/9/10/105013.
Joos O, Hagedorn F, Heim A, Gilgen AK, Schmidt MWI, Siegwolf RTW, Buchmann N (2010) Summer drought reduces total and litter-derived soil CO2 effluxes in temperate grassland – clues from a 13C litter addition experiment. Biogeosciences 7: 1031–1041. https://doi.org/10.5194/bg-7-1031-2010.
Kang H, Freeman C (1999) Phosphatase and arylsulphatase activities in wetland soils: annual variation and controlling factors. Soil Biol Biochem 31: 449–454. https://doi.org/10.1016/s0038-0717(98)00150-3.
Laiho R (2006) Decomposition in peatlands: reconciling seemingly contrasting results on the impacts of lowered water levels. Soil Biol Biochem 38: 2011–2024. https://doi.org/10.1016/j.soilbio.2006.02.017.
Laiho R, Finér L (1996) Changes in root biomass after water‐level drawdown on pine mires in southern Finland. Scand J For Res 11: 251–260. https://doi.org/10.1080/02827589609382934.
Laiho R, Laine J, Trettin CC, Finér L (2004) Scots pine litter decomposition along drainage succession and soil nutrient gradients in peatland forests, and the effects of inter-annual weather variation. Soil Biol Biochem 36: 1095–1109. https://doi.org/10.1016/j.soilbio.2004.02.020.
Laine J, Silvola J, Tolonen K, Alm J, Nykänen H, Vasander H, Sallantaus T, Savolainen I, Sinisalo J, Martikainen PJ (1996) Effect of water-level drawdown on global climatic warming: northern peatlands. Ambio 25: 179–184.
Latvia National Inventory Report (2022) https://unfccc.int/documents/461908. Accessed on 15 July 2022.
Lazdiņš A, Lupiķis A (2014) Hidrotehniskās meliorācijas ietekme uz CO2 emisijām mežaudzēs uz susinātām augsnēm (No. 290514/S138). [Impact of hydrotechnical melioration on CO2 emissions in forests with drained soils (No. 290514/S138)]. LSFRI Silava, Salaspils. [Dataset] https://www.lbtu.lv/sites/default/files/zps_projekti/93449_MAF_2014_2.pdf. Accessed 6 October 2023.
Lazdiņš A, Butlers A, Lupiķis A (2014a) Case study of soil carbon stock changes in drained and afforested transitional bog. In: Forest ecosystems and its management: towards understanding the complexity. Presented at the 9th Baltic theriological conference, Latvian State Forest Research Institute “Silava,” Ilgas.
Lazdiņš A, Lupiķis A, Okmanis M (2014b) Soil carbon stock change due to drainage of a forest stand growing on a transitional bog. In: Finér L, Karvinen L, Stupak I (eds) Environmental Services provided by the Nordic-Baltic Forests. Extended abstracts of the CAR-ES network meeting in Finland 20.–22.10.2014. Working Papers of the Finnish Forest Research Institute 316, Vantaa, Finland, pp. 50–53. http://urn.fi/URN:ISBN:978-951-40-2513-6.
Le Mer J, Roger P (2001) Production, oxidation, emission and consumption of methane by soils: a review. Eur J Soil Biol 37: 25–50. https://doi.org/10.1016/s1164-5563(01)01067-6.
Lohila A, Laurila T, Aro L, Aurela M, Tuovinen J-P, Laine J, Kolari P Minkkinen K (2007) Carbon dioxide exchange above a 30-year-old Scots pine plantation established on organic-soil cropland. Boreal Environ Res 12: 141–157.
Lohila A, Minkkinen K, Aurela M, Tuovinen J-P, Penttilä T, Ojanen P, Laurila T (2011) Greenhouse gas flux measurements in a forestry-drained peatland indicate a large carbon sink. Biogeosciences 8: 3203–3218. https://doi.org/10.5194/bg-8-3203-2011.
Loisel J, Gallego-Sala AV, Amesbury MJ, Magnan G, Anshari G, Beilman DW, Benavides JC, Blewett J, Camill P, Charman DJ, Chawchai S, Hedgpeth A, Kleinen T, Korhola A, Large D, Mansilla CA, Müller J, van Bellen S, West JB, Yu Z, Bubier JL, Garneau M, Moore T, Sannel ABK, Page S, Väliranta M, Bechtold M, Brovkin V, Cole LES, Chanton JP, Christensen TR, Davies MA, De Vleeschouwer F, Finkelstein SA, Frolking S, Gałka M, Gandois L, Girkin N, Harris LI, Heinemeyer A, Hoyt AM, Jones MC, Joos F, Juutinen S, Kaiser L, Lacourse T, Lamentowicz M, Larmola T, Leifeld J, Lohila A, Milner AM, Minkkinen K, Moss P, Naafs BDA, Nichols J, O’Donnell J, Payne R, Philben M, Piilo S, Quillet A, Ratnayake AS, Roland TP, Sjögersten S, Sonnentag O, Swindles GT, Swinnen W, Talbot J, Treat C, Valach AC, Wu J (2021) Expert assessment of future vulnerability of theglobal peatland carbon sink. Nat Clim Chang 11:1–8. https://doi.org/10.1038/s41558-021-00991-1.
Lukkala OJ (1949) Soiden turvekerroksen painuminen ojituksen vaikutuksesta. [The subsidence of the peat layer of bogs due to drainage]. Commun Inst for Fenn 37: 1–67. http://urn.fi/URN:NBN:fi-metla-201207171069.
Lupiķis A, Lazdiņš A (2015) Soil carbon balance on drained and afforested transitional bog in forest research station Vesetnieki in Latvia. Presented at the EGU General Assembly Conference Abstracts, p. 955. [Dataset] https://ui.adsabs.harvard.edu/abs/2015EGUGA..17..955L/abstract. Accessed 6 October 2023.
LVĢMC 2023: [Dataset] https://videscentrs.lvgmc.lv/lapas/latvijas-klimats. Accessed 6 October 2023.
Mäkiranta P (2012) Heterotrophic soil respiration in drained peatlands: abiotic drivers, and changes after clearfelling and afforestation. PhD thesis. Diss For 140. https://doi.org/10.14214/df.140.
Mäkiranta P, Hytönen J, Aro M, Maljanen EM, Pihlatie M, Potila H, Shurpali N, Laine J, Lohila A, Martikainen PJ, Minkkinen K (2007) Soil greenhouse gas emissions from afforested organic soil croplands and cutaway peatlands. Boreal Environ Res 12: 159–175.
Martikainen PJ, Nykänen H, Crill P, Silvola J (1993) Effect of a lowered water table on nitrous oxide fluxes from northern peatlands. Nature 366: 51–53. https://doi.org/10.1038/366051a0.
Martin NJ, Holding AJ (1978) Nutrient availability and other factors limiting microbial activity in the blanket peat. In: Heal DOW, Perkins DDF (eds) Production ecology of british moors and montane grasslands, ecological studies. Springer Berlin Heidelberg, pp 113–135. https://doi.org/10.1007/978-3-642-66760-2_6.
Meyer A, Tarvainen L, Nousratpour A, Björk RG, Ernfors M, Grelle A, Kasimir-Klemedtsson Å, Lindroth A, Räntfors M, Rütting T, Wallin G, Weslien P, Klemedtsson L (2013) A fertile peatland forest does not constitute a major greenhouse gas sink. Biogeosciences 10: 7739–7758. https://doi.org/10.5194/bg-10-7739-2013.
Minkkinen K (1999) Effect of forestry drainage on the carbon balance and radiative forcing of peatlands in Finland. PhD thesis. Department of Forest Ecology, University of Helsinki.
Minkkinen K, Laine J (1998a) Long-term effect of forest drainage on the peat carbon stores of pine mires in Finland. Can J For Res 28: 1267–1275. https://doi.org/10.1139/x98-104.
Minkkinen K, Laine J (1998b) Effect of forest drainage on the peat bulk density of pine mires in Finland. Can J For Res 28: 178–186. https://doi.org/10.1139/x97-206.
Minkkinen K, Laine J (2006) Vegetation heterogeneity and ditches create spatial variability in methane fluxes from peatlands drained for forestry. Plant Soil 285: 289–304. https://doi.org/10.1007/s11104-006-9016-4.
Minkkinen K, Laine J, Shurpali NJ, Mäkiranta P, Alm J, Penttilä T (2007a) Heterotrophic soil respiration in forestry-drained peatlands. Boreal Environ Res 12: 115–126.
Minkkinen K, Penttilä T, Laine J (2007b) Tree stand volume as a scalar for methane fluxes in forestry-drained peatlands in Finland. Boreal Environ Res 12: 127–132.
Minkkinen K, Ojanen P, Penttilä T, Aurela M, Laurila T, Tuovinen J-P, Lohila A (2018) Persistent carbon sink at a boreal drained bog forest. Biogeosciences 15: 3603–3624. https://doi.org/10.5194/bg-15-3603-2018.
Nykänen H, Alm J, Silvola J, Tolonen K, Martikainen PJ (1998) Methane fluxes on boreal peatlands of different fertility and the effect of long-term experimental lowering of the water table on flux rates. Global Biogeochem Cycles 12: 53–69. https://doi.org/10.1029/97gb02732.
Ojanen P, Minkkinen K, Alm J, Penttilä T (2010) Soil–atmosphere CO2, CH4 and N2O fluxes in boreal forestry-drained peatlands. For Ecol Manag 260: 411–421. https://doi.org/10.1016/j.foreco.2010.04.036.
Olmedo OE (2014) kriging: Ordinary kriging. [Dataset] https://cran.r-project.org/web/packages/kriging/kriging.pdf. Accessed 6 October 2023.
Petrescu AMR, Lohila A, Tuovinen J-P, Baldocchi DD, Desai AR, Roulet N, Vesala T, Dolman AJ, Oechel WC, Marcolla B, Friborg T, Rinne J, Matthes JC, Merbold L, Meijide A, Kiely G, Sottocornola M, Sachs T, Zona D, Varlagin A, Lair DYF, Veenendaal E, Parmentier F-JW, Skiba U, Lund M, Hensen A, van Huissteden J, Flanagan LB, Shurpali NJ, Grünwald T, Humphreys ER, Jackowicz-Korczynski M, Aurela MA, Laurila T, Grüning C, Corradi CAR, Schrier-Uijls AP, Christensen TR, Tamstorf MP, Mastepanov M, Martikainen PJ, Verma SB, Bernhofer C, Cescatti A (2015) The uncertain climate footprint of wetlands under human pressure. PNAS 112: 4594–4599. https://doi.org/10.1073/pnas.1416267112.
Pitkänen A, Turunen J, Tahvanainen T, Simola H (2013) Carbon storage change on a partially forestry-drained boreal mire determined through peat column inventories. Boreal Environ Res 18: 223–234.
QGIS Development Team (2009) QGIS geographic information system. Open Source Geospatial Foundation.
Regina K, Nykänen H, Silvola J, Martikainen PJ (1996) Fluxes of nitrous oxide from boreal peatlands as affected by peatland type, water table level and nitrification capacity. Biogeochemistry 35: 401–418. https://doi.org/10.1007/bf02183033.
Ribeiro Jr PJ, Diggle PJ (2015) geoR: analysis of geostatistical data. http://www.leg.ufpr.br/geoR/.
Riutta T (2008) Fen ecosystem carbon gas dynamics in changing hydrological conditions. Dissertationes Forestales 67. https://doi.org/10.14214/df.67.
Rothwell RL, Silins U, Hillman GR (1996) The effects of drainage on substrate water content at several forested Alberta peatlands. Can J For Res 26: 53–62. https://doi.org/10.1139/x26-006.
Sakovets VV, Germanova NI (1992) Changes in the carbon balance of forested mires in Karelia due to drainage. Suo 43: 249–252.
Salm J-O, Maddison M, Tammik S, Soosaar K, Truu J, Mander Ü (2011) Emissions of CO2, CH4 and N2O from undisturbed, drained and mined peatlands in Estonia. Hydrobiologia 692: 41–55. https://doi.org/10.1007/s10750-011-0934-7.
Schils R, Kuikman P, Liski J, van Oijen M, Smith P, Webb J, Alm J, Somogyi Z, van den Akker J, Billett M, Emmett B, Evans C, Lindner M, Palosuo T, Bellamy P, Jandl R, Hiederer R (2008) Review of existing information on the interrelations between soil and climatic change (ClimSoil). Final Report, European Com-mission, Brussels. [Dataset] https://www.researchgate.net/publication/277203255_Review_of_Existing_Information_on_the_Interrelations_between_Soil_and_Climate_Change_CLIMSOIL_-_Final_Report. Accessed 6 October 2023.
Silc T, Stanek W (1977) Bulk density estimation of several peats in northern Ontario using the von Post humification scale. Can J Soil Sci 57: 75–75. https://doi.org/10.4141/cjss77-010.
Silins U (1997) Post-drainage peatland moisture and aeration dynamics. PhD thesis, University of Alberta, Edmonton, Canada.
Silvan N, Laiho R, Vasander H (2000) Changes in mesofauna abundance in peat soils drained for forestry. For Ecol Manag 133: 127–133. https://doi.org/10.1016/s0378-1127(99)00303-5.
Silvola J, Alm J, Ahlholm U, Nykanen H, Martikainen PJ (1996) CO2 fluxes from peat in boreal mires under varying temperature and moisture conditions. J Ecol 84: 219–228. https://doi.org/10.2307/2261357.
Simola H, Pitkänen A, Turunen J (2012) Carbon loss in drained forestry peatlands in Finland, estimated by re-sampling peatlands surveyed in the 1980s. Eur J Soil Sci 63: 798–807. https://doi.org/10.1111/j.1365-2389.2012.01499.x.
Sisak S (2013) Effect of drainage on the development of an oligotrophic bog Scots pine (P. sylvestris L.) stand in Järvselja. For Stud 58: 12–25. https://doi.org/10.2478/fsmu-2013-0002.
Socha J (2012) Long-term effect of wetland drainage on the productivity of Scots pine stands in Poland. For Ecol Manag 274: 172–180. https://doi.org/10.1016/j.foreco.2012.02.032.
Stark S, Männistö MK, Eskelinen A (2014) Nutrient availability and pH jointly constrain microbial extracellular enzyme activities in nutrient-poor tundra soils. Plant Soil 383: 373–385. https://doi.org/10.1007/s11104-014-2181-y.
Turetsky M, Donahue W, Benscoter B (2011) Experimental drying intensifies burning and carbon losses in a northern peatland. Nat Commun 2, article id 514. https://doi.org/10.1038/ncomms1523.
Nations (1998) Kyoto protocol to the United Nations framework convention on climate change. [Dataset] https://unfccc.int/resource/docs/convkp/kpeng.pdf. Accessed 6 October 2023.
Wuebbles DJ, Hayhoe K (2002) Atmospheric methane and global change. Earth Sci Rev 57: 177–210. https://doi.org/10.1016/s0012-8252(01)00062-9.
Yli-Halla M, Lötjönen T, Kekkonen J, Virtanen S, Marttila H, Liimatainen M, Saari M, Mikkola J, Suomela R, Joki-Tokola E (2022) Thickness of peat influences the leaching of substances and greenhouse gas emissions from a cultivated organic soil. Sci Total Environ 806, article id 150499. https://doi.org/10.1016/j.scitotenv.2021.150499.
Zālītis P, Jansons J, Indriksons A (2012) Kokaudžu parametru dinamika meliorētos pārejas purvos. [Dynamics of tree stand parameters in drained transitional bogs]. Mežzinātne 26: 6–19.
Total of 88 references.
