Felipe de Miguel-Díez  ,
Thomas Purfürst,
Mauricio Acuna,
Eduardo Tolosana-Esteban,
Tobias Cremer
,
Thomas Purfürst,
Mauricio Acuna,
Eduardo Tolosana-Esteban,
Tobias Cremer
Estimation of conversion factors for wood stacks in landings and their influencing parameters: a comprehensive literature review for America and Europe
de Miguel-Díez F., Purfürst T., Acuna M., Tolosana-Esteban E., Cremer T. (2023). Estimation of conversion factors for wood stacks in landings and their influencing parameters: a comprehensive literature review for America and Europe. Silva Fennica vol. 57 no. 1 article id 22018. https://doi.org/10.14214/sf.22018
Highlights
- Midpoint diameter, stacking quality, crookedness, log length, delimbing quality and bark thickness strongly influence the conversion factors
- In Europe and America, a total of 48 methods were developed to estimate the conversion factors of wood stacks
- The conversion factors should be estimated for each wood assortment and tree species.
Abstract
In commercial transaction of stacked roundwood, the estimation of the stack net volume plays a key role. One generalized method to determine the net volume is using conversion factors that relate the gross and net volumes. In this literature review the developed methods to estimate the conversion factors as well as their influencing parameters were analyzed based on 153 references from America and Europe. According to the results, 48 different methods (including their variants) for estimating the conversion factors were developed. The newest methods enabled their accurate determination inexpensively, e.g., photo-optical methods or 3D simulation models. The analyzed references revealed that 30 parameters influence the conversion factors. Based on this comprehensive review, each stakeholder involved in the roundwood supply chain can know which method is used for estimating the conversion factors in the analyzed territories and which influencing parameters should be considered when purchasing roundwood in order to accurately assess the solid wood content in the stacks.
Keywords
log properties;
roundwood measurement;
roundwood purchase;
stack properties;
wood supply chain
-
de Miguel-Díez,
Eberswalde University for Sustainable Development, Department of Forest Utilization and Timber Markets, Eberswalde, Germany; University of Freiburg, Chair of Forest Operations, Freiburg, Germany
 https://orcid.org/0000-0002-3800-7449
E-mail
felipe.diez@hnee.de
https://orcid.org/0000-0002-3800-7449
E-mail
felipe.diez@hnee.de
-
Purfürst,
University of Freiburg, Chair of Forest Operations, Freiburg, Germany
https://orcid.org/0000-0001-9661-0193
E-mail
thomas.purfuerst@foresteng.uni-freiburg.de
- Acuna, University of the Sunshine Coast, Forest Research Institute, Sunshine Coast, Queensland, Australia E-mail macuna@usc.edu.au
-
Tolosana-Esteban,
Universidad Politécnica de Madrid, E.T.S.I. Montes, Forestal y del Medio Natural, Madrid, Spain
https://orcid.org/0000-0003-2561-0342
E-mail
eduardo.tolosana@upm.es
-
Cremer,
Eberswalde University for Sustainable Development, Department of Forest Utilization and Timber Markets, Eberswalde, Germany
https://orcid.org/0000-0001-7866-944X
E-mail
Tobias.Cremer@hnee.de
Received 10 November 2022 Accepted 31 March 2023 Published 20 April 2023
Views 156199
Available at https://doi.org/10.14214/sf.22018 | Download PDF

1 Introduction
The worldwide commercialization of industrial roundwood (destined generally to manufacture pulpwood and paper) is very diverse, considering specific factors such as the local conditions, tree species and legislation in each country. As this kind of assortment tends to have smaller diameters (Williams 1968; Hamilton 1975), shorter lengths (no longer than 6 m) and be of a lower quality, the measurement should not generally be costly. Thus, there are usually two options to estimate the industrial roundwood volume to be acquired in stacks: weight or volumetric measurement (Hamilton 1975; Batista and Zarate do Couto 2002). The advantages and disadvantages of each of these alternatives to measure the roundwood volume have been analyzed in former research studies. These deem the weight measurement more suitable, mainly because the application of this method is quick and does not require special handling nor human judgment entering the picture. The weight measurement is typically more efficient concerning the precision per unit cost, because of the large quantities and greater objectivity. Moreover, the volumetric measurement cannot be fair to the stakeholders involved in the commercialization process since this method is influenced by several parameters such as diameter, length or quality. However, the weight measurement does have notable disadvantages such as the inability to weigh the roundwood in the forest where it is usually purchased, i.e., due to inaccessibility of the weighbridges (Smith 1979) and the weight differences (Taras 1956). Furthermore, using the volumetric measurement, greater precision per unit cost can be achieved for more moderate quantities if the logs are uniform and straight and the stacking quality is also high (Taras 1956; Hamilton 1975; Smith 1979).
Nowadays, there are some countries, such New Zealand, where weight measurement is generally used for commercial and trading purposes (Ellis 1993). In contrast, the volumetric measurement of stacked roundwood has traditionally been used either at storage sites or at the roadside, e.g., Germany (RVR 2020) or USA (Briggs 1994); or loaded on trucks, e.g., Norway (Norsk Virkesmåling 2015a,b). In several South American countries, the stacked roundwood is volumetrically measured by scaling each stacked log, applying generally the Smalian or Huber formula or the Doyle rule (Ministerio del Ambiente de Ecuador 2001; Instituto Nacional de Bosques - INAB- 2004; Ammour et al. 2012; Ministerio de Desarrollo Agrario y de Riego. Servicio Nacional Forestal y de Fauna (SERFOR) 2021). However, conversion factors are applied for roundwood on trucks as a faster option to the individual measurement of the logs’ volumes. This fact is explicitly indicated so in the measurement guidelines or research efforts conducted in Venezuela (González et al. 2010), Peru (Ministerio de Desarrollo Agrario y de Riego. Servicio Nacional Forestal y de Fauna (SERFOR) 2021), Colombia (Gutierrez Rodriguez et al. 2013), Costa Rica (Meza-Montoya and Simón 2005; Ammour et al. 2012) and Ecuador (Ministerio del Ambiente de Ecuador 2001). In some countries volumetric measurement methods are even used as standard for commercializing industrial wood depending on the roundwood properties (e.g., midpoint diameter). Examples include Lithuania (Lietuvos Respublikos Aplinkos Ministro 2002, 2010), Latvia (Latvijas valsts meži 2022) and Rumania (Guvernul României 2020). In most countries, the measurement process for this roundwood type takes place in landings (at storage sites or in roadsides in the forests), where the logs are stacked and sold by the stack volume (Baró y Zorrilla 1948; Hamilton 1975; Smith 1979; Maa- ja metsätalousministeriö 1997; Edwards 1998; Purser 1999; Rondeux 1999; Jänes 2001; Batista and Zarate do Couto 2002; Lietuvos Respublikos Aplinkos Ministro 2002; Schulting 2002; Fonseca 2005; Environment and Sustainable Resource Development - Government of Alberta 2006; Fachverband der Holzindustrie Osterreichs der Wirtschaftskammer Osterreichs 2006; United States Department of Agriculture. Forest Service 2006; Nova Scotia Natural Resources 2007; Barros et al. 2008; González et al. 2010; Romahn de la Vega and Ramírez Maldonado 2010; British Columbia Ministry of Forests, Lands and NRO 2011; Lindblad 2011; Ljubojević et al. 2011; Meyen and O´Connel 2012; Ministério do Meio Ambiente 2012; New Brunswick Forest management branch natural resources 2012; Russian state scientific center of the timber industry complex 2013; Câmpu et al. 2015; Podkorytov 2015; Forest Service of Newfoundland and Labrador 2016; Luonnonvarakeskus 2017; Witkowska and Jodłowski 2018; FCBA Institut Technologique 2019; Manitoba sustainable development 2019; Biometria 2020; Ontario Ministry of Natural Resources and Forestry 2020; RVR 2020; Saskatchewan Ministry of Environment 2021; WaldSchweiz et al. 2021; Moskalik et al. 2022).
With the purpose of determining the cubic volume occupied, which is known as gross volume, stacked volume or frame volume, the width, length and height of the stack are measured and multiplied (Diéguez Aranda et al. 2003; Fonseca 2005; Lindblad 2011; Russian state scientific center of the timber industry complex 2013; Podkorytov 2015). The most common units to express the stack volume are the cord (principally used in the USA) (Williams 1968; Briggs 1994; Batista and Zarate do Couto 2002; Fonseca 2005; United States Department of Agriculture. Forest Service 2006) and the stere (generally used outside of the USA) (Baur 1879; Huffel 1919; Rondeux 1999; Batista and Zarate do Couto 2002; Schulting 2002; Wabo 2002; FEDEMAR. Federation belge des exploitants forestiers et des marchands de bois de mine et de papeterie 2005; Fonseca 2005; Barros et al. 2008). The stere is defined as being a unit of measure of stacked wood occupying the space of 1m3 and therefore it is equivalent to the cubic meter stacked (m3 stacked) (Baur 1879; Huffel 1919; Baró y Zorrilla 1948; Cailliez 1980; Wabo 2002; Fonseca 2005; Environment and Sustainable Resource Development - Government of Alberta 2006; Nova Scotia Natural Resources 2007; New Brunswick Forest management branch natural resources 2012; Junta de Comunidades de Castilla-La Mancha et al. 2013). In countries where the metric system is used, the stere is considered the standard measured for stacked roundwood (Briggs 1994). There are other units used in further territories that are equivalent to the stere and whose application has traditionally been implemented. Examples include the stacked cubic meter (st m3) in Canada (Ontario Ministry of Natural Resources and Forestry 2020) and the cubic meter (m3) in Ireland (Purser 1999). In contrast, the cord is defined as being a unit of measure of stacked wood which occupies a space of 218 ft3 (Fonseca 2005; United States Department of Agriculture. Forest Service 2006). Another measuring unit is the metro ruma (mr), which is defined as being a unit of measure of stacked wood which occupies a space of 2.44 m3 (Emanuelli et al. 1997; Cogolludo Agustín 2012). The metro ruma is used in some countries of South America such as Chile and Venezuela (González et al. 2010). Furthermore, there are other units with different volumes used in other regions or countries such as metro Biobio or metro Masisa in Chile (Emanuelli et al. 1997; Prodan et al. 1997).
The real wood quantity in a stack is known as solid wood content or solid wood cubic volume and generally measured under bark, although in several countries, such as Finland, it is considered over bark as well (Lindblad 2011). The solid wood cubic volume does not correspond to its stacked volume, since not only wood is contained in a stack but also bark and air spaces between the logs (also known as cracks, gaps or voids) (Smith 1979; Rondeux 1999; Batista and Zarate do Couto 2002; Fonseca 2005; Forest Service of Newfoundland and Labrador 2016; Ontario Ministry of Natural Resources and Forestry 2020). Other materials that can also comprise the stack include snow, ice, dirt, stones, soil, and foreign matter (Batista and Zarate do Couto 2002), which can adhere to and become part of the wood stack as it is built (Smith 1979; Fonseca 2005; Foelkel 2015; Biometria 2020). Due to this fact the proportion of solid wood in a stack can vary between 60 % and 70%, in some extreme cases these values reach between 45% and 80% (Rondeux 1999; Fonseca 2005; Biometria 2020). There are general guidelines that indicate roughly similar proportions of the main components in a stack, concretely: solid wood 66.67% (66% or 66.667%), bark 11.46% (12% or 11.458%) and air 21.87% (22% or 21.875%) (Fonseca 2005; Manitoba sustainable development 2019; FAO et al. 2020; Ontario Ministry of Natural Resources and Forestry 2020). Even though a few references provide these proportions based on data collected, e.g., data from 50 000 cords by a pine (Pinus spp. L.) mill located in the south of the United States showed 59.92% of wood, 12.65% of bark and 27.43 % of air spaces (Williams 1968).
These proportions can vary since several parameters influence the net stack volume. Further measurement guidelines indicate that although the stack gross volume may occasionally be used in sales (Hamilton 1975; Smith 1979; Barros et al. 2008), it is common to convert the stack gross volume to net volume by applying a suitable conversion factor (Hamilton 1975; Bertola et al. 2003; Câmpu et al. 2015). These conversion factors relate the gross and net volumes (o.b. or u.b) (Reinhold 1951), and help to estimate the solid wood content in a stere, metro ruma, or cord (Briggs 1994; Emanuelli et al. 1997; Da Crislei Silva 2003). Conversion factors are also known as stack density (Asikainen et al. 2009). Conversion factors are also defined according to Ciubotaru (1998) as the real volume occupied by wood in a cube with a dimension of 1 m × 1 m × 1 m (1 m3). In this way, the conversion factor is defined as a sub-unitary value that indicates the volume occupied by wood in a gross volume of 1 m3 (Câmpu et al. 2015). The conversion factors range between 0and 1, usually between 0.45 and 0.80 (Cailliez 1980; Rondeux 1999). These factors are average values (Emanuelli et al. 1997; Batista and Zarate do Couto 2002) and are generally highly biased (Emanuelli et al. 1997); therefore, they are deemed valid only in specific regions. Thus, the conversion factors are applied to quantify the commercial value of the roundwood based on a price per unit solid volume (Hamilton 1975).
In general, conversion factors are calculated by dividing the net stack volume (or solid wood content) by the gross stack volume (Batista and Zarate do Couto 2002; Diéguez Aranda et al. 2003). Another way to calculate them consists of dividing the sum of the face areas (circles) by the spatial cross-section. This method is based on the assumption that all logs have the same length (Reinhold 1951). Other authors developed regression models for that purpose (Palo 1969). However, the existing methods to determine the conversion factors are different depending on the territory, showing a historical variation over the years. Furthermore, from several research efforts (Barros et al. 2008; González et al. 2010) and documents of international organizations (Fonseca 2010; FAO et al. 2020) the need to regularly update the conversion factors can be deduced, being even indicated explicitly due to the changes occurred in the forest sector, e.g., increasing mechanization when harvesting and preparing the logs.
Conversion factors are not only admittedly estimations (Barret et al. 1941) but also they must be applied in order to obtain the net stack volume according to measurement guidelines currently in use either after being derived from the gross stack volume (Environment and Sustainable Resource Development - Government of Alberta 2006; Nova Scotia Natural Resources 2007; New Brunswick Forest management branch natural resources 2012; Russian state scientific center of the timber industry complex 2013; Forest Service of Newfoundland and Labrador 2016; Ontario Ministry of Natural Resources and Forestry 2020) or directly to the measured stack volume such as in Bosnia and Herzegovina (according to the former Yugoslavia’s national standards) (Ljubojević et al. 2011), in Brazil (Bertola et al. 2003; Barros et al. 2008), in Estonia (Keskkonnaministri 2006; Riigimetsa Majandamise Keskuse (RMK) 2021), in Guatemala (Instituto Nacional de Bosques - INAB- 2004), in the Italian regions of South Tyrol and Turin (Landesbetrieb für Forst- und Domänenverwaltung et al. 2006; Camera di Commercio Industria Artigianato e Agricoltura di Torino 2009), in Mexico (Romahn de la Vega and Ramírez Maldonado 2010; Galán Larrea et al. 2014), in the Netherlands (Schulting 2002), in Poland (Witkowska and Jodłowski 2018; Jodłowski and Witkowska 2019; Director General of the State Forests 2019; Moskalik et al. 2022), in the Canadian region of Québec (Gouvernement du Québec 2021), in Romania (Guvernul României 2020), in Spain, where the conversion factors are usually indicated in the contract specifications (Gobierno de Navarra. Servicio de gestión forestal 2016), in Ukraine (Podkorytov 2015) or in the United States of America (Briggs 1994). In the measurements guidelines or framework agreement for roundwood trade, some conversion factors are given as reference. However, those guidelines explicitly indicate that the given conversion factors may not be used for billing, e.g., in Germany (Bundesministerium für Ernährung, Landwirtschaft und Forsten 1983; RVR 2020).
As well as the net stack volume, the conversion factors vary as per a series of influencing log and stack parameters such as taper or crookedness. Over the last centuries, several authors from different countries analyzed those parameters considering their effects on different tree species and using different research methods (Huffel 1919; Barret et al. 1941; Keepers 1945; Baró y Zorrilla 1948; Mountain 1949; Briggs 1994; Bertola et al. 2003; Barros et al. 2008; Dos Santos Lisboa et al. 2009; Vera Solis 2010; Ljubojević et al. 2011; Foelkel 2015). In addition, the effect of some influencing parameters has been included in the measurement guidelines used in several countries such as the United Kingdom (Hamilton 1975), Ireland (Purser 1999), the Netherlands (Schulting 2002), Sweden (Biometria 2020) or some Canadian provinces (Environment and Sustainable Resource Development - Government of Alberta 2006; New Brunswick Forest management branch natural resources 2012; Forest Service of Newfoundland and Labrador 2016; Saskatchewan Ministry of Environment 2021).
To conclude, the aim of this literature review is to gather information about different methods to estimate conversion factors (and thus, the solid wood content in a stack) used for industrial roundwood stacks in several countries in Europe and America; these methods are described both in the measurement guidelines and previous research efforts. In particular, this literature review is focused on the roundwood measurement process performed in the forest (either at roadsides or at storage sites). In those places, conversion factors are used since there is no access to weighbridges. Weight differences can be produced for various reasons but specially because of the seasonal variation of the moisture content. In the present literature review, conversion factors are considered as those figures that relate the gross stack volume over bark to the net stack volume under bark. In addition, this review aims to compile the influence of every identified log and stack parameter on the conversion factors based on the found references. Since the first documented study addressed this literature review´s issues in 1765, numerous studies have been reported and methods developed in several countries to estimate conversion factors and analyze their influencing parameters. Even though some authors could gather diverse methods or influencing parameters (e.g., Pardé and Bouchon in 1988 and Zon in 1903), a comprehensive literature review that had compiled all methods and findings has not been conducted in the selected territories so far. Thus, the present literature review was conducted with the purpose of filling this historical gap. It is expected to provide stakeholders in the roundwood supply chain and researchers alike with a solid basis for understanding this issue, reviewing their methods for estimating the conversion factors (and the solid wood content) and facilitating the measurement and acquisition operations in the territories analyzed.
2 Method
2.1 Databases
The present literature review was undertaken by systematically searching measurement guidelines, research works, theses and related internet documents on “Google Scholar” and websites of the regional and national organizations in the analyzed territories. The scope of the literature review was not limited to the documents classed as ‘articles’ or ‘papers’; it also included relevant data found in official documents such as the regional or national guidelines for roundwood measurements. Thus, the references included in the study were classified in five different document types: guidelines, articles, handbooks, final theses, and internet documents.
- The term “guidelines” refers to official documents such as regulations, scaling manuals or framework agreements for roundwood trade. From those documents, the methods to estimate the conversion factors used in the respective countries can be gleaned. Furthermore, the effect of several influencing parameters is explicitly described in those documents or can be deduced from their content. In some countries, the method or methods to estimate the conversion factors can be described in a single national guideline; also, it is possible to find several regional guidelines in the same country with different variants for one specific method. The German framework agreement for roundwood trade or the Canadian regional log scaling manuals are examples of the documents included in this category.
- An article is considered as any research effort conducted and published, such as papers, conferences papers, etc. Due to the particularities of the analyzed topic, every research effort, which was published in English or the respective mother tongue, was analyzed. Articles that were not peer-reviewed, were also considered in order to encompass a broader spectrum of the knowledge in each territory.
- Final theses were also considered for performing this literature review. They provided additional and deeper information about the methods to estimate the conversion factors and the influence of the respective parameters.
- Handbooks (books and/or chapter of book) were also considered in the present review. In the documents included in this category, the authors either compiled several methods and described the effect of selected influencing parameters, or described their research efforts comprehensively.
- Lastly, internet documents considered in the present literature review included relevant information about the topics. They were not included in the mentioned categories since these were obtained from online sources, and/or were not published in a scientific journal or by an editorial (e.g., learning materials, presentations at conferences, user manuals of devices or software, etc.).
2.2 Research strategy
The literature review process included selected keywords in English and the respective languages of each country related to the main topics. These terms were then searched for in different parts of each document including the title, abstract and keywords. In the case of the guidelines or regulations, the search was conducted on those sections of the document related to the measurement of stacked roundwood. The selected terms in English and in the respective languages of the most relevant countries are displayed in the Table 1.
| Table 1. Selected terms to perform the literature review concerning the estimation of conversion factors and their influencing parameters in the respective languages of the relevant forestry countries. | ||||
| Terms | Language | |||
| Danish | Dutch | Estonian | Finnish | |
| Roundwood measurement | Måling af rundtræ | Meten van rondhout | Puidumõõtmine | Puutavaran mittaus |
| Stack/pile | Rundtræ stak | Stapel | Virna | Pino/muodostelma |
| Stack gross volume | Stak bruttovolumen / stakkens fysiske volumen | Stapel volume | Virna kubatuuriga | Kehystilavuus |
| Stack net volume | Stak nettovolumen | Werkelijk houtvolume | Virna mahtu | Kiintotilavuus |
| Conversion factors | Omregningsfaktorer / fastmasseprocent | Conversiefactoren / Stapelfactor | Virnatäiuse koefitsient | Pinotiheystekijä/ Pinotiheyskerroin/ Pinotiheysprosentti |
| Terms | Language | |||
| French | German | Italian | Lithuanian | |
| Roundwood measurement | Cubage des bois ronds | Rundholzvermessung | Misurazione del legname tondo (tronco) | Apvaliosios medienos matavimo tūrio |
| Stack/pile | Pile | Polter | Catasta | Medienos rietuvės |
| Stack gross volume | Volume apparent | Bruttoraummaß | Volume della catasta | Rietuvės tūris |
| Stack net volume | Volume plein | Festmaß | Volume reale | Medienos tūris rietuvėje |
| Conversion factors | Coefficient d’empilage | Umrechnungsfaktoren | Coefficiente Stereometrico del Legno in catasta | Perskaičiavimo koeficientas |
| Terms | Language | |||
| Norwegian | Polish | Portuguese | Romanian | |
| Roundwood measurement | Tømmermåling | Pomiar drewna okrągłego | Medição da Madeira | Măsurarea lemnului rotund |
| Stack/pile | Tømmerlunne | Stos drewna | Pilha | Stiva, Gramada, Lemn asezat in figuri |
| Stack gross volume | Løsvolumet | Objętość stosu drewna | Volume empilhado | Volumul aparent |
| Stack net volume | Fastvolum | Miąższość drewna | Volume sólido | Volumul real |
| Conversion factors | Fastmasseprosent | Współczynniki zamienne | Fator de cubicação | Factor de cubaj |
| Terms | Language | |||
| Russian | Spanish | Swedish | Ukrainian | |
| Roundwood measurement | измерений объема круглых лесоматериалов | Medición de madera | Virkesmätning | Вимірювання деревини в круглому вигляді |
| Stack/pile | штабеля бревен | Pila | Trave | Штабель |
| Stack gross volume | складочный объем | Volumen aparente | Travens virkesvolym | Об’єм штабеля у складовій мірі |
| Stack net volume | плотный объем | Volumen real | Virkesvolymen | Об’єм штабеля у щільній мірі |
| Conversion factors | Коэффициент полнодревесности лесоматериалов | Coeficiente de apilado/apilamiento | Vedvolymprocent | Коефіцієнт повнодеревності |
Every document was analyzed as per their relevance and suitability with the topic and scope established for the literature review. Those documents that addressed the methods to estimate the conversion factors from roundwood on trucks were not considered. Likewise, research papers and measurement guidelines dealing with the commercialization of roundwood by weight and conversion factors from weight to volume were discarded. It is worth noting that it was not always possible to find every type of document in all the selected countries (e.g., guidelines or final theses) since these were not accessible online.
2.3 Data structure
A total of 153 documents were selected and analyzed. According to the assigned categories 72 articles (including conference papers), 43 guidelines used in 28 countries, 8 final theses, 5 internet documents and 25 handbooks were analyzed. Fig. 1 presents this distribution by country and type of document.
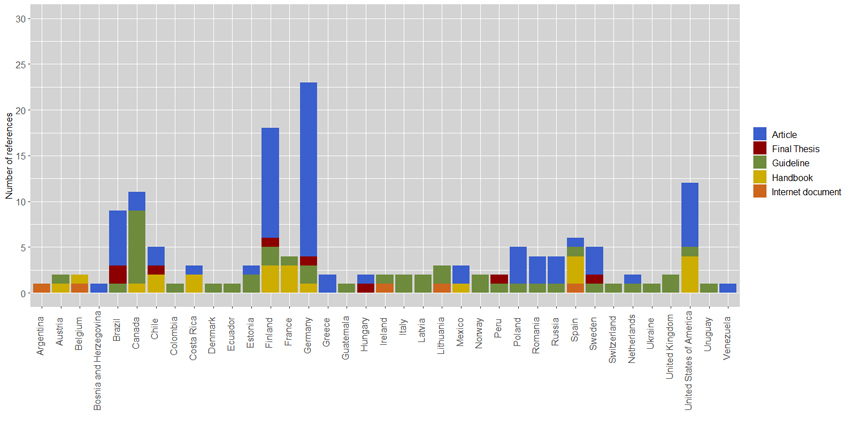
Fig. 1. Number of published references concerning the estimation of conversion factors and their influencing parameters categorized by (i) type of document and (ii) country. View larger in new window/tab.
Most articles gathered in the study were published in Germany, Finland, the United States of America (USA), and Brazil. Official documents such as guidelines, regulations, or framework agreements for the roundwood trade were found in 28 of the 38 analyzed countries. Canada had more documents of this type since most Canadian provinces have their own guidelines, known as log scaling manuals.
The literature research revealed the first studies on the estimation of solid wood content, the conversion factors, and the effect of the influencing parameters date from 1765, with Germany being the country that reports the first studies on this topic (von Seckendorff-Gudent 1878; Graves 1906; Schnur 1932). However, the first reliable results were obtained only as from second half of the 19th century (Graves 1906; Schnur 1932). During the following decades, this issue has drawn the attention of a considerable number of researchers from many countries. In those papers, the methods used in the first studies were applied again in order to identify new influencing parameters and determine the solid wood content and the conversion factors for new tree species. The latest studies have analyzed the influence of selected parameters using 3D simulation models, which additionally allows estimating conversion factors for specific roundwood assortments. The analysis of the decennial sum of all references showed that this issue was deeply studied by a few researchers in the 19th century and the beginning of the 20th century (Fig. 2). The low number of studies conducted in that period can be due to the high required costs and time involved to analyze the effect of the influencing parameters and the methods applied for that purpose. After the 1930s the number of studies increased gradually, a trend that was driven by the considerable amount of wood used by the pulp and paper industry at the start of the 20th century. At that time, both the selection of the roundwood and its efficient use were of great importance. This trend was further intensified by the decreasing supply of preferable pulpwood species and its growing demand for other purposes (Keepers 1945). A century later, financial considerations still drive the research in this area, particularly nowadays as roundwood is used at an industrial scale (Bäucker et al. 2014a). The implementation of modern technologies has facilitated that this issue can be studied more deeply; this has allowed time and cost reductions due to the implementation of modern sensing technologies.
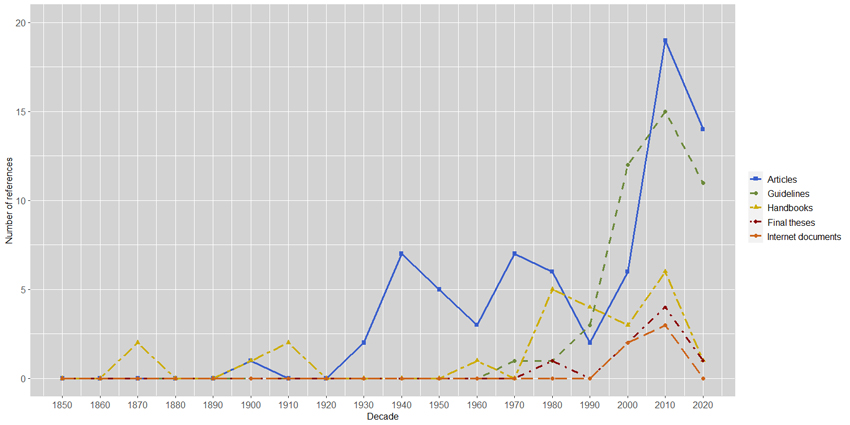
Fig. 2. Decennial sum of the published references about the estimation of conversion factors and their influencing parameters categorized by type of document. View larger in new window/tab.
It is worth noting that the use of the developed methods to estimate the conversion factors was regulated just after the decade of 1970; this is quite late compared to the high number of research studies reported and published in previous years. Those regulations, represented by guidelines, legislations or framework agreements for the roundwood trade, have increased gradually; thus, since the first decades of the 21st century, either the measurement methods have been regulated or the regulations have been updated and renewed.
3 Methods to estimate the conversion factors from gross volume to net volume
In the analyzed references, two general groups could be identified:
- Methods to estimate solid wood content (and conversion factors) in the first group can be classified into two different categories: 1) direct and 2) indirect. The direct methods aim to determine the logs’ volumes directly whereas the indirect methods aim to estimate the voids’ volumes in a stack (von Seckendorff-Gudent 1878).
- Methods in the second group can be classified into two categories: exact and approximate methods. According to this classification, the exact methods are: 1) the xylometric method, 2) the hydrostatic method and 3) the gravimetric method, whereas the approximate methods are: 1) the diagonal method, 2) the network method, 3) the photographic method and 4) the Bitterlich or angle-gauge method (Câmpu et al. 2015).
However, the references, which were found in this literature review, reflected a broader spectrum of developed methods to estimate the conversion factors or the solid wood content. That spectrum encompasses more methods than those that were included in the previous two groups identified. Thus, a new classification, which includes all found methods, is suggested in the current literature review (Fig. 3).
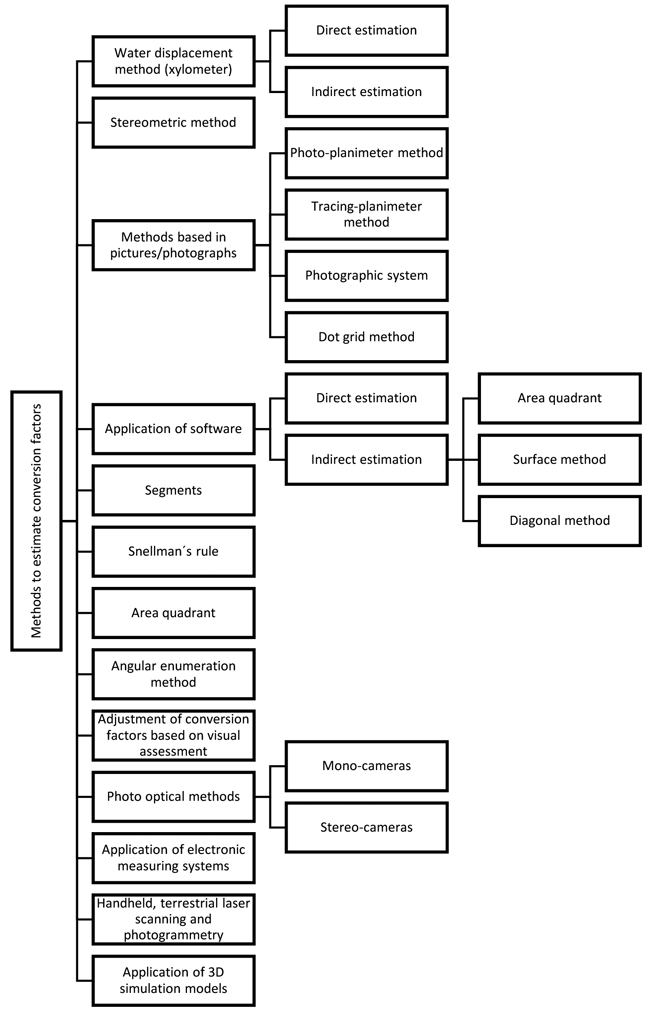
Fig. 3. Classification of the found methods to estimate conversion factors.
3.1 Water displacement or xylometric method
3.1.1 Direct estimation
The xylometric method was one of the first used to estimate solid wood content and determine conversion factors (von Seckendorff-Gudent 1878; Baur 1879; Graves 1906; Huffel 1919; Schnur 1932; Keepers 1945; Mountain 1949). There are several possibilities to achieve that goal with this method:
- By immersing the logs in a xylometer and measuring the water volume displaced (or the increase of the water level) (Huffel 1919; Keepers 1945; Diéguez Aranda et al. 2003; González et al. 2010; Romahn de la Vega and Ramírez Maldonado 2010; Ljubojević et al. 2011);
- By introducing the logs in the xylometer, filling it with water up to a determined level, then extracting the logs and measuring how much the water level has decreased (Ljubojević et al. 2011);
- By measuring the increase in weight after placing the logs inside the xylometer or the decrease in weight of the xylometer by extracting the logs and converting the weight variation into a variation in water volume (Ljubojević et al. 2011).
The xylometric method is deemed one of the most accurate ways (Emanuelli et al. 1997) or probably the most accurate way to measure the logs’ volume in a stack (Keepers 1945). This method has disadvantages when the logs or stacks are too big (Bertola et al. 2003). Moreover, this method is not extensively used for measuring large quantities since it requires using costly equipment and the transport of the roundwood to the location where this equipment is installed. Numerous conversion factors, which are included in various measurement guidelines, have been determined using this method in several previous research studies (von Seckendorff-Gudent 1878; Baur 1879; Emanuelli et al. 1997; Batista and Zarate do Couto 2002; Ljubojević et al. 2011; Câmpu 2012; Câmpu et al. 2015).
3.1.2 Indirect estimation
Indications about this method could be found in references from the 19th century; it consists in placing the logs in a closed container after measuring the gross volume of the stack made up of them. Afterwards, water or dry sand was poured into the container until it was full and all spaces between logs filled. Finally, the volume of water or dry sand was measured, so the net stack volume could be calculated (von Seckendorff-Gudent 1878; Baur 1879).
3.2 Stereometric method
This method was used to estimate the net stack volume applying a pre-determined formula and dividing the stack’s net volume by the gross volume. The first studies that used this method comprised preparing the logs with determined dimensions and their assembly near heavy frames designed to hold a specific stack volume (von Seckendorff-Gudent 1878) or a half unit of 5-foot wood (Barret et al. 1941). Like in the first studies, individual log scaling is currently advised in several measurement guidelines (Hamilton 1975; Cailliez 1980; Edwards 1998).
The method consists in measuring the log diameters at both ends and/or at the midpoint and calculating the volume by applying the Newton formula, the Smalian formula (Barret et al. 1941; Emanuelli et al. 1997; Edwards 1998; Barros et al. 2008; Ljubojević et al. 2011), the Huber formula (Emanuelli et al. 1997; Batista and Zarate do Couto 2002; González et al. 2010; Ljubojević et al. 2011), or Rieckes formula (Ljubojević et al. 2011). By applying this method, conversion factors (over and under bark) can be obtained depending on measuring those diameters under or over bark. Generally, this method is costly and time-consuming since it entails scaling each log individually, with results that do not differ significantly from those obtained using water displacement method (Keepers 1945; Emanuelli et al. 1997). Nevertheless, some exceptions can occur when the diameter and length measurements are rounded (down) (Ljubojević et al. 2011).
When scaling large quantities, it is necessary to select samples representing the whole roundwood measured (Keepers 1945). Moreover it must be pointed out that the application of the Newton formula still requires that many measurements are taken, making this process very laborious (Cailliez 1980). Thus, measuring the diameter at both ends of the log and applying the Smalian formula is recommended. This step is repeated forsome stacks; the conversion factor is then calculated by dividing the total volume of the individually measured logs by the stack volume comprised ofthe measured logs (Cailliez 1980).
The stereometric method has also been used to determine conversion factors for practical use in various research studies as well as to analyze the influence that log and stack parameters have on the conversion factors (Frothingham 1912; Barret et al. 1941; Keepers 1945; Emanuelli et al. 1997; Batista and Zarate do Couto 2002; Barros et al. 2008; González et al. 2010). Moreover, further developed methods are currently available. According to a Brazilian source, the traditional approach to estimate the conversion factors is based on cutting trees and preparing logs from representative areas and forest conditions (age, local quality, the distance between trees, etc.). The logs are stacked, and the stack volumes are measured (both gross and net volume) to obtain the average conversion factor from all built stacks (Bertola et al. 2003).
Further, three variants of this method have also beenfound in the English forest mensuration handbook, the research effort conducted by Smith in 1979 and the New Brunswick (Canada) scaling manual.
- The method outlined in the English forest mensuration handbook consists in dismantling the stack and measuring the volume of the individual logs, and from there, the stack volume (Hamilton 1975). Each log’s volume is scaled considering the specified length and the diameter at the midpoint of the specified length, measured from the butt end. Usually, the net stack volume may be estimated by measuring the solid volume of a sample of logs. The sample size depends on the number of logs in a stack. The stack volume is computed as the sample volume multiplied by the total number of logs and divided by the number of logs in the sample. The number of stack samples required to estimate the conversion factor depends on the precision required (Hamilton 1975).
- Another variant to estimate the solid wood content is the cube-scale method. This method is outlined in the section 5.3.2. of the document “Scaling roundwood”, published by the Canadian Standards Association (1977). It involves the measurement of the top diameter of all logs on one stack’s side. The logs’ volumes are then calculated by applying the formula of a cylinder’s volume with the same diameter as the log’s diameter and assuming the same length for all logs. Once deductions are made, all calculated logs’ volumes are added up to estimate the net stack volume. Afterwards, the stack volume is measured according to the method outlined in chapter 7 of the “Scaling Roundwood” report (Canadian Standards Association 1977). Once the solid-wood volume and the volume of a sample of stacks have been calculated for a logging area or shipment, the solid wood (stacked volume ratio or conversion factor) is finally calculated by dividing all logs’ volumes by all measured gross stack volumes (Smith 1979).
- The last found variant is a similar procedure to the previous method. It is described in the log scaling manual of New Brunswick (Canada). Firstly, the volume of every stacked log is calculated. For that purpose, the diameter of the end of a stack’s face is measured under bark by consistently holding the scale stick. In the case of quite oval logs, an average diameter is calculated, while in logs with butt swell, the small butt diameter must be recorded. When the diameters of every half log, on both stack’s faces have been measured, they are added up by diameter class and multiplied by the volume per log in order to estimate the total volume by diameter class. These volumes are totaled to calculate the net stack volume. Afterwards, a “taper adjustment” must be applied to the calculated net stack volume to account for the log taper associated with butt logs featuring buttressing. For that purpose, it is necessary to calculate a taper adjustment factor (taper adjusted solid content). Afterwards, the gross stack volume is calculated. Finally, the conversion factor is calculated by dividing the taper adjusted solid content of the stack by the figure resulting from subtracting the volume of voids to the gross tack volume (New Brunswick Forest management branch natural resources 2012).
3.3 Methods based on photos
3.3.1 Photo-planimeter method
This is the first method that used photos to quantify the solid wood content in a stack and estimate the conversion factors. This method consists in photographing both sides of a stack. Next, a scale with a white background and a 100-square-inch black square on top is set in the same vertical plane as the ends of the logs. Using this scale in each picture and outlining all the log ends with a white piece of chalk, it is possible to measure the end areas of each log on the photograph. Thus, by taking the area of the photographed scale as a reference, the actual end areas in square inches are calculated (Barret et al. 1941).
3.3.2 Tracing-planimeter method
This method consisted in disassembling a stack and tracing both ends of each log on heavy, oiled tracing paper. Afterwards, the areas of these tracings are used to measure the final area of each log’s end in square inches (Barret et al. 1941).
3.3.3 Photographic system
C. Keepers developed the first method of this category as another approach to estimate the solid wood content. This system emerged due to the need to accelerate the measurement processes, mainly when a large amount of roundwood arrived at the production facilities in a short time window, causing a high degree of yard congestion. Its development was possible through photographs of the stacks (Keepers 1945). The original method measured, on a picture, the proportion of air space to the wood area and the air space on a number of equidistant, parallel lines across the face of a stack. In addition, an optical instrument was designed specifically to make the necessary measurements. This method was tested, and the values obtained by the photographic method came closer to the results obtained with the xylometer than the values resulted from the stereometric method (Keepers 1945). The measurement process was demonstrated to be fast, reasonably accurate and inexpensive. The method did not require much experience and the calculations were reduced to simple arithmetic operations. Furthermore, all individual measurements of stacks or logs and potential resulting errors were removed. In this regard, this method constituted an excellent option for purchasing roundwood on a sound, scientific basis and made it possible to keep the photographic records for future reference (Keepers 1945).
3.3.4 Dot grid method of scaling
This method, which Mountain first described in 1949, is outlined in several handbooks, e.g., the scaling manual of the Canadian province of Nova Scotia (Nova Scotia Natural Resources 2007), other handbooks (Diéguez Aranda et al. 2003; Romahn de la Vega and Ramírez Maldonado 2010) and several research studies (Mountain 1949; Emanuelli et al. 1997; Batista and Zarate do Couto 2002; Bertola et al. 2003; González et al. 2010). It uses a rectangular piece of clear plastic with dots spaced on a grid to represent a determined number of volume units. Notably, several variants have been developed during the last decades, e.g., the method developed in Finland by Keltikangas-Ahonen or the one developed by the forest technician Heinonen (Aro 1958). Its principle is to find the relation between the solid wood and the voids and bark in a stack of rough pulpwood. This method, which is fast and accurate (Mountain 1949; Emanuelli et al. 1997), was used initially to measure the gross stack volume (Nova Scotia Natural Resources 2007). However, as can be deduced from some references, the solid wood content can also be obtained this way (Mountain 1949; Romahn de la Vega and Ramírez Maldonado 2010).
The process is carried out as follows: the grid is placed vertically on the picture against the stack’s face beginning at one end and ensuring that the grid covers all wood on the extremity of the stack. A trace of the stack can also be used (Romahn de la Vega and Ramírez Maldonado 2010). Afterwards, the dots falling on the end surface of the stack are counted. Moreover, the dots that fall on the interstices between logs are also counted to estimate the stack’s face section. Should the grid not cover the whole stack, an edge of the grid in the stack’s face with a lumber crayon is marked, later moving the grid to the new position with the grid’s edge lined up with the mark. In doing so, the grid’s edge indicates the previous position. This step must be repeated as much as necessary in order to cover the whole stack (Nova Scotia Natural Resources 2007). Garland (1968) however demonstrated that it is not necessary to sample the entire face of the picture since a sample of only 20% of the stack’s face would be enough (Garland 1968; Bertola et al. 2003).
The spacing of the dots on the grid represents their volume. The volume is calculated by multiplying the total number of dots by the volume represented by each dot. The volume obtained in this way is gross scale and deductions corresponding voids and defects must then be calculated as described in the manual (Nova Scotia Natural Resources 2007; Romahn de la Vega and Ramírez Maldonado 2010). Finally, the conversion factor is estimated by dividing the number of dots within the face section of the logs by the number of dots within the stack’s face section (Romahn de la Vega and Ramírez Maldonado 2010).
Some research studies concluded that estimating the solid wood content through this method is as accurate as the measurement in situ (Mountain 1949; Emanuelli et al. 1997; Kallio et al. 1973) or the water displacement method (Mountain 1949). Other authors could specify that the deviation in solid wood content obtained when applying this method is smaller than 2% compared to the measured solid wood content (Emanuelli et al. 1997). In contrast, Rezende (1988) in Brazil found that this method tended to underestimate the conversion factors for stacks made up of eucalyptus logs. Those underestimates would increase in stacks with large-sized logs (Rezende 1988; Bertola et al. 2003).
A similar method developed in Chile, known as Método red-400 (grid-400 method), consists in counting the dots distributed systematically on an area to be evaluated. This method uses a dot grid built in a frame of 1m2 (1 m by 1 m). Each dot is obtained in the intersection of the cords placed every 5 cm on the frame. The number of dots that fall in the logs (solid wood) determines the surface occupied by the wood in each sample. The dots’ density and the design of the grid-400 enable a perfect compensation of the border effect. The surface covered by the log faces (m2) is calculated by multiplying 0.0025 (i.e., the surface that represents each dot on the solid wood in m2) by the number of dots that fall in the log faces (Emanuelli et al. 1997; Cancino et al. 1997).
3.4 Application of software
The use of software recently developed in Brazil and Russia enables direct or indirect estimation of the conversion factors. In this study, existing software used for estimating conversion factors was classified into two categories:
- Direct estimation, i.e., the software providing the conversion factors directly.
- Indirect estimation, i.e., the software is used to edit pictures to estimate conversion factors by measuring specific areas in the pictures, e.g., log end area.
3.4.1 Direct estimation
With the development of the IT-technology, the methods based on pictures to determine conversion factors became obsolete, giving place to the development of the first programs, such as Digitora (Bertola et al. 2003). Digitora could estimate conversion factors and, in some cases, the net stack volume from pictures taken from the front and rear sides of the stacks. Based on real measurements, the evaluation of this software demonstrated its accuracy when providing conversion factors (Bertola et al. 2003). Kruglov developed another program that models the logs in 3D from pictures of the stack’s faces. Using log pile photogrammetry, this algorithm deviated from the measurement manual piece-by-piece method by less than 9.2%. (Kruglov and Shishko 2017). Although it is possible to estimate conversion factors using this software, it was not the primary purpose of its development. Recently, Artificial Neural Networks have been implemented to estimate conversion factors, e.g., the software NeuroDIC 2.0. This software was developed in JAVA and allows importing pictures of the stack faces. Afterwards, several filters can be applied to facilitate sample selection. Next, the variables are defined to obtain training data and implement the Artificial Neural Networks. Consequently, it is possible to estimate the stack volume as well as the proportion of voids and wood in a stack (Silva Silva 2019).
3.4.2 Indirect estimation
3.4.2.1 Area quadrant method by editing pictures digitally
This method involves taking pictures of stack sides (front/rear) with a commercially available camera. The faces of the log ends are manually recorded, and the digital images are binarized. Afterwards, pictures analysis is performed to calculate the proportion of wood and voids. Finally, the conversion factor was computed as the average value of the proportion of the areas of the logs’ ends without the representative bark share measured for each stack (Bäucker et al. 2014a,b).
3.4.2.2 Surface method
The surface method is based on setting an area quadrant on a picture of stack faces (Câmpu et al. 2015). This quadrant comprises a quadrilateral figure of known dimensions set on the image of the photographed stack faces. The pictures are taken perpendicularly to each stack face, and then processed using a CAD tool. The conversion factor is determined as the ratio between the sum of the surfaces of the log ends and the surface of a quadrilateral figure that contains the logs in the picture (Câmpu et al. 2015). A variant of this method was developed in Russia (Knyaz and Maksimov 2014), with a similar approach to estimate the conversion factors to that developed by Câmpu et al. (2015).
3.4.2.3 Diagonal method
This method applies to stacks with rectangular form and consists of drawing two diagonal lines on the stack faces (front/rear) from the top left corner to the right bottom corner and from the top right corner to the left bottom corner. The segments that overlap the log ends are measured, and their lengths added up. The conversion factor is then calculated by dividing the total of all overlapped segments by the sum of the diagonals lengths (Câmpu 2012; Câmpu et al. 2015).
3.5 Segments
When applying this method, a line is drawn on the face of the stack. The conversion factor is then estimated by dividing the sum of the segments that cover the log ends by the line length. A variant of this method involves nailing a bar (e.g., 2 m or 3 m long) on the face of the stack. After that, the segments covering the logs’ ends are measured and added up. The conversion factor is estimated by dividing that result by the length of the the bar. (Slangen and van Boven 1981).
3.6 Snellman´s rule
This method involves setting a 1 m rule (graduated in cm) on the face of the stack. The conversion factors is then estimated by dividing the number of marks in each centimeter that falls on the wood area of the log ends by 100. This process must be repeated several times, setting the rule on different positions to obtain an average value (Diéguez Aranda et al. 2003).
3.7 Area quadrant
Estimating the conversion factors by using an area quadrant is a very common and widely-used method. Consequently, this method presents several variants in its application. Specifically, ten similar methods were found in the analysis of the references of seven different countries: Ireland, the United Kingdom, Canada, Mexico, Spain (two variants), Uruguay, Poland and Chile (two variants).
- According to the Irish references the measurement process using this method consists of fixing an area quadrant to the face (front/rear) of the stack. Next, the diameter of all log ends falling within the quadrant is measured. These measurements must be recorded over bark to the nearest whole centimeter using a tape or small ruler. This step must be repeated at regular intervals on the front and rear sides of the stack and along the length of the stack. The number of the samples taken depends on the stack’s size and the variation in the log and stacking quality. Afterwards, a count or tally of the logs in each end diameter class from all samples must be made. Each count is multiplied by the surface area associated with that diameter class in order to calculate the total surface area per diameter class. These sums are added to compute the total surface area of the log ends from all quadrants. The total area of the stack surface sample is calculated by multiplying the area of the quadrant used by the number of samples taken. Finally, the total surface area of log ends from all quadrants divided by the total area of stack surface sampled provided the conversion factor to be applied to obtain the net stack volume from the previously measured gross stack volume (Purser 1999; Meyen and O´Connel 2012).
- In the United Kingdom, the application of this method involves calculating the area on the side (front/rear) of a stack occupied by the log ends per unit of total area on the stack’s sides. For that purpose, a rectangular grid or dot grid is placed against the stack face. Afterwards, the number of intersections or dots falling on log ends counted relative to the number of intersections or dots falling on both log and gaps provides a quick easy estimation of the conversion factors (Hamilton 1975).
- In the scaling standard of the Canadian region of Saskatchewan, a specific conversion factor for the stack is determined by painting a required number of 1 m by 1m squares on the stack’s face. The number of squares is determined by multiplying the area of the stack face times 10%, rounding the result to the nearest whole number. The calculated number of squares is then randomly painted across the face of the stack so as to represent the log size distribution and defect distribution. Afterwards, the solid wood content of the squares is determined by scaling the diameters to the nearest 1 cm and the logs’ length is the average pile width. All diameters where the face is more than halfway into the sample must be considered part of the sample. The conversion factor for the stack is defined by dividing the gross solid wood volume of the samples by the gross stacked volume of the 1m by 1m samples. The solid volume is finally estimated by multiplying the stack volume times the conversion factor (Saskatchewan Ministry of Environment 2021).
- A comparable method, which is used in Oaxaca (Mexico), consists of making a wooden quadrant or square with a surface of 1 m by 1 m (1 m2) and gridded with separations every 10 cm, into which thread fastened with nails was placed. In doing so, a uniform mesh with 81 interior points (and totally 100 points) was formed. The conversion factor was then determined by dividing the number of points falling in the logs by the total number of points (Galán Larrea et al. 2014).
- One Spanish variant of this method consists of setting a wooden quadrant (1 m2) on the stack faces (front/rear), one or more times, and deducing first the number of logs and the approximate total of logs that form the stack. Next, the average of the area of the log ends within the quadrant is calculated. Finally, the rate is obtained as well as the percentage that must be applied to obtain the solid wood content (Baró y Zorrilla 1948). Another variant of this method involves using a wooden quadrant with a metallic square net. This quadrant is set on the stack face, and the number of quadrant vertices falling on the wood surfaces of the log ends are counted. The conversion factor is then calculated by dividing the number of vertices that fall on the wood surfaces by the total number of vertices of the wooden quadrant (Diéguez Aranda et al. 2003).
- In Uruguay, a quadrant, whose sides are 1 m, is set on one stack face. The logs whose end face center falls within the quadrant is identified and its diameter measured. The areas of the log ends are calculated and totaled. The result of that addition is the conversion factor for that stack. This process should be repeated in different places of the stack face. Afterwards the average value of all calculated conversion factors corresponds to the conversion factor for that stack (Acquarone et al. 2021).
- In Poland, a quadrant is drawn on the stack face. The quadrant sides are 1 m. For the measurements, a diagonal is drawn on the quadrant, crossing the sections of the logs. To get the conversion factor of the stack, the diagonal lengths on the log ends are added up, and that result is then divided by the whole length of the drawn diagonal (Michalec and Wąsik 2020).
- In Chile, two variants of this method could be found:
a. Método marco simple (simple frame method): the simple frame method consists of measuring the log end diameter (under bark) and estimating later the section which is based on the fraction of the diameter included in the unit (values are to be extracted from a table). In the logs placed on the vertexes, that fraction is determined based on the shortest distance between the log and the sample’s border (Emanuelli et al. 1997).
b. Método marco CEM (CEM frame method): the CEM frame method, consists of calculating the real surface fraction included in the logs placed in the sample’s border. This method involves measuring the log end diameter under bark; two distances: first, between the log’s center and the samples’ border in those logs placed in the vertexes of the sample; and second, between the logs placed in other points of the sample’s border. This method enables to determine accurately the log surface contained in the sample (Emanuelli et al. 1997).
3.8 Angular enumeration method
This method allows a direct determination of the conversion factors. This method is based on the angular enumeration principle of Bitterlich. This method involves rotating an angle from a point on a stack’s face and counting all the log top ends that are not fully overlapped by the angle to a predetermined distance from that point. The construction of that angle and radius defines a constant of proportionality between the number of log top ends counted and the ratio of the surface of the log top ends and the area of the circle formed by rotating the angle. The conversion factor is then calculated by multiplying a constant by the number of top logs counted. Bitterlich (1984) suggested a constant equal to 1/100. An instrument able to generate this constant only requires an angle with a radius five times the aperture angle at the radius end (Batista and Zarate do Couto 2002).
3.9 Adjustment of the conversion factor based on visual assessment
Similar methods have been developed to estimate the conversion factors in situ in the northern European countries of Sweden, Lithuania, Latvia, Estonia, Denmark and Finland. The conversion factors start with an initial value which is adjusted based on a visual assessment of the stack considering different log and stack parameters until a final figure is obtained and applied to estimate the solid wood content. The starting value in Sweden, Denmark, Estonia, Latvia and Lithuania depends on the tree species (Keskkonnaministri 2006; Danske skoves handelsudvalg 2008; Ladusāns and Buļs 2010; Lietuvos Respublikos Aplinkos Ministro 2010; Tebėra 2019; Biometria 2020), while in Finland, the starting value depends on the log length (Asikainen et al. 2009; Lindblad 2011; Luonnonvarakeskus 2017). The net volume estimation is obtained by multiplying the calculated conversion factor by the measured gross volume (Lietuvos Respublikos Aplinkos Ministro 2002; Asikainen et al. 2009; Fonseca 2010; Ladusāns and Buļs 2010; Lindblad 2011; Luonnonvarakeskus 2017; Biometria 2020; FAO et al. 2020).
The accuracy of this method in Finland has been analyzed and revised in previous studies (Heiskanen 1973; Heiskanen and Salmi 1975). While some improvements have been performed, e.g. the addition of some classes for the parameters crookedness or diameter (Heiskanen and Salmi 1975), the results reported in the other studies indicated that the assessment of the solid wood content were reliable enough for all tree species (Heiskanen 1973). Furthermore, the stacking method and the human factor played an important role. Studies revealed that the training provided to the people did not reduce the deviation of the results, although it reduced the error compared to the correct evaluation (Heiskanen 1973). It is also worth noting that adequate supervision and control systems had to be established to prevent the application of this method could tend to favor the employer (Heiskanen 1973). Later studies showed that this method’s measurement accuracy is very poor when using it in practice (Asikainen et al. 2009). For instance, Lehtimäki (2001), who is cited by Asikainen et al. in 2009, estimated a standard deviation in the measurement error from 7 to 8% for pulp logs with a length of 3 m. Likewise Sairanen (1995) estimated a standard deviation of the measurement error from 3 to 13% for pulp logs with a length exceeding 3.5 m. The errors could also reach standard deviations ranging from 20% to 25% for volumes lower than 20 m3. The tree species considered in the studies conducted by Lehtimäki (2001) and Sairanen (1995) were pine (Pinus sylvestris L.), spruce (Picea abies (L.) H. Karst.) and birch (Betula pendula Roth). Those errors were generally caused by the technical difficulties and the human influence when measuring the stack volume. This resulted in the subjective evaluation and successive generalizations of the respective influencing parameters when estimating the solid wood content (Asikainen et al. 2009).
3.10 Photo-optical methods
These methods are classified into a new category and separated from methods based on pictures and those using some software. This is due to two important factors: 1) these methods use machine learning and artificial intelligence in order to automatically recognize the log ends without printing the images and applying grids such as the methods included in the section 4.3. and 2) generally, computer use is not needed as field results can be obtained using a tablet or a smartphone in contrast to the methods included in the section 4.4.
For the last ten years, the determination of the conversion factors has been able to be computed by apps, which are usually used for measuring the stack gross and net volumes by applying photo-optical methods. Examples include tools such as TIMBETER (TIMBETER Ltd.) in Estonia or Trestima Stack in Finland (Kärhä et al. 2019; Trestima Ltd.). These apps are drawing increasing attention in the forest sector (Opferkuch et al. 2017), and are currently used by many companies (TIMBETER Ltd.) in numerous countries (Berendt et al. 2021b). Their use is mainly applied for quality control. However, two of them have also been certified as calibrated methods: sScale and LogStackPro developed respectively by DRALLE Ltd. and the HEIDEGESELLSCHAFT, Forstprodukte und – geräte Ltd.
Currently, there are two possibilities for taking the pictures using photo-optical methods: mono and stereo cameras. While the latter ones are normally mounted onto a car, do not need a reference and are officially calibrated, the former ones usually apply these methods with tablets or smartphones and do need a reference (either the length of the stack or a pattern set on a stack`s face). These methods are based on artificial intelligence (machine learning) and techniques that enable processing images in order to recognize the log ends and measuring their surface and/or the surfaces of the front and rear sides of the stacks and measuring these as well.
In scaling the gross volume of a stack, the app recognizes the stack faces (front/rear) and traces a contour that delimits the faces. Where required, post-processing of the contour is traced by the app. Subsequently, the app measures the surface of the stack`s face and multiplies this by the logs` length (order length). The resulting total is the stack gross volume, measured in m³ (st) or steres depending on the country. For computing the net stack volume, another variant of this process recognizes and measures the area of the log ends, multiplying the sum of all measured areas by the order length. Furthermore, several apps can directly estimate the conversion factors (known in some apps as the density factor) (TIMBETER Ltd.) or implement the conversion factors outlined in the measurement guidelines used in the respective countries, e.g., iFOVEA (SDP Digitale Produkte GmbH) or AFoRS (Scheller Technology GmbH).
3.11 Application of electronic measuring systems
A recent research study has used a 3D-system in the production facility to measure the logs’ volumes individually after measuring the gross volume of the stacks in the forest; it used the sectional volumetric measurement method outlined in the German framework for roundwood trade (Heinzmann 2017; RVR 2020). The conversion factors are then obtained by dividing the sum of every log’s volume by the gross stack volume (Heinzmann and Barbu 2017). The calibrated roundwood measurement system of the class JORO-3D was used. This kind of device could take the following measurements: log length (m), diameters at both ends and at midpoint (cm), taper (cm/m), crookedness (%) and log ovality (%) (Heinzmann and Barbu 2017). The measurement of the log’s volume using this kind of device is deemed the most accurate. However, its implementation has not yet been spread everywhere (Witkowska and Jodłowski 2018).
3.12 Application of handheld laser scanning and simultaneous localization and mapping (SLAM) technology, photogrammetry and terrestrial laser scanning
Recent publications have shown methods to estimate the volume of logs of industrial wood with high accuracy using handheld laser scanning and simultaneous localization and mapping (SLAM) technology (De Miguel-Díez et al. 2021b, 2022c). Moreover, further methods have been developed using such devices and technology to estimate the gross stack volume (Borz and Proto 2022; Purfürst et al. 2022). The combined application of these developed and tested methods could also lead to the estimation of reliable conversion factors considering the successfully proven high accuracy of these developed methods. Nevertheless, it is worth noting based on the analysis of results of this literature review that the operational application of these methods could still be costly.
Notably, similar methods which involve photogrammetry or terrestrial laser scanning have recently been or are currently being developed (Forsman 2016; Purfürst et al. 2022). These methods could also lead to estimate conversion factors accurately in the near future.
3.13 Application of 3D Simulation models
Recently, 3D simulation models have been developed to determine conversion factors and analyze the influence of stack and log parameters (De Miguel-Díez et al. 2021a,c,d; Miesner 2021; De Miguel-Díez et al. 2022a,b). This approach has numerous advantages: 1) the estimation of the conversion factors is automatically performed, 2) reduced costs and time involved in data collection and 3) the analyses of the influence exerted by the log and stack parameters resulted in solid statements based on broad statistical bases.
The first 3D simulation model was successfully developed in 2017 to measure roundwood stacks’ volume (Kruglov and Shishko 2017). However, that simulation model did not allow the analysis of the influencing parameters on the conversion factors. In 2021, a similar simulation model was developed, but this 3D simulation model enabled to analyse the influence of log parameters on the conversion factors based on a comprehensive statistical basis. However, this model had important shortcomings, such as it was not able to generate the logs thoroughly virtually, e.g., it could not simulate the bark. Moreover, the results provided by that 3D simulation model were not validated with real measurements (Miesner 2021; De Miguel-Díez et al. 2022a). In contrast, another 3D simulation model was developed and evaluated based on real measurements. The validation results showed its high accuracy in virtually generating and stacking the logs and estimating the stack gross and net volumes (De Miguel-Díez et al. 2022a). This simulation model was specifically designed and developed to estimate conversion factors, analyze the influence of the log and stack parameters on the conversion factors, and determine stack volume and solid wood content on a statistical basis. Based on the inputted data (real data and/or data defined by the user), the model can simulate as many stacks as required by the user. The simulation results are the stack volume, the solid wood content, the conversion factors, and the bark share in the stack. The simulation model can accurately reproduce three different measurement methods: 1) the sections volumetric measurement method outlined in the German framework for roundwood trade (RVR) (RVR 2020), 2) the photo-optical and 3) the polygonal line methods, which delimits the surface of the stack sides (front/rear). The use of the 3D simulation model allows for specific conversion factors (drawn from large databases) for each assortment and tree species, saving time in the process (De Miguel-Díez et al. 2022a). Determining these specific conversion factors was suggested as the best solution in some of the sourced identified (Fonseca 2005).
4 Influencing parameters on the conversion factors
Considering the references analyzed, the influencing parameters can be classified into three categories: 1) log parameters, 2) stack parameters and 3) external parameters. These categories can be deduced from several current measurement guidelines used in different countries and previous research studies, e.g., Nikkilä et al. (1974) divided the influencing parameters into three categories: 1) pulpwood properties, 2) stack qualities and 3) parameters related to the measurement. In addition, a new category, the external parameters, had to be separately categorized to include those parameters that are not dependent on the roundwood or the stack features but the environment or the related preparation operations. These parameters are not outlined in most measurement guidelines nor in the majority of the previous research works. The effect of some parameters is limited to some countries or regions, while others depend on specific aspects of the roundwood supply chain in the country or region.
This review considers the log parameters crookedness, taper, delimbing quality and irregularities separately. This is opposed to previous studies that have treated these parameters together (Zon 1903; Mountain 1949; Wabo 2002; Meza-Montoya and Simón 2005). However, it has been clearly indicated that the logs form has an important influence on the conversion factors. Notably, it has been indicated that the straighter and smoother the logs, the fewer air spaces in between, and consequently, the higher the solid wood content. Moreover, it is worth clarifying that the statements about the effect of the influencing parameters described below are focused on their individual effect, although in combination, they can also influence the conversion factors (and the solid wood content). Moreover, it must be pointed out that diverse statements concerning the respective influencing parameters are compiled and described below. These considerations differ from each other depending on the data and studies analyzed.
4.1 Log parameters
4.1.1 Midpoint diameter
The vast majority of the references confirm that this parameter strongly influences the conversion factors. Research outcomes have shown that the solid wood content increases as the midpoint diameter of the logs increases, i.e., the conversion factors increase if the midpoint diameter does it too (von Seckendorff-Gudent 1878; Baur 1879; Zon 1903; Frothingham 1912; Huffel 1919; Schnur 1932; Schmidt 1940; Barret et al. 1941; Keepers 1945; Reinhold 1951; Makkonen 1960; Williams 1968; Nikkilä et al. 1974; Pita Carpenter 1984; Sairanen 1987; Zarate do Couto and Magalhães Bastos 1988; Briggs 1994; Bertola et al. 2003; Diéguez Aranda et al. 2003; Meza-Montoya and Simón 2005; González et al. 2010; Ljubojević et al. 2011; Bäucker et al. 2014a,b; Foelkel 2015; Forest Service of Newfoundland and Labrador 2016; Heinzmann and Barbu 2017; Witkowska and Jodłowski 2018; Jodłowski and Witkowska 2019; De Miguel-Díez et al. 2021a, 2022b). This statement is also endorsed by several roundwood measurement guidelines (Schulting 2002; Environment and Sustainable Resource Development - Government of Alberta 2006; New Brunswick Forest management branch natural resources 2012; Forest Service of Newfoundland and Labrador 2016; Biometria 2020; Acquarone et al. 2021; Saskatchewan Ministry of Environment 2021).
Although research studies have demonstrated the above relationship, there is a disparity in the current measurement guidelines used in different countries. The Swedish and Finnish guidelines for timber measurement confirm the strong influence of this parameter, in the case of the Swedish guidelines with a variation of 17 percentage points (pp) in the solid wood content have been reported for a mean diameter range from 4 cm to over 80 cm (Biometria 2020) and in the case of the Finnish guidelines, a total variation in the conversion factors of 9 pp for conifers and of 12 pp for hardwood species has been reported for a mean diameter ranging from 9 cm to over 25 cm (Luonnonvarakeskus 2017). This statement is also supported by references from the United States of America, where, e.g., the solid wood contents of stacks made up of straight, smooth logs can vary from less than 6 inches and more than 12 inches between 10.5% (Loblolly pine - Pinus taeda L.) and 11.9% and (Longleaf pine - Pinus palustris Mill.). These variations can even be greater (Longleaf pine - Pinus palustris - 18.2% and loblolly pine - Pinus taeda - 20.7%) if the stacks are made up of crooked, rough and knotty logs (Williams 1968). A recently study conducted using a 3D simulation model reported a variation in solid wood content of 17.8% for Norway spruce (Picea abies) (De Miguel-Díez et al. 2022b).
Other previous research studies demonstrated a strong influence of this parameter on the conversion factors. Carrillo et al. (1985), cited by Dos Santos Lisboa et al. (2009), found a deviation of as much as 64% when applying a conversion factor that was not appropriate for a determined diameter class. On the other hand, the English forest mensuration handbook and the Irish timber measurement manual state that this parameter has little impact on the conversion factor (Hamilton 1975; Purser 1999). In addition, the English forest mensuration handbook indicates that the value of the mean diameter in the stack is unimportant (Hamilton 1975). A research work conducted in Poland endorsed the statement of the English and Irish measurement guidelines about the relation between the conversion factors and the average diameter to be insignificant (Witkowska and Jodłowski 2018), especially when considering the tree species.
From previous research studies, it could be deduced that the relationhip described above occurs due to the effect of three parameters: 1) the number of logs in a stack, 2) the effect of crookedness and 3) the bark share in a stack:
- Number of logs in a stack. According to the articles of Zon (1903) and Schmidt (1940) , the number of stacked logs is higher for stacks with the same gross volume but made up of small-diameter logs. This causes the number of voids in the stack to increase, which decrease the solid wood content. Specifically, the difference in solid wood content in two stacks with the same gross volume can be as high as 13% when one of these is made up of logs whose diameter are double the logs of the other stack. This difference can reach up to 25% if the logs’ diameters of one stack are four times those of the other stack (Zon 1903). Baur’s research indicated different variations of the solid wood content depending on the tree species. For a variation from 17.27 cm (6.8 inches) to 8.89 cm (3.5 inches), Baur reported a variation of 29.0% for hardwoods, 12.7% for softwoods and 21.2% for stacks made up of hardwoods and softwoods logs (Baur 1879; Zon 1903). Further found references supported this relationship, reporting that an increase in the number of logs increases the air space in the stack (Forest Service of Newfoundland and Labrador 2016) and thus the conversion factors decrease (Ljubojević et al. 2011; Foelkel 2015).
- Effect of crookedness. Previous research has confirmed that the crookedness in thin logs substantially influences the conversion factors (Reinhold 1951; Bäucker et al. 2014b). Consequently, voids are present with higher frequency as a stack is made up of thinner logs, resulting in smaller conversion factors (Forest Service of Newfoundland and Labrador 2016).
- Bark share. According to research studies from the middle of the 20th century, the stack’s bark share decreases as the stacked logs’ midpoint diameter increases (Reinhold 1951; Vorreiter 1954). Studies report this relation for Scots pine (Pinus sylvestris) and oak (Quercus spp.) since the bark share of the logs remains constant regardless of the midpoint diameter of the stacked logs (Bäucker et al. 2014a; Berendt et al. 2021a). Nevertheless, Chilean handbooks show that the bark share in a stack made up of radiata pine (Pinus radiata D.Don) logs increases as the mean diameter of the stacked logs increases. Consequently, the conversion factors from gross volume (o.b.) to net volume (u.b) remained constant. These documents show that the proportion of air space in the stack decreased as the mean diameter of the stacked logs increased and the number of logs in the stack decreased (Peters Nario et al. 1985; Vidaurre Echeverría et al. 1987). This effect usually leads to higher conversion factors; however, it is compensated by the increased bark share, which leads to reduced conversion factors (Peters Nario et al. 1985; Vidaurre Echeverría et al. 1987). However, this fact is probably only applied to that tree species.
Other parameters may also influence the effect of the midpoint diameter. Therefore, higher conversion factors cannot be obtained, even though the stacked logs’ midpoint diameters are higher (Bäucker et al. 2014a). In other words, other parameters can offset the impact of the midpoint diameters on the conversion factors.This effect was observed in a study conducted in Germany in 2014, which reported that the conversion factors did not vary significantly for stacked logs with larger diameters (Bäucker et al. 2014b). In this sense, this related parameter, the diametrical distribution (or variability of the stacked logs’ diameters), exerts an important influence on the conversion factors (Emanuelli et al. 1997; Bertola et al. 2003; Foelkel 2015; Schulting 2002). Furthermore, a Brazilian study showed that a wider diameter distribution could lead to lower conversion factors (Foelkel 2015). In contrast, a research study conducted by Nikkilä et al. (1974) showed that a mixture of logs of different diameters did not influence the net volume for conifers. In addition, the net volume was greater in the poorly mixed stacks of hardwood species. Lastly, a Spanish study reported that a suitable log diameter combined with a careful stacking process could increase the conversion factors; this is so since the voids caused by logs with higher diameters could be filled with thin logs (Baró y Zorrilla 1948).
4.1.2 Length of the logs
The impact of log length has been reported to be very strong in many research papers. Concretely, all research studies have demonstrated that the conversion factors decrease as the length of the logs increases (von Seckendorff-Gudent 1878; Huffel 1919; Keepers 1945; Eklund 1948; Reinhold 1951; Makkonen 1958; Briggs 1994; Bertola et al. 2003; Romahn de la Vega and Ramírez Maldonado 2010; Câmpu 2012; Shegelman et al. 2012; Câmpu et al. 2015; Foelkel 2015; Witkowska and Jodłowski 2018; Jodłowski and Witkowska 2019; Michalec and Wąsik 2020). This relationship is also supported by a high number of roundwood measurement guidelines used in different countries (Batista and Zarate do Couto 2002; Schulting 2002; Environment and Sustainable Resource Development - Government of Alberta 2006; New Brunswick Forest management branch natural resources 2012; Russian state scientific center of the timber industry complex 2013; Podkorytov 2015; Forest Service of Newfoundland and Labrador 2016; Director General of the State Forests 2019; Biometria 2020; RVR 2020; Saskatchewan Ministry of Environment 2021). The Swedish guidelines report a total variation of 5 pp for conifers and of 7 pp for hardwood species (Biometria 2020).
Thus, the Finnish guidelines suggest these starting values to determine the conversion factors. Variations of 7 pp for hardwoods and 8 pp for conifers are reported for this parameter (Luonnonvarakeskus 2017). In the research conducted by Zon, different variations in the solid wood content have been reported depending on the log form (stick form): straight (13.8%), crooked (23.5%) and knotty (34.5%) (Zon 1903). Huffel (1919) reported a variation in solid wood content of 12% for log lengths ranging from 0.5 m to 1.5 m. A study conducted using a 3D simulation model reported a variation of 7.9 % the effect of this parameter in Norway Spruce (Picea abies) (De Miguel-Díez et al. 2022b).
The effect of this parameter is so since shorter logs pack tighter (Forest Service of Newfoundland and Labrador 2016; Saskatchewan Ministry of Environment 2021). Thus, the influence of this parameter is due to the crookedness, taper, or protruding branch stubs, which results in larger voids in the stacks as the length of the logs increases; this is so since the impact of the parameters mentioned above is more significant when the log increases (Zon 1903; Pita Carpenter 1984; Sairanen 1987; Diéguez Aranda et al. 2003; De Miguel-Díez et al. 2022b). However, it is worth noting that the decreasing rate of the conversion factors as log lengths increase was not identical to the variation rates outlined in the found references (De Miguel-Díez et al. 2022b).
4.1.3 Preparation of the logs, delimbing quality or proportion of logs with protruding branch stubs
The preparation of the logs, which is better as the proportion of logs with protruding branch stubs is related to the way in which the logs are prepared, i.e., delimbed and crosscut: manually or mechanically. The influence of this parameter can become stronger when the preparation of the logs is poor. Previous studies reported that the conversion factors are higher when the preparation of the logs or delimbing quality is higher (Zon 1903; Williams 1968; Kärkkäinen 1978; Pita Carpenter 1984; Briggs 1994; Diéguez Aranda et al. 2003; Bäucker et al. 2014b; De Miguel-Díez et al. 2022b). This relationship is also supported by various roundwood measurement guidelines and several handbooks (Hamilton 1975; Purser 1999; Batista and Zarate do Couto 2002; Environment and Sustainable Resource Development - Government of Alberta 2006; Lindblad 2011; New Brunswick Forest management branch natural resources 2012; Forest Service of Newfoundland and Labrador 2016; Biometria 2020; Saskatchewan Ministry of Environment 2021). The Swedish guidelines consider the influence of this factor in combination with the effect of buttresses to lead to a reduction of the conversion factors for a very poor preparation of up to 8 pp compared to individual short delimbing stubs on a few logs, negligible knot bulges and individual buttresses (Biometria 2020). Furthermore, the Swedish guidelines indicate that deduction is doubled when stacking logs with a mean diameter lower than 7 cm, while the deduction is cancelled out for diameters of 8–9 cm (Biometria 2020). The Finnish guidelines report variation in the conversion factors of 6 pp for conifers and of 3 pp for hardwood species (Luonnonvarakeskus 2017). Nikkilä et al. (1974) determined a variation in the net volume in coniferous piles from logs with a high delimbing quality to logs with a low delimbing quality. Thus, a variation of a delimbing quality class modified the stack net volume by slightly over 1%. In contrast, no corresponding correlation was proven for stacks constituted with hardwood logs. The analysis of this influencing parameter by using a 3D simulation model reported a variation of 7.9 % for Norway Spruce (Picea abies) stacked logs (De Miguel-Díez et al. 2022b). A further study conducted in the United States of America reported a variation in the solid wood contents of 33.3% for Longleaf pine (Pinus palustris) and 35.7% for Loblolly pine (Pinus taeda) between stacks made up of straight smooth logs and crooked logs with tops and branches (Williams 1968).
Thus, when the preparation of the logs is not good, the proportion of logs with protruding branch stubs is higher, increasing the frequency and size of the voids caused by the protruding branch stubs between the stacked logs (Baró y Zorrilla 1948; De Miguel-Díez et al. 2022b). Moreover, the limbs, knots and similar irregularities remaining on the surface hinder even stacking and cause unnecessary air spaces (Forest Service of Newfoundland and Labrador 2016; Saskatchewan Ministry of Environment 2021).
4.1.4 Crookedness
The effect of the crookedness on the solid wood content is described in several references (Barret et al. 1941; Keepers 1945; Williams 1968; Nikkilä et al. 1974; Hamilton 1975; Pita Carpenter 1984; Sairanen 1987; Briggs 1994; Batista and Zarate do Couto 2002; Diéguez Aranda et al. 2003; Lindblad 2011; Schulting 2002). The conversion factors decrease as the crookedness of the stacked logs become more prominent (Keepers 1945; Williams 1968; Briggs 1994; Foelkel 2015). Some measurement guidelines also confirm these statements (Hamilton 1975; Biometria 2020). In some of these reports, the impact is quantified or can be deduced from the reported conversion factors or solid wood contents. Notably, the Swedish guidelines show a 7 pp reduction in the conversion factors for crooked logs compared to straight logs (Biometria 2020), while the Finnish guidelines report a 3 pp and 8 pp variation in the conversion factors for conifers and for hardwood species, respectively, between straight and crooked logs. Moreover, the English measurement guideline describes a 2 % reduction in the conversion factors for every 5 % of average curvature. The English measurement guideline describe the crookedness in terms of the displacement of the central axis at the midpoint of the log from the line connecting the center points of the log ends, as a percentage of the log length (Hamilton 1975). A study conducted by Nikkilä et al. (1974) reported that a 1 cm increase in crookedness could lead to more than a 2 pp decrease in the net volume. The highest variation in the solid wood contents (and therefore of the conversion factors) between stacks made up of straight, smooth and crooked, rough and knotty logs was reported in a a study conducted in the United States of America. The variation ranged between 27.3% (Longleaf pine - Pinus palustris) and 31.0% (Loblolly pine - Pinus taeda) for a log diameter of less than 15.24 cm and between 20.5% (Longleaf pine - Pinus palustris) and 20.0% (Loblolly pine - Pinus taeda) for a log diameter greater than 30.48 cm (Williams 1968). The analysis of this parameter based on the results from a 3D simulation model showed a 12.1 % variation in the effect of this parameter for Norway Spruce (Picea abies) (De Miguel-Díez et al. 2022b). The reduction in the conversion factors is because crooked stacked logs usually occupy a bigger place than straight logs (Hamilton 1975; Purser 1999; De Miguel-Díez et al. 2022b). Furthermore, it is worth noting that log crookedness is also related to the provenience regions (Reinhold 1951).
4.1.5 Taper
The impact of this parameter can be found in several references (Hamilton 1975; Batista and Zarate do Couto 2002; Foelkel 2015; De Miguel-Díez et al. 2022b). The English forest mensuration handbook considers its effect as modest if the stack is made up randomly with logs of different diameters and taper (Hamilton 1975). If the taper is expressed as one centimeter reduction in diameter in “x” centimeters of length, the conversion factors can be expected to decrease by 0.6 pp for an average drop of “x” of 10 cm (Hamilton 1975). A study reports that conversion factors tend to decrease as taper increases (De Miguel-Díez et al. 2022b), with cylindrical (non-tapered) logs getting higher conversion factors than tapered logs (Foelkel 2015). A recently conducted study based on numerous simulations demonstrated that the effect of taper causes a 4.8 % variation in the conversion factors (De Miguel-Díez et al. 2022b). This fact has been reported in previous studies and is also described in several roundwood measurement guidelines. This is because taper prevents logs from being properly stacked, inevitably creating voids in the stack (De Miguel-Díez et al. 2022b). Thus, several guidelines highlight the importance of stacking the logs equally in opposite directions, i.e., the same proportion of stacked logs with the butt ends to one side of the stack and vice versa (Purser 1999). Just like crookedness, the taper is also related to the provenience regions (Reinhold 1951).
4.1.6 Ovality
Most research studies have reported the influence of this parameter as marginal (Barret et al. 1941; Heinzmann and Barbu 2017; De Miguel-Díez et al. 2022b). For Norway spruce (Picea abies), some recent studies have estimated an average 1.6 % variation in the conversion factors due to ovality. The analyzed tree species generally were barely oval such as Norway Spruce (P. abies) (De Miguel-Díez et al. 2022b) or Scots pine (Pinus sylvestris) (De Miguel-Díez et al. 2021a). According to the found references, conversion factors increase as the log faces become more circulars (De Miguel-Díez et al. 2022b).
4.1.7 Bark presence
The presence of bark in the logs plays an important role in the conversion factors since stacks made up of debarked logs have higher conversion factors (relating these the gross stack volume over bark to net stack volume under bark) (Eklund 1948; Aro 1958; Makkonen 1958; González et al. 2010; Romahn de la Vega and Ramírez Maldonado 2010; Foelkel 2015). The influence of this fact is described and/or can be deduced from several roundwood measurement guidelines (Hamilton 1975; Batista and Zarate do Couto 2002; Environment and Sustainable Resource Development - Government of Alberta 2006; British Columbia Ministry of Forests, Lands and NRO 2011; Forest Service of Newfoundland and Labrador 2016; Manitoba sustainable development 2019; Ontario Ministry of Natural Resources and Forestry 2020; Saskatchewan Ministry of Environment 2021) and research studies (González et al. 2010; Bäucker et al. 2014b; Foelkel 2015). For instance, one stere made up of thin logs with bark can lose as much as 15% of its gross volume when the logs are debarked (Forest Service of Newfoundland and Labrador 2016). In contrast, the Irish timber measurement guidelines deem this parameter’s influence small relative to other parameters such as crookedness, preparation of the logs, and the stacking quality (Purser 1999). The English forest mensuration handbook states that the impact of bark in the conversion factors is relatively low. However, the impact can be important for those tree species whose stems become irregular when debarked, reducing the conversion factors (Hamilton 1975).
4.1.8 Bark thickness
This parameter exerts an influence on the conversion factors (meaning the conversion factors that relate the gross stack volume over bark to the net stack volume under bark) (Emanuelli et al. 1997; Bertola et al. 2003; Forest Service of Newfoundland and Labrador 2016; Biometria 2020). When the bark thickness is higher, the conversion factors decrease. The Swedish guidelines reported reductions in the conversion factors ranging from 4 pp for extremely thin bark to 12 pp for extremely thick bark (Biometria 2020). This parameter is correlated to the age of the trees or the average of the stand. When the forest stand is older, the bark thickness increases, resulting in lower conversion factors (Forest Service of Newfoundland and Labrador 2016). On the other hand, the bark thickness (and thus the resulting bark share in the stack) is related to the tree species (Galán Larrea et al. 2014). For a stack with the same shape, the bark share is higher for oak logs (Quercus spp.) (15.2%) than for European beech (Fagus sylvatica L.) logs (7%) (Bäucker et al. 2014a,b).
4.1.9 Cracks, splitting, warping, defects
These log defects can occur when cutting the trees, preparing the logs, or during the tree growing. The latter is due to different reasons, including weather conditions, diseases and pests. The effect of these log defects tends to reduce the conversion factors since they create voids between the stacked logs (Pita Carpenter 1984; Diéguez Aranda et al. 2003; Foelkel 2015). Quantifications of the variation between the conversion factors or the solid wood content were not found in the references analyzed.
4.2 Stack parameters
4.2.1 Stacking quality
The influence of this parameter plays a key role in the conversion factors according to previous research studies (Emanuelli et al. 1997; Foelkel 2015; De Miguel-Díez et al. 2022b). In addition, this finding is confirmed in several roundwood measurement guidelines and handbooks (Hamilton 1975; Schulting 2002; Lindblad 2011; Biometria 2020). It can be deduced from previous scientific articles and measurement guidelines confirm that the conversion factors are higher, since, with improved stacking quality, the stacks become more compact (i.e., low number of crossed or irregularly stacked logs) (Hamilton 1975; Purser 1999; Foelkel 2015; Biometria 2020; De Miguel-Díez et al. 2022b). The Swedish guidelines report a reduction of up to 9 pp in the conversion factors for extremely sparsely stacked logs compared to dense, well-stacked logs (Biometria 2020). Due to the effect of the stacking quality, the Finnish guidelines show a variation in the conversion factors of 6 pp for conifers and 4 pp for hardwood species (Luonnonvarakeskus 2017). The Irish timber measurement guidelines highlight the operators’ skills’ impact and deem its impact on stacking quality as considerable (Purser 1999). In this sense, a skilled operator will build stacks with higher conversion factors than an inexperienced operator (Purser 1999; Romahn de la Vega and Ramírez Maldonado 2010). This fact was demonstrated in a research study that analyzed different scenarios involving well-skilled and inexperienced operators. The results showed that the effect of this parameter could cause a variation of 12.8% in the conversion factors (De Miguel-Díez et al. 2022b). In addition, a wide range of conversion factors was obtained for a poor quality stacks. This wide range was caused by the fluctuation in the stack volume associated with stacking performed by inexperienced operators (De Miguel-Díez et al. 2022b). Furthermore, the stacking quality is closely related to the stacking method: mechanically or manually, the conversion factors are higher when the stacking operations are carried out manually since this is done more carefully (De Miguel-Díez et al. 2022b). Furthermore, it must be noted that operators can artificially and fraudulently increase the stack volume and thus decrease the conversion factors and the solid wood contents (Dos Santos Lisboa et al. 2009; Keepers 1945).
4.2.2 Stacking method
The influence of the stacking method (or construction of stack) on the conversion factors is outlined in several roundwood measurement guidelines (Hamilton 1975; Batista and Zarate do Couto 2002; Schulting 2002; New Brunswick Forest management branch natural resources 2012; Forest Service of Newfoundland and Labrador 2016; Saskatchewan Ministry of Environment 2021), research studies (Nikkilä et al. 1974; Bertola et al. 2003; Dos Santos Lisboa et al. 2009; Romahn de la Vega and Ramírez Maldonado 2010; Câmpu 2012; Galán Larrea et al. 2014; Foelkel 2015) as well as other documents (Wabo 2002). As the logs are stacked in a “hexagonal” manner (or in octagonal stacking (Hamilton 1975)), these occupy less air space, resulting in more solid wood content than the logs stacked at an angle or in a “square” manner (Forest Service of Newfoundland and Labrador 2016; Saskatchewan Ministry of Environment 2021) or square stacking (Hamilton 1975). Compared to hexagonal piling, square piling may reduce the solid wood content by as much as 10%, i.e., the conversion factors can become up to 10% lower (Forest Service of Newfoundland and Labrador 2016). Previous research studies mathematically demonstrated the influence of two stacking methods on the conversion factors and could determine a maximal value for them as per stacking method: for square or perpendicular stacking, 0.786 (or 0.785 or 0.78) and for inclined stacking, 0.906 (or 0.907 or 0.91) (Schmidt 1940; Stach 1949; Hamilton 1975; Diéguez Aranda et al. 2003). This mathematical approach was also used in Spain to define conversion factors depending on the stacking method (Baró y Zorrilla 1948).
Furthermore, higher conversion factors are generally obtained when the logs are stacked manually than when they are stacked mechanically (Michalec and Wąsik 2020; Saskatchewan Ministry of Environment 2021). Nikkilä et al. (1974) classified the stacking method into three different categories: manually stacked logs, mechanically well stacked logs and mechanically poor-stacked logs. Only small variations were ascertained between the first two classes, and they depended on tree species. In contrast, mechanically poor stacks were the sparsest for all tree species. Specifically, the average relative net volume of all mechanically formed stacks was 0.6% lower than that of the manually formed stacks for pine (Pinus sylvestris), with values of 2.4% for Norway spruce (Picea abies) and 0.1 % for hardwood species. This small variation was partly due to the larger size of the roundwood in the mechanically than manually formed stacks, particularly for the tree species pine (Pinus sylvestris) and hardwood. Moreover, according to a report by Nikkilä (1972), self-cited later (Nikkilä et al. 1974), the relative solid wood content and therefore, the conversion factors of mechanically formed stacks were higher when these had foundations than when not.
A previous study showed a significant difference in conversion factors (an average of approximately 8%) when comparing mechanical and manual stacking in the mill yard. Furthermore, this study showed that using an average conversion factor is incorrect because it can lead to errors when estimating the volumes since it disregards the stacking method (Dos Santos Lisboa et al. 2009). According to the found references, manually made-up stacks have higher conversion factors than those mechanically built (Dos Santos Lisboa et al. 2009; Foelkel 2015).
4.2.3 Re-stacking
When repetitively stacking the same logs, the relative net volume and the conversion factor tend to increase. According to the analysis conducted by Nikkilä et al. (1974), that increase compared to the original stack net volume was up to 1.4 % for manually formed stacks and between 2.9% to 6.2% for mechanically formed stacks. This can be due to the bark is lost when logs are repetitively stacked (De Miguel-Díez et al. 2022a). In contrast, Dos Santos Lisboa et al. (2009) stated that the number of times the roundwood is handled or moved also plays a certain role. The more tumbles made in a load of wood, the greater the tendency to decrease conversion factors.
4.2.4 Percentage of butt logs in the stack
The influence of this parameter has been analyzed recently by a few studies. The results have shown that its effect on the conversion factors is modest (De Miguel-Díez et al. 2021a, 2022b). Previous research studies showed that the true proportion of butts presented a quite strong negative correlation with net volume for hardwood species and Norway spruce (Picea abies) stacks. That correlation could not be proven for stacks of pine (Pinus sylvestris) logs (Nikkilä et al. 1974). The conversion factors are higher as the percentage of butt logs in the stack decreases, with variations in the conversion factors of up to 6.5% (De Miguel-Díez et al. 2022b). The influence of this parameter is also reported in some measurement guidelines. However, its influence has been quantified together with the delimbing quality (Biometria 2020). The butt logs create voids in the stack as the butt swells occupy a bigger size than the other logs and thus hinder well-aligned and even stacking (De Miguel-Díez et al. 2022b). Therefore, the need to stack the logs in well-balanced proportions in opposite directions has been recommended in several sources (Purser 1999; De Miguel-Díez et al. 2022b).
4.2.5 Proportion of stacked logs in different directions
A study carried out in Spain emphasized the importance of stacking logs in opposite directions to obtain higher conversion factors (Baró y Zorrilla 1948). This statement was supported by further references such as handbooks, measurement guidelines and research studies written in the following decades (Pita Carpenter 1984; Purser 1999; Diéguez Aranda et al. 2003; De Miguel-Díez et al. 2022b). Furthermore, the results of a study conducted in Germany (De Miguel-Díez et al. 2022b) revealed that the stacking direction barely influenced the conversion factors. However, it could be observed that the resulting conversion factors tended to be higher for a well-balanced proportion of logs stacked in opposite directions.
4.2.6 Stack height
The influence of the stack height on the conversion factors is small.The conversion factors become higher as the stack height increases, since this results in more compact stacks (Foelkel 2015; De Miguel-Díez et al. 2022b). This trend is also supported in different roundwood measurement guidelines.The Swedish guidelines report a 2 pp increase in the conversion factors as the stack exceeds 3 m on 2/3 of the length of the bottom layer and a 1 pp increase as the stack exceeds 2 m on 2/3 of the length of the bottom layer (Biometria 2020). In a recent study, a 4.9% reduction in the conversion factors could be observed with higher stacks. In that study, a strong variation in the stack height was observed along the stack (especially for a stack height of 1 m), which caused that reduction. In contrast, no variation was observed for a stack height of 3 m, since the stack shape with that height was more compact (De Miguel-Díez et al. 2022b).
4.2.7 Proportion of crooked logs in a stack
The effect of this parameter on the conversion factors has been deemed from modest to high depending on the crookedness degree of the logs (De Miguel-Díez et al. 2022b). In a study, the variation in the conversion factors attributed to this parameter, ranged between 3.5% and 12.4% (De Miguel-Díez et al. 2022b). The crookedness influenced the conversion factors. Thus, the resulting conversion factors considerably decreased when the proportion of highly crooked logs in the stack increased. This influence was smaller when the logs were less crooked.
4.2.8 Proportion of tapered logs in a stack
The effect of the proportions of tapered logs in a stack was analyzed in a recent study. Considering the taper degree, the variation in the conversion factors can be small for a low taper degree and modest for a high taper degree, ranging from 1.4% to 6.5% (De Miguel-Díez et al. 2022b). The conversion factors decrease somewhat as the proportion of tapered stacked logs increase (De Miguel-Díez et al. 2022b). The effect of this parameter is also highlighted in the Swedish guidelines. Depending on the volume of logs with very poor stem shape, i.e., large taper and knobbly mantle surface, the conversion factors can decrease by up to 3 pp for a volume proportion of over 71%. In contrast, the conversion factors increase up to 3 pp for a volume proportion of over 71%, when stacking logs with very good stem form, i.e., negligible taper and even and smooth mantle surface (Biometria 2020).
4.3 External parameters
4.3.1 Stacking time in the forest
A study carried out for the rose gum (Eucalyptus grandis W.Hill) in Brazil could demonstrate that the stack dimensions and conversion factors vary when the stack remains in the forests, e.g., at storage sites or roadsides. The effect of this parameter varies according to the season, the length of the logs, and the method used to estimate the conversion factors. The study concluded that by using the estimation method of reason of volumes, the variation of the conversion factors for a length of 2.3 m had a higher variation in winter (9.5%) than in summer (4.2%). The conversion factors of the stacks made up of 1m logs varied more in summer (6.8%) than in winter (5.1%) (Barros et al. 2008). When using the angular method to estimate the conversion factors, the variation in the conversion factors was higher, 17.4% in winter and 10.9% in summer for lengths of 2.3 m and 1 m. The conversion factors became stable after 60 days in summer and 90 days in winter. Rezende and Paula (1991) also indicated a variation in the conversion factors of 8% for 15 days and of 11% for 30 days (Batista and Zarate do Couto 2002). In this period, the conversion factors increased 30 days after logs were stacked, except for the stacks of 1 m logs in winter (Barros et al. 2008). The increase in conversion factors resulting from longer stacking times was also demonstrated in a study (Dos Santos Lisboa et al. 2009). This effect was also analyzed in Finland and denominated as in-pile time (or age of the pile). According to the results obtained by Nikkilä et al. (1974), the effect of this parameter was small. However, the relative net volume increased by over 1% from 2 to 7 months.
4.3.2 Ice and snow
This parameter is considered in the measurement guidelines used in northern European countries. These guidelines report a 2 pp and 12 pp decrease in the conversion factors for small and very large amounts of soft snow, solid snow and ice in the stack to 12 pp respectively (Biometria 2020).
4.3.3 Waste or foreign material in the stacks
Waste or foreign material can contaminate the stacks when harvesting or stacking. Logging waste or objects occupy a space in the stack that is not wood, resulting in lower conversion factors. This parameter is described in some roundwood measurement guidelines (New Brunswick Forest management branch natural resources 2012; Biometria 2020) and research works (Nikkilä et al. 1974; Smith 1979). The Swedish guidelines report a reduction in the conversion factors of up to 4 pp for stacks with quite amount of logging waste (Biometria 2020). Nikkilä et al. (1974) analyzed the effect of foreign material on stacks made up of logs from three different tree species: 1) pine (Pinus sylvestris), 2) spruce (Picea abies) and 3) hardwood. For that purpose, three classes were set: class 1 (no foreign bodies), class 2 (some foreign bodies) and class 3 (numerous foreign bodies). The relative stack net volume of class 2 was lower than that of class 1 for all tree species included. However, no variation could be determined for class 3 due to insufficient data collected.
4.3.4 Moisture content
In 1903, Zon described the effect of the drying process on stacked wood. When drying the sound, freshly cut roundwood, an increase of solid wood in a particular space is caused by shrinking. In this process, the roundwood cracks and some bark is lost. This helps to offset the shrinkage but does not do so completely. In this regard, Zon indicated the difference associated with this parameter when measuring the stacked roundwood. According to Zon´s statement, as deciduous tree species dry more when seasoning and shrink more than conifers. Thus, compared to similar stacks of green (freshly-cut) wood, stacks of dry deciduous and conifer roundwood have a reduction in solid volume between 9% and 14% and between 9% and 10%, respectively (Zon 1903). Later studies confirmed the findings of Zon. According to Foelkel, this parameter may have a variable influence depending on the type of stacked logs (Foelkel 2015). A recent study in Bosnia and Herzegovina (Ljubojević et al. 2011) reflected the considerable role that the moisture content plays in the roundwood volume. The results of this study revealed that the volume of Beech (Fagus spp.) roundwood (fresh, after cutting) was 14% higher than when the wood was dry. In the case of Oak (Quercus spp.), that difference was quantified to be 11%. Therefore, the authors of this study emphasized that the conversion factors must be estimated considering different moisture content. However, other research efforts determined for spruce (Picea abies) lower shrinkage rates. Specifically, Wuoti (1933) estimated a shrinkage in the log volume of 2.8% after being stored for one year (from being prepared in March to March of the following year). The stack height and volume reduction were then quantified respectively at 0.8% and in 2.8% from April to October (Wuoti 1933). Moreover, recently conducted research studies from April to August/September in Sweden also resulted in low shrinkage rates. Nilsson (2011) quantified a 1% reduction in wood volume and 2 – 4 % reduction in bark content for pine (Pinus sylvestris) and spruce (P. abies), while Nylinder and Fryk (2014) observed a reduction in the cross-sectional stack area of 2.0% for pine (P. sylvestris), 2.5% for Spruce (P. abies) and 4.5% for birch (Betula pendula).
Further parameters were also identified in the analyzed references. However, their influence was not yet analyzed, or they cannot be included in the previous three categories since they cannot be assigned to one of them or because several other parameters influence them.
- Tree species. The influence of this parameter was identified and can be deduced from several previous research efforts (Zon 1903; Nikkilä et al. 1974; Damalas and Panagiotidis 1981; Damalas 1982; Foelkel 2015; Michalec and Wąsik 2020). In addition, this parameter is explicitly presented in several roundwood measurement guidelines and handbooks (Batista and Zarate do Couto 2002; Environment and Sustainable Resource Development - Government of Alberta 2006; Lindblad 2011; New Brunswick Forest management branch natural resources 2012; Podkorytov 2015; Forest Service of Newfoundland and Labrador 2016; Acquarone et al. 2021; Saskatchewan Ministry of Environment 2021). According to the references, conifers are usually straighter and smoother than hardwoods. Moreover, their taper is smaller, their clear length is greater, and their bark is smoother. Therefore, conifers yield more solid wood per cubic meter than hardwoods (Zon 1903; Mountain 1949; Williams 1968; Nikkilä et al. 1974; Briggs 1994; Russian state scientific center of the timber industry complex 2013; Podkorytov 2015; Forest Service of Newfoundland and Labrador 2016; Saskatchewan Ministry of Environment 2021). According to Zon’s article (1903), the net volume in a cord of softwoods is, on average, 3% higher than in a cord of hardwoods. In contrast, the Irish timber measurement guidelines indicate that this parameter has only a small influence compared to the crookedness, preparation of the logs, and stacking quality (Purser 1999). Notably, one reference that differed from the general assumption that the conversion factors are higher when conifers logs are stacked could be found. Considering different regions, stacks made up of hardwood logs can contain more wood than conifers logs, e.g., in the Midsouth of the United States in 1950 (Williams 1968).
- Product Type or assortment.The product type plays an equal role to that of the tree species. Higher or lower conversion factors can be obtained depending on the product type or the assortment, e.g., industrial roundwood or roundwood destined to manufacture pallets (New Brunswick Forest management branch natural resources 2012).
- Age of the stand. This parameter influences the conversion factors (Bertola et al. 2003; Foelkel 2015) as the bark thickness is related to the average age of the stand (Forest Service of Newfoundland and Labrador 2016).
In addition to those parameters, the following parameters were merely enumerated in diverse references without providing a further description of their effect: 1) Edaphoclimatic region (Batista and Zarate do Couto 2002), 2) Diameter at breast height (DBH) classes and total height (Batista and Zarate do Couto 2002), 3) Number of products being cut from the tree (New Brunswick Forest management branch natural resources 2012), 4) Type of road and distance driven (Batista and Zarate do Couto 2002), 5) Drying time (Batista and Zarate do Couto 2002), and 6) Location of the preparation of the logs (Williams 1968).
5 Conclusions
The present literature review confirms the existence of a broad spectrum of methods to estimate the conversion factors (and the solid wood content) for industrial roundwood stacks in landings that vary depending on the countries, showing a historical variation since the 18th century. A total of 48 methods were documented in the present literature review. The successful and gradual implementation of new technologies, as they were developed over the last few centuries, could be clearly observed, e.g., from using the xylometer to using the photo-optical methods, software, electronic measuring systems, handheld laser scanning, or 3D simulation models. As stated by several authors, the most reliable conversion factors are those which are specifically estimated for a chosen tree species or wood type (Fonseca 2005). In this regard and considering the mentioned limitations of the xylometric method, the use of 3D simulation models to estimate specific conversion factors for each tree species and assortment is currently considered a powerful tool that can successfully achieve that aim matching all the desired statistical requirements due to its proven accuracy (De Miguel-Díez et al. 2022a,b).
Furthermore, the wide use of photo-optical methods must be noted as well as their constant improvement in accuracy and other aspects. Notably, divergences between real stack volume and measured volumes using photo-optical methods are still evident for some stacks (Cremer and Blasko 2017; Cremer et al. 2021; Berendt et al. 2021b), disqualifying therefore these methods as the resulting conversion factors are unreliable. In addition, it must be pointed out that several methods have become obsolete, e.g., the method developed by Mountain in 1949; or are used only in very specific geographical regions or countries, e.g., the Grid 400 method. In contrast, methods, which have been used for decades in different countries, are still in current use in several countries when estimating conversion factors, e.g., quadrant area in Spain or Ireland. Considering all methods that are used on site, the adjustment of the conversion factors based on visual assessment can be deemed as very complete since multiple influencing parameters are assessed during the estimation.
In this review, a total of 30 influencing parameters were compiled. Out of those 30, the influence of 21 parameters were not only identified but also analyzed and, in some cases, quantified. These 21 parameters were classified in three different categories considering different levels: 1) log parameters, 2) stack parameters and 3) external parameters. The review demonstrated certain divergences between the effect of the identified parameters. On the one hand, regional characteristics can be observed in the identification of the influencing parameters. In other words, several parameters are only considered in some countries due to regional conditions, e.g., the influence of snow and ice in Sweden. On the other hand, the divergences in influence of some parameters on the conversion factors were also notable, e.g., bark presence, tree species or midpoint diameter. Furthermore, it was noted that the influence of some parameters can vary depending on the country or on the tree species (despite occurring in the same analyzed reference). Thus, a direct comparison of the effect of all analyzed influencing parameters to determine the most influential was not possible. Moreover, the effect of several influencing parameters was not quantitively assessed in a considerable number of the found references. However, it was possible to distinguish a range of different effects according to the variation range, considering those references in which the influence was quantified.
According to most of the references, it can be stated that the following parameters have a considerable influence on the conversion factors (and on the solid wood content in the stack): midpoint diameter, length, crookedness, delimbing quality, bark presence, bark thickness, stacking method, stacking quality, time of exposition, moisture, ice and snow in the stack and the proportion of moderately and highly crooked logs in a stack. Taper, proportion of butt logs in a stack, foreign material and waste in the stack and the stack height have a modest effect as do the proportion of tapered and crooked logs for low and high taper and low crookedness. Ovality and the proportion of logs stacked in opposite directions have a marginal influence on the conversion factors.
Based on the findings of this literature review, the stakeholders involved in the roundwood supply chain will be able to understand the methods used to estimate the conversion factors (and the solid wood content) as well as consider the influence that the log and stack parameters have on them when measuring roundwood at national and international level. In addition, the present review provides forest researchers a solid basis for further research, which is needed, in particular, to estimate the influence of those parameters which have not been analyzed so far. Likewise, further research is needed to keep the conversion factors from the analyzed sources updated, considering recent changes in the forestry, e.g., the increasing mechanization of the log preparation processes. Finally, conversion factors should be estimated for each wood assortment and tree species as the analyzed studies reported so that they can provide reliable and accurate estimates of the solid wood contents. For that purpose, the new technologies should be used, e.g., 3D simulation models or handheld laser scanning, since they reduce the required costs and time.
Competing interests
The authors declare that they have no conflict of interest.
Author contributions
Conceptualization, F.d.M.-D., E.T.-E., T.P. and T.C.; investigation, F.d.M.-D.; writing—original draft preparation, F.d.M.-D.; writing—review and editing, F.d.M.-D., T.C., M.A., E.T.-E. and T.P.; visualization, F.d.M.-D., E.T.-E., T.P. and T.C.; supervision, T.C., E.T.-E. and T.P.; project administration, T.C.; funding acquisition, T.C. All authors have read and agreed to the published version of the manuscript.
Funding
This study was undertaken in the framework of the project “HoBeOpt”, which was financially supported via the Fachagentur Nachwachsende Rohstoffe (FNR), Germany, by the Federal Ministry of Food and Agriculture (BMEL) (Grant number: 22008518). The article processing charge was funded by the Baden-Wuerttemberg Ministry of Science, Research and Art and the University of Freiburg in the funding programme Open Access Publishing.
Availability of data and material
The data that support the findings of this study are available from the corresponding author, F.d.M. D., upon reasonable request.
Code availability
Not applicable.
Acknowledgments
The authors appreciate the reviewers’ comments and suggestions. We thank the following researchers and professors for proofreading the terms in their mother tongues and/or providing relevant literature from their countries: Stelian Alexandru Borz (University of Brașov, Romania), Eric Bastos Gorgens (Federal University of the Valleys of Jequitinhonha and Mucuri - UFVJM, Brazil), Eliecer Herrero Llorente (University of Valladolid, Spain), Aleksey Ilintsev (Northern (Arctic) Federal University, Russia), Pieter D. Kofman (Wood Energy Consulting, Denmark), Vasyl Lavny (Ukrainian National Forestry University, Ukraine), Timo Antero Leinonen (South-Eastern Finland University of Applied Sciences, Finland), Piotr Mederski (Poznan university of life sciences, Poland), Tadeusz Moskalik (Warsaw University of Life Sciences – SGGW, Poland), Carlos Emilio del Peso Taranco (University of Valladolid, Spain), Jens Fuglsang Røge (HD LogSystems, Denmark), Oleksandr Soshenskyi (National University of Life and Environmental Sciences of Ukraine, Ukraine), Raffaele Spinelli (Italian National Research Council, Italy) and Arkadiusz Stańczykiewicz (University of Agriculture in Krakow, Poland).
References
Acquarone A, De Souza V, Del Huerto Delgado M, Gatto F, Irisity M, Ponticorbo V, Preste S, Sica A, Sosa J, Techeira N (2021) ¿Cómo mejorar la productividad? Recomendaciones para pequeños aserraderos y carpinterias. [How to improve productivity? Recommendations for small sawmills and carpentry]. Laboratorio Tecnológico del Urugay, LATU, Montevideo, Uruguay.
Ammour T, López A, Scheelje M, Andrade H, Ordóñez Y, Schlönvoigt A, Beer J, Orozco L, Somarriba E, Detlefsen G, Pezo D, Venegas G, Ibrahim M, Quirós D, Zapata P, Kent J, Salgado J (2012) Producción de madera en sistemas agroforestales de Centroamérica. [Wood production in agroforestry systems in Central America]. Centro Agronómico Tropical de Investigación y Enseñanza (CATIE), Turrialba, Costa Rica.
Aro P (1958) Pohjois-Suomen 2 m kuusi- ja mäntypaperipuiden pinotiheydestä, kuorimishäviöstä ja kuutiosuhteista. [On the stacking density, peeling loss and cubic ratios of 2 m spruce and pine paper trees in Northern Finland]. Communicationes Instituti Forestalis Fenniae 50: 1–29. http://urn.fi/URN:NBN:fi-metla-201207171082.
Asikainen A, Lindblad J, Verkasalo E (2009) Chapter 8. Timber measurement. In: Kellomäki S (ed) Forest Resources and Sustainable Management, vol. 2. Paper Engineers´ Association/Paperi ja Puu Oy, Helsinki, Finland. ISBN 978-952-5216-32-5.
Baró y Zorrilla F (1948) Alrededor del estéreo. [Around the stere]. Revista Montes.
Barret LI, Buell JH, Renshaw JF (1941) Some converting factors for mixed oak cordwood in the Southern Appalachians. J For 39: 546–554.
Barros MV, Finger CA, Schneider PR, Santini EJ (2008) Cubication factor of stacked wood of Eucalyptus grandis W. Hill ex Maiden, and its variation with the time of exposition to the environment. Ciencia Florestal 18: 109–119. https://doi.org/10.5902/19805098515.
Batista JL, Zarate do Couto HT (2002) O “Estéreo”. [The „stere“]. METRVM.
Bäucker E, Kehrer-Liebmann J, Bues CT, Günther B (2014a) Festgehalte von Industrieholz-Poltern. [Solid wood content in industrial roundwood stacks]. Forst und Technik 7: 32–35.
Bäucker E, Kehrer-Liebmann J, Günther B, Bues CT (2014b) Unterschiedliche Festgehalte in Poltern verunsichern. [Unsettle the diverse solid wood contents in stacks]. Holz-Zentralblatt 140: 75–77.
Baur FA (1879) Untersuchungen über den Festgehalt und das Gewicht des Schichtholzes und der Rinde. [Study of the solid wood content in the stacks and the weight of the plywood and the bark]. B. Schmisd‘sche Verlagsbuchhandlung, Augsburg, Germany.
Berendt F, Pegel E, Blasko L, Cremer T (2021a) Bark proportion of Scots pine industrial wood. Eur J Wood Wood Prod 79: 749–752. https://doi.org/10.1007/s00107-021-01657-7.
Berendt F, Wolfgramm F, Cremer T (2021b) Reliability of photo-optical measurements of log stack gross volume. Silva Fenn 55, article id 10555. https://doi.org/10.14214/sf.10555.
Bertola A, Boechat Soares CP, Ribeiro JC, Garcia Leite H, Lopes de Sousa A (2003) Determination of piling factors through digitora software. Sociedade de Investigações Florestais 27: 837–844. https://doi.org/10.1590/S0100-67622003000600010.
Biometria (2020) Measurement of roundwood stacks. Swedish Regulations for Timber Measurement, version 2020-10-01. https://www.biometria.se/media/a5xchk3j/measurement-of-roundwood-stacks-2020-10-01.pdf. Accessed 2May 2022.
Borz SA, Proto AR (2022) Application and accuracy of smart technologies for measurements of roundwood: evaluation of time consumption and efficiency. Comput Electron Agr 197, article id106990. https://doi.org/10.1016/j.compag.2022.106990.
Briggs DG (1994) Forest products measurements and conversion factors: with special emphasis on the U.S. Pacific Northwest. Institute of Forest Resources contribution no 75. College of Forest Resources, University of Washington, Washington, United States of America (USA).
British Columbia Ministry of Forests, Lands and NRO (2011) Scaling manual. Chapter 12, Special forest products. http://www.for.gov.bc.ca/hva/manuals/scaling.htm. Accessed 30 Decemeber 2021.
Bundesministerium für Ernährung, Landwirtschaft und Forsten (1983) Umrechnungszahlen für Rohholz. [Conversion factors for roundwood]. Holz-Zentralblatt 109.
Cailliez F (1980) Estimación del volumen forestal y predicción del rendimiento con referencia especial a los trópicos. Vol. 1 - Estimación del volumen. [Forest volume estimation and yield prediction with special reference to the tropics. Vol. 1 - Volume estimation]. FAO, Rome, Italy.
Camera di Commercio Industria Artigianato e Agricoltura di Torino (2009) Raccolta provinciale degli usi. [Provincial collection of uses]. Turin, Italy.
Câmpu VR (2012) Determination of the conversion factor of stacked wood in solid content at spruce pulpwood and firewood with the length of two and three meters. Bulletin of the Transilvania University of Braşov. Series II: Forestry, Wood Industry, Agricultural Food Engineering 5: 31–36. http://rs.unitbv.ro/bu2012/series%20ii/buletin%20ii%20pdf/campu_vr.pdf.
Câmpu VR, Dumitrache R, Borz SA, Timofte AI (2015) The impact of log length on the conversion factor of stacked wood to solid content. Wood Res 60: 503–518.
Cancino J, Emanuelli P, Millá F (1997) Método Red-400: una nueva alternativa para determinar factores de conversion. [Red-400 method: a new alternative to estimate conversion factors]. Agro-Ciencia 13: 225–229.
Carrillo Espinosa G, Flores Ayala E, León Tello JA (1985) Comparación de coeficientes de apilamiento para brazuelo: determinados en función del diámetro de las ramas. [Comparison of conversion factors for brazuelo: determined based on the diameter of the branches]. Boletin Técnico INIF 103: 1–13.
Cogolludo Agustín MÁ (2012) Dendrometría. Tema 4. Parques de madera. Medición de madera apilada. Parte I [Dendrometry. Chapter 4. Mill yards. Measurement of stacked wood. Part I]. Dendrometría. Universidad de Vigo, Vigo, Spain.
Cremer T, Blasko L (2017) Analyse der fotooptischen Vermessung von Kiefernstamm- und -industrieholz im Vergleich zum Sektionsraumaß. [Analysis of the photo-optical measurements for pine industrial roundwood and sawlogs in comparison to the sectional volumetric method outlined in the framework agreement for the raw wood trade in Germany (RVR)]. Allgemeine Forst- und Jagdzeitung 188: 127–139.
Cremer T, Berendt F, Diez Fd, Wolfgramm F, Blasko L (2021) Accuracy of photo-optical measurement of wood piles. Environ Sci Proc 3, article id 90. https://doi.org/10.3390/IECF2020-08192.
Da Crislei Silva M (2003) Determinação do volume de madeira empilhada através de processamento de imagens digitais. [Determination of stacked wood volume through digital image processing]. Master thesis, Universidade Federal de Viçosa, Viçosa, Minas Gerais, Brazil.
Damalas DG (1982) Determination of conversion factors for stacked black pine wood. Dasiki Erevna 3: 137–152. https://agris.fao.org/agris-search/search.do?recordID=GR880006188.
Damalas DG, Panagiotidis N (1981) Determination of conversion factors for stacked oak and chestnut wood into solid volume. Dasiki Erevna 2: 501–515. https://agris.fao.org/agris-search/search.do?recordID=GR880005088.
Danske skoves handelsudvalg (2008) Råtræhæftet. Klassificering, opmåling og afregnings-principper i dansk skovbrug. [Raw wood booklet. Classification, measurement and accounting principles in Danish forestry]. Danske skoves handelsudvalg. https://www.skovforeningen.dk/media/010208%20R%C3%A5tr%C3%A6h%C3%A6ftet.pdf. Accessed 6 Mar 2023.
De Miguel-Díez F, Pettenkofer T, Purfürst T, Tolosana-Esteban E, Cremer T (2021a) Analysis of the Influence of Log Parameters on the Conversion Factors for Wood Stacks Using a Novel 3-D Simulation Model. In: Chung W, Sessions J, Lyons K, Wigginton K (eds) Proceedings of The Joint 43rd Annual Meeting of Council on Forest Engineering (COFE) & the 53rd International Symposium on Forest Mechanization (FORMEC). Forest-Engineering Family-Growing Forward Together. COFE and FORMEC, Corvallis, Oregon, USA, pp 85–86.
De Miguel-Díez F, Reder S, Wallor E, Bahr H, Mund J-P, Cremer T (2021b) Long Range and High-Speed Personal Laser Scanning (PLS) and Simultaneous Localization and Mapping (SLAM) Technology in Roundwood Measurement. In: Hollaus M, Pfeifer N (eds) Proceedings of the SilviLaser Conference 2021. TU Wien, Vienna, Austria, pp 101–103.
De Miguel-Díez F, Tolosana-Esteban E, Cremer T (2021c) 3D-Simulation of wood stacks to analyze the influence of log properties on stack volume. Environ Sci Proc 3, article id 76. https://doi.org/10.3390/IECF2020-08063.
De Miguel-Díez F, Tolosana-Esteban E, Purfürst T, Cremer T (2021d) Analysis of the influence that parameters crookedness and taper have on stack volume by using a 3D-simulation model of wood stacks. Forests 12, article id 238. https://doi.org/10.3390/f12020238.
De Miguel-Díez F, Guigue P, Pettenkofer T, Tolosana-Esteban E, Purfürst T, Cremer T (2022a) Development and evaluation of a novel 3D simulation software for modelling wood stacks. PLOS One 17, article id e0264414. https://doi.org/10.1371/journal.pone.0264414.
De Miguel-Díez F, Pettenkofer T, Wallor E, Tolosana-Esteban E, Purfürst T, Cremer T (2022b) Influence of log and stack parameters on the conversion factors for Norway Spruce wood stacks using a 3D simulation model. Int J For Eng 33: 119–128. https://doi.org/10.1080/14942119.2022.2038023.
De Miguel-Díez F, Reder S, Wallor E, Bahr H, Blasko L, Mund J-P, Cremer T (2022c) Further application of using a personal laser scanner and simultaneous localization and mapping technology to estimate the log’s volume and its comparison with traditional methods. International Int J Appl Earth Obs Geoinf 109, article id 102779. https://doi.org/10.1016/j.jag.2022.102779.
Diéguez Aranda U, Barrio Anta M, Ruíz González AD, Álvarez Taboada MF, Álvarez González JG, Rojo Alboreca A (2003) Dendrometría. [Dendrometry], 1st edn. Ediciones Mundi-Prensa.
Director General of the State Forests (2019) Ordinance no. 51 of the director general of the state forests on the introduction of technical conditions for the timber trading in the state forests national forest holding, appendix No. 9. Technical Conditions-Middle-Size Wood 20199. Director General of the State Forests. http://drewno.zilp.lasy.gov.pl/drewno/Normy/9._drewno_sredniowymiarowe_-_ujednolicono_wg_zarz_54-2020.pdf. Accessed 18 Feb 2023
Dos Santos Lisboa G, Nogueira Dias A, Valerio AF, Silvestre R (2009) Comparação do fator de empilhamento sob diferentes condições para madeira de Eucalyptus grandis. [Comparison of the conversion factor under different conditions for Eucalyptus grandis wood]. Ambiência 5: 81–91.
DRALLE Ltd. sScale. Measure, track and trade. https://www.dralle.dk/_files/ugd/c16416_61392c40fb5945a2b3233678a8cea39a.pdf. Accessed 30 Jan 2022.
Edwards PN (1998) Timber measurement. A field guide. Forestry Commssion Booklet 49. Forestry Commission, Edinburgh, United Kingdom.
Eklund B (1948) Undersökningar över fastmasseprocenter, åtgångstal mm vid mätning av 2-och 3-meters tall-och granmassaved. [Solid volume in stacked pulpwood of pine and spruce (length of sticks 2 and 3 metres) and the volume of solid rough wood (with bark) in relation to stacked volume]. Meddelanden från Statens skogsforskningsinstitut 37: 1–42.
Ellis JC (1993) Measurement of roundwood in New Zealand. N Z J For 37: 16–20. https://doi.org/10.1080/03014223.1993.10423241.
Emanuelli P, Cancino J, Milla F (1997) Tres métodos para la determinación de factores de conversión en madera apilada. [Three methods for estimating conversion factors of stacked roundwood]. Agro-Ciencia 13: 217–223.
Environment and Sustainable Resource Development - Government of Alberta (2006) Alberta timber scaling manual. Sustainable resource development. https://open.alberta.ca/publications/alberta-scaling-manual. Accessed 30 Dec 2021.
Fachverband der Holzindustrie Osterreichs der Wirtschaftskammer Osterreichs (2006) Österreichischen Holzhandelsusancen (ÖHU). Teil C. Rohholz. [Austrian Timber Trade Customs (ÖHU). Part C. Raw wood]. Fachverband der Holzindustrie Osterreichs der Wirtschaftskammer Osterreichs. https://www.wko.at/branchen/industrie/holzindustrie/oesterreichische-holzhandelsusancen-2006-app.html.
FAO, ITTO, United Nations (2020) Forest product conversion factors. FAO, ITTO and United Nations, Rome, Italy.
FCBA Institut Technologique Cubage des bois ronds et assimilés. La norme professionnelle NF B53-020 (2019) au service de vos transactions commerciales. [Scaling of round and similar timber. Professional standard NF B53-020 (2019) at the service of your commercial transactions]. FCBA Institut Technologique.
FEDEMAR. Federation belge des exploitants forestiers et des marchands de bois de mine et de papeterie (2005) Bois de chauffage: relation stère - volume réel de bois. [Firewood: relation stere - actual volume of wood]. https://www.delmottebois.be/stere-m3.pdf. Accessed 4 Apr 2021.
Foelkel C (2015) Eucalyptus Newsletter 48 - Informativo Digital do Eucalipto. Eucalyptus Newsletter 48 - Eucalyptus Digital Newsletter. http://www.eucalyptus.com.br/news/pt_out15.pdf. Accessed 5 Sep 2020.
Fonseca MA (2005) The measurement of roundwood. Methodologies and conversion ratios. CABI Publishing, Oxfordshire, United Kingdom. https://doi.org/10.1079/9780851990798.0000.
Fonseca MA (2010) Forest product conversion factors for the UNECE region. Geneva Timber and Forest Discussion Paper 49.
Forest Service of Newfoundland and Labrador (2016) Timber scaling manual. https://www.gov.nl.ca/ffa/files/forestry-support-pdf-nl-timber-scaling-manual-2016.pdf. Accessed 30 Dec 2021.
Forsman K (2016) Using structure from motion for stockpile inventory in the forest industry. Master thesis, Sveriges lantbruksuniversitet. Swedish University of Agricultural Sciences, Umeå, Sweden.
Frothingham EH (1912) Second growth hardwoods in Connecticut. U.S. Dept. of Agriculture, Forest Service, Washington, D.C., USA.
Galán Larrea R, Pérez Galeana JC, Rivera Nava JL, Valera Venegas G (2014) Volumen y rentabilidad de la leña en un acahual intervenido con roza, tumba y quema en la región costa de Oaxaca. [Volume and profitability of firewood in an acahual treated with slashing, slashing and burning in the coastal region of Oaxaca]. Artículos y Notas. Ciencia y Mar 22: 3–18.
Garland H (1968) Using polaroid camera to measure trucked hardwood pulpwood. Pulp and Paper Magazine 69: 86–87.
Gobierno de Navarra. Servicio de gestión forestal (2016) Pliego de condiciones para la enajenación de nueve lotes de madera de haya en los montes sierra de Urbasa y sierra de Andía, pertenecientes al patrimonio forestal de Navarra (España). [Specifications for the sale of nine lots of beech wood in the forests located in the Sierra de Urbasa and Sierra de Andía, belonging to the forest heritage of Navarra (Spain)]. Gobierno de Navarra. Servio de Gestión forestal. https://hacienda.navarra.es/sicpportal/mtoGeneraDocumento.aspx?DOA=160727094402A2FA78E7&DOL=2. Accessed 4 Apr 2021.
González L, Cabello I, Flores O, Trias AR, Gómez C (2010) Actualización de los factores de conversión de pino caribe (Pinus caribaea var. hondurensis Barret y Golfari), en el oriente de Venezuela. [Updating the conversion factors of Caribbean pine (Pinus caribaea var. hondurensis Barret y Golfari) in eastern Venezuela]. Revista forestal venezolana. 54: 11–20.
Gouvernement du Québec (2021) Regulation respecting the scaling of timber harvested in forests in the domain of the State. Sustainable Forest Development Act (chapter A-18.1, s. 72). http://legisquebec.gouv.qc.ca/en/document/cr/a-18.1,%20r.%205.1. Accessed 3 Jan 2022
Graves HS (1906) Forest mensuration, 1st edn. J. Wiley & Sons, New York, USA.
Gutierrez Rodriguez E, Moreno Orjuela RD, Villota Echeverry N (2013) Guía de cubicación de madera. [Roundwood scaling manual]. https://www.cvc.gov.co/sites/default/files/2020-04/07.%20GUIA%20DE%20CUBICACION%20DE%20MADERA.pdf.
Guvernul României (2020) Norme din 25 iunie 2020 referitoare la proveniența, circulația și comercializarea materialelor lemnoase, la regimul spațiilor de depozitare a materialelor lemnoase și al instalațiilor de prelucrat lemn rotund, precum și cele privind proveniența și circulația materialelor lemnoase destinate consumului propriu al proprietarului și unele măsuri de aplicare a prevederilor Regulamentului (UE) nr. 995/2010 al Parlamentului European și al Consiliului din 20 octombrie 2010 de stabilire a obligațiilor care revin operatorilor care introduc pe piață lemn și produse din lemn. [Rules from June 25, 2020 relating to the provenance, circulation and commercialization of wood materials, to the regime of storage spaces for wood materials and roundwood processing facilities, as well as those regarding the provenance and circulation of wood materials intended for the owner’s own consumption and some measures to apply the provisions of the Regulation (EU) no. 995/2010 of the European Parliament and of the Council of 20 October 2010 establishing the obligations of operators who place wood and wood products on the market].
Hamilton GJ (1975) Forest mensuration handbook. Forestry Commission Booklet 39. HSMO, London, United Kingdom.
HEIDEGESELLSCHAFT, Forstprodukte und – geräte Ltd. LogStackPro - digitale fotooptische Vermessung von Rohholz. https://www.hdlogsystems.de/logstackpro. Accessed 28 Oct 2021.
Heinzmann B (2017) Determination of the stack volume of spruce industrial timber using individual and electronically 3D – measurement. Doctoral thesis, University of Sopron, Sopron, Hungary.
Heinzmann B, Barbu MC (2017) Effect of mid-diameter and log-parameters on the conversion factor of cubic measure to solid measure concerning industrial timber. Pro Ligno 13: 39–44.
Heiskanen V (1973) Pinotiheysluvun ja pinotiheystekijäin arviointi ja sen tarkkuus. [Evaluation of the solid content and the solid content factors and its accuracy]. Folia For 170: 1–24. http://urn.fi/URN:ISBN:951-40-0055-2.
Heiskanen V, Salmi J (1975) Kuitupuupinon kiintotilavuuden määritystä koskevia tutkimuksia: Mutkainen lehtikuitupuu, järeä kuitupuu sekä likipituinen havukuitupuu. [Studies on the determination of the solid volume of a pulpwood pile. Crooked broadleaved pulpwood, large-sized pulpwood and coniferous pulpwood of approximate length]. Folia For 236: 1–29. http://urn.fi/URN:ISBN:951-40-0170-2.
Huffel G (1919) Economie forestière. [Forest economy], 2nd edn. LaMaison Rustique, Paris, France
Instituto Nacional de Bosques - INAB- (2004) Guía practica para la cubicación de madera. [Roundwood scaling manual]. Instituto Nacional de Bosques - INAB-, Guatemala de la Asunción, Guatemala.
Jänes J (2001) Calculation of roundwood volume through its density. Baltic Forestry 7: 57–62.
Jodłowski K, Witkowska J (2019) Determination of conversion factors for pine and spruce logs in stacks. Forest Research Papers 80: 181–187. https://depot.ceon.pl/handle/123456789/18757.
Junta de Comunidades de Castilla-La Mancha, Consejeria de Agricultura, Dirección General de Montes y Espacios Naturales (eds) (2013) Manual de buenas prácticas en aprovechamientos forestales en Castilla-La Mancha (España). Serie forestal n° 11. [Manual of good practices in forest exploitation in Castilla-La Mancha (Spain). Forest series no. 11]. Consejeria de Agricultura de Castilla-La Mancha, Toledo, Spain.
Kallio E, Lothner DC, Marden RM (1973) A test of a photographic method for determining cubic-foot volume of pulpwood. Research note NC-155. North Central Forest Experiment Station, Forest Service - U.S. Department of Agriculture. https://www.fs.usda.gov/research/treesearch/11332.
Kärhä K, Nurmela S, Karvonen H, Kivinen V-P, Melkas T, Nieminen M (2019) Estimating the accuracy and time consumption of a mobile machine vision application in measuring timber stacks. Comput Electron Agric 158: 167–182. https://doi.org/10.1016/j.compag.2019.01.040.
Kärkkäinen M (1978) Kuorinnan vaikutus pinon tiiviyteen. [The effect of barking on the pile density]. Silva Fenn 12: 222–230. https://doi.org/10.14214/sf.a14859.
Keepers CH (1945) A new method of measuring the actual volume of wood in stacks. J For 43: 16–22.
Keskkonnaministri (2006) Märuse nr 64 «Puidu mõõtmise ja mahu määramise meetodid, mõõtmistäpsusele ning mõõtmistulemuste dokumenteerimisele esitatavad nõuded. Lisa 1 Virna mõõtmise meetod. [Regulation No. 64 “Methods for Measuring and Determination of Wood, Measuring Precision and Documentation of Measurement Results. Appendix 1 Stack measurement method].
Knyaz VA, Maksimov AA (2014) Photogrammetric technique for timber stack volume contol. Int Arch Photogramm Remote Sens Spatial Inf Sci XL-3: 157–162. https://doi.org/10.5194/isprsarchives-XL-3-157-2014.
Kruglov A, Shishko E (2017) Log pile measurement through 3D modeling. In: Herencsar N (ed) Proceedings of the 40th International Conference on Telecommunications and Signal Processing (TSP). IEEE, Brno, Czech Republic, pp 263–266.
Ladusāns A, Buļs J (2010) Krautnes tilpīguma koeficienta novērtējums procentos. VMF PR P 7.3.01.02. [Evaluation of the storage conversion factor in percent]. VMF Latvia. https://www.vmf.lv/site/upload/PR%20P%207.3.01.02%20Krautnes%20tilpiguma%20koef%20novertejums_procentos.pdf. Accessed 3 Mar 2023.
Landesbetrieb für Forst- und Domänenverwaltung, proLignum, Handels-, Industrie-, Handwerks-, und Landwirtschaftskammer Bozen (2006) Rundholzsortierung in Südtirol. [Roundwood classification in South Tyrol]. Landesbetrieb für Forst- und Domänenverwaltung; proLignum; Handels-, Industrie-, Handwerks-, und Landwirtschaftskammer Bozen, Bolzano, Italy.
Latvijas valsts meži (2022) Apaļo kokmateriālu uzmērīšanas noteikumi. UN 2022.01. [Measurements of round timber. Regulations, UN 2022.01].
Lehtimäki J (2001) Lyhyen kuitupuun kehä-ja pinomittauksen tarkkuus. [Accuracy of measuring short pulpwood in stacks at logging sites and piles at roadisde landings]. Master thesis, Häme Polytechnic, Hämeenlinna, Finland.
Lietuvos Respublikos Aplinkos Ministro (2002) Įsakymas dėl apvaliosios medienos bei nenukirsto miško matavimo ir tūrio nustatymo. [Lithuanian rules for measurement of round timber, standing trees and volume estimation]. Lietuvos Respublikos Aplinkos Ministro.
Lietuvos Respublikos Aplinkos Ministro (2010) Apvaliosios medienos bei nenukirsto miško matavimo ir tūrio nustatymo taisyklės (įsakymu Nr. D1-747). [The rules for measuring and determining the volume of round wood and uncut forest (modification order D1-747)].
Lindblad J (2011) Chapter 9: Timber measurement. In: Rantala S, Pekkinen E, Tammiruusu S (eds) Finnish forestry practice and management. Metsäkustannus, Helsinki, Finland, pp 161–172.
Ljubojević S, Marčeta D, Kremenović S (2011) Conversion coefficients for distilling wood in running standards and everyday practice. South-East Eur For 2: 51–57. https://doi.org/10.15177/seefor.11-06.
Luonnonvarakeskus (2017) Luonnonvarakeskuksen määräys puutavaran mittaukseen liittyvistä yleisistä muuntoluvuista: ajantasainen määräys (22.12.2017). Määräys 2/2013, Liite 3 [Natural Resources Institute Finland’s regulation on general conversion factors related to the measurement of timber: current regulation (December 22, 2017). Order 2/2013, Appendix 3]. https://puuhuolto.fi/mittaus-ja-laatu/wp-content/uploads/sites/9/2018/05/Luonnonvarakeskuksen_maarays_puutavaran_mittaukseen_liittyvista_muuntoluvuista_FI_22122017.pdf. Accessed 31 May 2022.
Maa- ja metsätalousministeriö (1997) Pinomittaus (Dnro 2409/66/97 16.6.1997 Maa- ja metsätalousministeriö, Ohje 9.6.1997). [Stack measurement (Dnro 2409/66/97 16.6.1997 Ministry of Agriculture and Forestry Directive 9.6.1997)]. Finnish Ministry of Agriculture and Forestry. https://puuhuolto.fi/mittaus-ja-laatu/wp-content/uploads/sites/9/2017/04/pinomittaus_mmm_paatos_16061997_fi.pdf. Accessed 4 Apr 2021.
Makkonen O (1958) Pinotiheystutkimuksia. [Pile density studies]. Metsäteho, Publication no. 39.
Makkonen O (1960) Kuorimattomien 2.4-metristen koivupaperipuiden ja 2-metristen koivupolttorankojen pinotiheysmittauksia. [Measurements of the stacking density of unbarked 2.4-m. Birch pulpwood and 2-m. Birch fuelwood]. Metsäteho, Report 173.
Manitoba sustainable development (2019) Manual of scaling instructions. https://www.gov.mb.ca/sd/pubs/forest_lands/scaling_manual.pdf. Accessed 4 Apr 2021.
Meyen S, O´Connel K (2012) Stacked timber measurement. https://www.forestry.ie/images/MiscDocs/2012YearbookArticles/StackedTimberMeasurement2012.pdf. Accessed 30 Dec 2021.
Meza-Montoya A, Simón D (2005) Medición del volumen de las trozas: primer paso de la comercialización. [Measurement of the log volume: the first step in the commercialization]. Revista Forestal Mesoamericana Kurú 2: 1–6. https://revistas.tec.ac.cr/index.php/kuru/article/view/548.
Michalec K, Wąsik R (2020) Analiza dokładności ułożenia stosów drewna średniowymiarowego. [Analysis of stacking accuracy for medium-size wood stacks]. In: Klamerus-Iwan A (ed) Nowoczesne Technologie i Inżynieria w Zróżnicowanym Użytkowaniu Lasu. [Modern Technologies and Engineering in Differentiated Forest Use]. Uniwersytetu Rolniczego w Krakowie/University of Agriculture in Krakow, Kraków, Poland, pp 41–51.
Miesner T (2021) Influence of model parameters to a 3D roundwood pile simulation. Master thesis, Hochschule für nachhaltige Entwicklung Eberswalde, Eberswalde, Germany.
Ministerio de Desarrollo Agrario y de Riego. Servicio Nacional Forestal y de Fauna (SERFOR) (2021) Protocolo de Control Forestal Maderable en el Transporte Terrestre. [Timber Forest Control Protocol in Land Transport]. https://cdn.www.gob.pe/uploads/document/file/1707349/Protocolo_de_Control_Forestal_Maderable_en_el_Transporte_Terrestre_rev_EMFFF.pdf. Accessed 12 Feb 2022.
Ministerio del Ambiente de Ecuador (2001) Acuerdo Ministerial # 053, Instructivo de Cubicación de maderas para controles forestales en vías Terrestres. [Ministerial Agreement # 053, timber scaling instructions for forestry controls on roads]. http://ecuadorforestal.org/wp-content/uploads/2010/05/Instructivo-Cubicaci%C3%B3n-de-Madera.pdf. Accessed 7 Apr 2021.
Ministério do Meio Ambiente (2012) Guia para medição de produtos e subprodutos florestais madereiros das concessões florestais. [Guide for measuring forest products and subproducts of forest concessions]. Ministério do Meio Ambiente, Brasília, Brazil.
Moskalik T, Tymendorf Ł, van der Saar J, Trzciński G (2022) Methods of wood volume determining and its implications for forest transport. Sensors 22, article id 6028. https://doi.org/10.3390/s22166028.
Mountain HS (1949) Determining the solid wood volume of four-foot pulpwood stacks. J For 47: 627–631.
New Brunswick Forest management branch natural resources (2012) New Brunswick scaling manual. https://www2.gnb.ca/content/gnb/en/services/services_renderer.1215.Scalers_Licence.html. Accessed 30 Dec 2021
Nikkilä H (1972) 2-m ja 2.2. m koivupaperipuun pinotiheys Tehdaspuu oy:n hankinta-alueella 1971. [2-m and 2.2. m stacking density of birch paperwood in the procurement area of Tehdaspuu oy in 1971]. Finnish Forest Research Institute (Metla).
Nikkilä H, Rikkonen P, Heiskanen V (1974) Suomalaisen kuitupuun pinotiheys ja siihen vaikuttavat tekijät. [The relative solid content of Finnish pulpwood and the factors affecting it]. Communicationes Instituti Forestalis Fenniae 82: 1–91. http://urn.fi/URN:NBN:fi-metla-201207171115.
Nilsson A (2011) Krymper barrmassaved vid lagring? - En fallstudie i SCA:s Tövasystem. [Does pulpwood shrink during storage? - A case study in the SCA Tövasystem]. Master thesis, Sveriges lantbruksuniversitet. Swedish University of Agricultural Sciences, Umeå, Sweden. http://urn.kb.se/resolve?urn=urn:nbn:se:slu:epsilon-s-911.
Norsk Virkesmåling (2015a) B2 Målereglement massevirke. [B2 Measuring regulations for pulpwood]. https://www.m3n.no/wp-content/uploads/2017/09/B2_Maalereglement_massevirke.pdf. Accessed 6 Jan 2022.
Norsk Virkesmåling (2015b) Målereglement for skogsvirke. A - Generelle bestemmelser. [Measurement regulations for forest timber. A - General provisions]. https://www.m3n.no/wp-content/uploads/2017/09/A_Maalereglement_generelle_bestemelser.pdf. Accessed 6 Jan 2022.
Nova Scotia Natural Resources (2007) Nova Scotia scaling manual. https://novascotia.ca/natr/forestry/scaling/pdf/ScalingManual.pdf. Accessed 4 Apr 2021.
Nylinder M, Fryk H (2014) Förändring av volym och vedvolymandel vid torkning av massaved. [Change in volume and wood volume proportion when drying pulpwood]. Department of Forest Products, Swedish University of Agriculture. https://res.slu.se/id/publ/119547.
Ontario Ministry of Natural Resources and Forestry (2020) Scaling manual. Queen’s Printer, Toronto, Canada.
Opferkuch M, Attinger M, Jaeger D (2017) Accuracy, efficiency and usability of photo-optical pile measurements systems in the wood supply chain. In: Kanzian C (ed) Innovating the competitive edge From research to impact in the forest value chain. Symposium on Forest Mechanization. Abstracts and Proceedings of the 50th Formec Symposium 2017, Brașov, Romania, p 212.
Palo M (1969) Regression models for estimating the solid wood content of roundwood lots. Folia For 66:1–12. http://urn.fi/URN:NBN:fi-metla-201207191723.
Pardé J, Bouchon J (1988) Dendrométrie. [Forest mensuration], 2nd edn. École nationale du génie rural, des eaux et des forêts, Nancy, France.
Peters Nario R, Jobet Jarpa M, Aguirre S (1985) Manual n° 14. Compendio de tablas auxiliares para el manejo de plantaciones de pino insigne. [Manual n° 14. Compendium of auxiliary tables for the management of insigne pine plantations], 1st edn. INFOR. Instituto forestal filial de la corporación de fomento de la producción, Santiago de Chile, Chile.
Pita Carpenter PA (1984) Apuntes de dasometría. [Notes of dendrometry]. Universidad Politénica de Madrid. Technical University of Madrid, Madrid, Spain.
Podkorytov V (2015) Посібник із вимірювання та оцінки якості деревини в круглому вигляді. [The round wood grading and quality assessment manual]. https://www.enpi-fleg.org/site/assets/files/2111/manual_podkorytov_measuring_and_quality_assessment_round_wood.pdf. Accessed 3 Jan 2022.
Prodan M, Peters R, Cox F, Real P (1997) Mensura forestal. [Forest mensuration]. Instituto Interamericano de Cooperación para la Agricultura (IICA) and Deutsche Geselschaft für Technische Zusammenarbeit (GTZ) GmbH, San José, Costa Rica.
Purfürst T, De Miguel-Díez F, Berendt F, Engler B, Cremer T (2022) Comparison of wood stack volume determination between different manual, PhotoOptical, iPad-LiDAR and handheld-LiDAR based measurement methods. In: Chung W, Kanzian C, McNeary P (eds) Proceedings of The Joint 44th Annual Meeting of Council on Forest Engineering (COFE), the 54th International Symposium on Forest Mechanization (FORMEC), and 2022 IUFRO All-Division 3 Meeting. One Big Family – Shaping Our Future Together. COFE and FORMEC, Corvallis, Oregon, USA, p 14.
Purser P (1999) Timber measurement manual. Standard procedures fort he measurement of round timber for sale pruposes in Ireland. Council for Forest Research and Development (COFORD), Dublin, Ireland.
Reinhold M (1951) Die Inhaltszahlen von Schichtnutzholz. [Conversion factors for industrial wood]. Forstwissenschaftliches Centralblatt 70: 566–577. https://doi.org/10.1007/BF01821489.
Rezende AV (1988) Análise dos métodos de estimação do volume sólido da madeira e do comportamento do fator de empilhamento para Eucalyptus grandis. [Analysis of solid wood content estimation methods and the variation of the conversion factors for Eucalyptus grandis]. M.Sc. Thesis, Universidade Federal de Viçosa, Viçosa, Minas Gerais, Brazil.
Riigimetsa Majandamise Keskuse (RMK) (2021) RMK virnmaterjalide standard. [RMK Standard Materials Standard]. Riigimetsa Majandamise Keskuse (RMK). State Forest Management Center. https://media.rmk.ee/files/RMK%20virnmaterjalide%20standard%202021-03-16.pdf. Accessed 28 Feb 2023.
Romahn de la Vega CF, Ramírez Maldonado H (2010) Dendrometría. [Forest mensuration]. Universidad autónoma Chapingo, Texcoco, Mexico.
Rondeux J (1999) La mesure des arbres et des peuplements forestiers. [Measurement of trees and forest stands], 2nd edn. Les presses agronomiques de Gembloux, Gembloux, Belgium.
Russian state scientific center of the timber industry complex (2013) ГОСТ 32594-2013 Лесоматериалы круглые. Методы измерений. [GOST 32594-2013 Interstate standard. Round timber. Methods of measurements], Moscow, Russia.
RVR Rahmenvereinbarung für den Rohholzhandel in Deutschland (RVR). [Framework agreement for the raw wood trade in Germany (RVR)]. Fachagentur für Nachwachsende Rohstoffe e.V. (FNR), Gülzow-Prüzen, Germany. https://www.rvr-deutschland.de/struktur.php?id=47.
Sairanen P (1987) Pitkän kuitupuun pinomittaustutkimus. [Pile measurement study of long fiber wood]. In: Metsäntutkimuspäivä Kokkolassa: metsäteknologian tutkimuspäivä. [Forest research day in Kokkola: forest technology research day]. The Finnish Forest Research Institute Research Papers 250: 86–113. http://urn.fi/URN:ISBN:951-40-0860-X.
Sairanen P (1995) Pitkän kuitupuun pinomittaus tienvarsivarastoissa. [Measurement of long pulpwood at roadside landings]. In: Verkasalo E (ed) Puutavaran mittauksen kehittämistutkimuksia 1989–1993. [Timber measurement development studies 1989–1993]. The Finnish Forest Research Institute Research Papers 558: 24–53. http://urn.fi/URN:ISBN:951-40-1434-0.
Saskatchewan Ministry of Environment (2021) Scaling standard. https://pubsaskdev.blob.core.windows.net/pubsask-prod/110419/Scaling%252BStandard.pdf. Accessed 30 Dec 2021.
Scheller Technology GmbH AFoRS – Automatisierter Fotogrammetrischer Rohholz-Vermessungs-Service. https://www.afors.de/afors-de.html#start. Accessed June 16th 2022.
Schmidt E (1940) Unkosten des Holzschälens und Manipulierens in Abhängigkeit vom Durchmesser des Papierholzes. [Expenses of wood peeling and manipulation depending on the diameter of the pulpwood]. Holz als Roh- und Werkstoff 3: 228–231. https://doi.org/10.1007/BF02717990.
Schnur GL (1932) Converting factors for some stacked cords. J For 30: 814–820.
Schulting R (2002) Richtlijnen voor het meten van inlands rondhout ten behoeve van de verkoop. [Guidelines for measuring native roundwood for sale]. https://www.avih.nl/files/4213/5911/9370/richtlijnen_meten_rondhout.pdf. Accessed 30 Dec 2021.
SDP Digitale Produkte GmbH iFOVEA Pro. http://forst-informatik.com/src/anleitungen/Komplette_Anleitung_iFOVEA_de.pdf. Accessed 4 Feb 2022.
Shegelman IR, Polezhaev KV, Vasiliev AS (2012) Коэффициент полнодревесности круглых лесоматериалов в условиях северной карелии. [Coefficient of full wood round timber in the conditions of northern Karelia]. Глобальный научный потенциал. Global Scientific Potential 9: 31–33.
Silva Silva WN (2019) Estimación del volumen de madera apilada utilizando el software Neurodic en Granja Porcón - Cajamarca. [Estimation of the volume of stacked roundwood using the Neurodic software at Granja Porcón - Cajamarca]. Bachelor thesis, Universidad Nacional de Cajamarca.
Slangen LH, van Boven B (1981) De waarde van en de waardeveranderingen in de staande houtvoorraad. [The value of growing stock in the administration of forest enterprises]. Nederlands Bosbouw Tijdschrift 53: 126–133.
Smith VG (1979) Estimating the solid wood content of stacked logs with minimum total cost. Can J For Res 9: 292–294. https://doi.org/10.1139/x79-049.
Stach W (1949) Die Schichtholzvermessung. Eine kritische Untersuchung der Umrechnungsfaktoren. [The industrial roundwood measurement. A critical analysis of the conversion factors]. Schweizerische Zeitschrift für Forstwesen 5: 209–229.
Taras MA (1956) Buying pulpwood by weight as compared with volume measure. USDA Forest Service, Southeastern Forest Experiment Station, Old Station Paper, OSP-074.
Tebėra A (2019) Apvaliosios medienos gaminiai jų ruoša ir matavimas. [Round wood products, their preparation and measurement]. Kauno miškų ir aplinkos inžinerijos kolegija. Kaunas College of Forestry and Environmental Engineering. https://www.kmaik.lt/uploads/pdf/Paskaita%20Medienos%20matavimas%20trumpiau.pdf. Accessed 27 Feb 2023.
TIMBETER Ltd. TIMBETER. https://timbeter.com/. Accessed 4 Feb 2022.
Trestima Ltd. TRESTIMA. https://www.trestima.com/w/en/. Accessed 18 Feb 2023.
United States Department of Agriculture. Forest Service (2006) National forest log scaling handbook, FSH 2409.11. https://www.fs.usda.gov/im/directives/fsh/2409.11/2409.11-NF%20LOGSCALING%20HDBK.pdf. Accessed 12 Jan 2022.
Vera Solis RY (2010) Determinación del factor de conversión para volumen de madera pulpable de Pinus radiata D. Don. [Estimation of the conversion factor for Pinus radiata D. Don pulpwood volume]. Master thesis, Universidad Austral de Chile, Valdivia, Chile.
Vidaurre Echeverría SF, Melo R, Pavón Hinrichsen M (1987) Manual n° 15. Tablas de conversión mecánica y elaboración. [Manual nr 15. Tables of mechanical conversion and elaboration]. INFOR, Instituto forestal filial de la corporación de fomento de la producción, Santiago de Chile, Chile.
von Seckendorff-Gudent A (1878) Untersuchungen über den Festgehalt der Raummasse und das Gewicht des Hölzes im frischgefällten Zustande. [Study of the solid wood content and the wood weight in the freshly cut state]. Mitteilungen der forstlichen Bundes-Versuchsanstalt Wien 1: 1–43.
Vorreiter L (1954) Mess- und Rechnungswerte für Rundhölzer. [Measurement and calculation values for roundwood]. Forstwissenschaftliches Centralblatt 73: 179–184.
Wabo E (2002) Capítulo 3: Cubicación y forma de árboles. Curso de Biometría Forestal - Guía de Clases. [Chapter 3: Scaling and trees shape. Forest Biometrics Course - Class Guide]. Universidad Nacional de La Plata. https://aulavirtual.agro.unlp.edu.ar/pluginfile.php/50979/mod_folder/content/0/WABO%20%20Cubicaci%C3%B3n.pdf?forcedownload=1. Accessed 7 Apr 2021.
WaldSchweiz, Holzindustrie Schweiz, Lignum, Holzbau Schweiz (2021) Schweizer Handelsgebräuche für Rohholz. [Swiss trade practices for raw wood].
Williams DL (1968) Converting Factors for Southern Pine Products. LSU Agricultural Experiment Station Reports 429. LSU Agricultural Experiment Station Reports, New Orleans, United States of America.
Witkowska J, Jodłowski K (2018) Determining the conversion factors for selected lengths of medium-sized pine and spruce wood in the S2 group. Finnish Forest Research Institute Research Papers 79: 69–76. https://doi.org/10.2478/frp-2018-0008.
Wuoti E (1933) Kuusipaperipuun kutistumisesta ja kutistumisen osuudesta pinon painumiseen. [About the shrinkage of spruce paper wood and the contribution of shrinkage to stacking]. Acta For Fenn 39: 1–47. https://doi.org/10.14214/aff.7277.
Zarate do Couto HT, Magalhães Bastos NL (1988) Fator de empilhamento para plantações de Eucaliptus no Estado de São Paulo. [Conversion factor for Eucalyptus plantations in the State of São Paulo]. IPEF Instituto de Pesquisas e Estudos Florestais 38: 23–27. https://www.ipef.br/publicacoes/scientia/nr38/cap03.pdf.
Zon RG (1903) Factors influencing the volume of solid wood in the cord. J For 1: 126–133.
Total of 160 references.
Send to email
