Olli-Pekka Tikkanen  ,
Ilari Lehtonen
,
Ilari Lehtonen
Changing climatic drivers of European spruce bark beetle outbreaks: a comparison of locations around the Northern Baltic Sea
Tikkanen O.-P., Lehtonen I. (2023). Changing climatic drivers of European spruce bark beetle outbreaks: a comparison of locations around the Northern Baltic Sea. Silva Fennica vol. 57 no. 3 article id 23003. https://doi.org/10.14214/sf.23003
Highlights
- Temperatures in the Northern Baltic Sea area will reach new and higher levels in all studied climate change scenarios, speeding up the development of the European spruce bark beetle
- Unless greenhouse gas emissions are reduced rapidly, more frequent droughts will facilitate spruce bark beetle outbreaks, especially in Sweden and, to a lesser extent, in Estonia and in Southern Finland.
Abstract
European spruce bark beetle (Ips typographus [L.]; SBB) damage has reached extreme and unprecedented levels in East Central Sweden, likely driven by increasing temperatures and severe drought due to climate change. However, SBB outbreaks have been less severe on the eastern side of the Baltic Sea, in Estonia and Finland, than in Sweden. This study investigated how precipitation, temperature sum, and droughts (hydrothermic index) have varied in land areas surrounding the Baltic Sea. We studied past meteorological observations from 1950 to 1999. We modeled the effect of climate change on precipitation and temperature using three representative concentration pathway (RCP) scenarios for greenhouse gas emissions (RCP2.6, RCP4.5, and RCP8.5) and multiple (17–23) climate models. Future climate projections (up to 2100) were made for Southeastern Estonia, Southern Finland, and East Central Sweden. Weather data showed that temperature sums had been high and droughts severe in the 2010s, particularly in East Central Sweden, where SBB outbreaks have been a more significant problem than on the eastern shores of the Baltic Sea. Future climate projections suggest that increases in temperature sum will further enhance SBB reproduction, especially in the RCP4.5 and RCP8.5 scenarios. In all climate change scenarios, drought continues to be a problem in East Central Sweden, potentially facilitating SBB outbreaks. In addition, moderate and severe droughts may become more frequent in Southeastern Estonia and Southern Finland if climate change proceeds as predicted in the RCP4.5 or RCP8.5 scenarios.
Keywords
climate change;
temperature sum;
precipitation;
Ips typographus;
hydrothermic index
-
Tikkanen,
School of Forest Sciences, University of Eastern Finland, P.O. Box 111, FI-80101 Joensuu, Finland
 https://orcid.org/0000-0002-3875-2772
E-mail
Olli-Pekka.Tikkanen@uef.fi
https://orcid.org/0000-0002-3875-2772
E-mail
Olli-Pekka.Tikkanen@uef.fi
-
Lehtonen,
Finnish Meteorological Institute, P.O. Box 503, FI-00101 Helsinki, Finland
https://orcid.org/0000-0001-7317-9580
E-mail
Ilari.Lehtonen@fmi.fi
Received 20 January 2023 Accepted 9 October 2023 Published 30 October 2023
Views 67505
Available at https://doi.org/10.14214/sf.23003 | Download PDF

Supplementary Files
1 Introduction
1.1 Climatic drivers
For at least 100 years, European spruce bark beetle (Ips typographus [L.]; hereafter SBB) outbreaks have been common in Central Europe. However, only occasional larger epidemics have occurred in Norway and Sweden in Northern Europe. In addition, north of the 60° N latitude, in Finland and Northwest Russia, the epidemics have been rare and much less damaging than in Southern (S) Sweden. A decreasing trend in temperature sum with increasing latitude appears to be one key factor limiting the growth rate of European SBB populations, creating a large-scale geographic pattern in epidemic severity. The ability of the SBB to produce second or even third generations in warm years (bivoltinism and trivoltinism) emphasizes the pivotal role of temperature sum in the growth rate of the SBB population; the higher the annual temperature sum, the higher the number of successfully developing SBB offspring (Annila 1969; Baier et al. 2007; Öhrn et al. 2014). Historically, the temperature sums have been so low that bivoltinism in Northern Europe has been very rare or impossible (Jönsson et al. 2011; Romashkin et al. 2020). In Central and Northern Europe, cool summers and the depletion of susceptible trees have ended epidemics, followed by periods of low population densities without substantial damage to standing forest tree stocks.
The second prerequisite for population growth is the availability of susceptible trees for colonization by SBB, which is often connected to heavy storms (Marini et al. 2017). Strong winds generated in low-pressure cyclones and downbursts of thunderstorm cells can create vast amounts of damaged Norway spruce (Picea abies [L.] H. Karst.; hereafter spruce) trees, which cannot be salvaged quickly. In Northern Europe, storm damage and SBB epidemics have been closely correlated. Storm damage is considered a necessary precursor of SBB population increases and subsequent outbreaks in standing living trees (Eriksson et al. 2005; Marini et al. 2013; Neuvonen et al. 2014). However, low temperature sums can limit the occurrence of outbreaks in standing trees even after large-scale wind damage (Annila and Petäistö 1978).
Healthy and vigorous standing spruce trees can better resist SBB attacks than wind-damaged trees. Under normal growing conditions, spruce trees can eliminate SBB intrusion using voluminous resin flow and by activating associated induced defense mechanisms, which damaged trees, such as windthrows or otherwise weakened or stressed trees, cannot do (Eriksson et al. 2005; Komonen et al. 2011; Schiebe et al. 2012; Matthews et al. 2018). Furthermore, drought stress, which limits induced resin flow in attacked trees, is considered a factor that makes spruce vulnerable to colonization by SBB (Matthews et al. 2018). However, the effect of drought on the susceptibility of trees to SBB attacks is not straightforward. Moderate water stress is hypothesized to improve tree resistance to the SBB, and chronic drought can make trees less favorable hosts for them (Kolb et al. 2016); however, acute severe droughts can make otherwise vigorous spruce trees more vulnerable to colonization (Netherer et al. 2019; Nardi et al. 2022).
In recent decades, climate change and warming temperatures have increased the frequency and severity of SBB epidemics in Europe (Hlásny et al. 2019). Rising temperatures and lower precipitation have caused drought stress in spruce forests beyond the natural range of Norway spruce. These trees now suffer from unprecedently high mortality due to SBB outbreaks in lowland areas of Central Europe. Reports are documenting that spruce forests are suffering and dying due to SBB attacks in many parts of Central, Eastern, and Western Europe, such as Austria, Czechia, France, Germany, Poland, Russia, and Slovenia (de Groot et al. 2019; Hlásny et al. 2019, 2021a; Netherer et al. 2019; Romashkin et al. 2020; Seidl et al. 2016; Stereńczak et al. 2020; Nardi et al. 2022).
1.2 Recent history of SBB outbreaks in the Baltic Sea area
In the Southern Baltic Sea area, SBB outbreaks have intensified dramatically in the past ten years. In the state forests of Mecklenburg Vorpommern, Northeast (NE) Germany, from 1998 to 2015, the annual average amount of trees damaged by the SBB was 5700 m3, excluding the peak years 2003/04 when >20 000 m3 was damaged (AFZ der Wald 1999–2016). More recently, from 2016 to 2020, annual SBB damage increased to 19 000 m3 before soaring to 195 000 m3 (AFZ der Wald 2017; Jansen 2021). Additionally, there has been a parallel development in Eastern Poland. In Białowieża, frequent low- to medium-level damage has been caused by the SBB since the 1990s. Between 1992 and 2012, the yearly volume of damaged trees varied between 5000 m3 and 100 000 m3, with 1995, 2003, and 2008 being the peak years (Brzeziecki et al. 2018). The damage rocketed after 2012, peaking close to 480 000 m3 in 2016, and has remained high thereafter (Brzeziecki et al. 2018; Stereńczak et al. 2020).
In the western part of the Baltic Sea, S Sweden has also experienced a rise in SBB outbreaks. For example, the cyclone Gudrun hit in 2005 and was followed by a second storm in 2007. As a result, the two storms blew down a massive amount of timber (87 million m³) and facilitated a major SBB epidemic (Bengtsson and Nilsson 2007; Lindelöw and Schroeder 2008). The total number of standing trees damaged by the SBB was approximately 3.5 million m3 (Lindelöw and Schroeder 2008). Even more significant SBB damage was seen very recently. Since 2018, East Central (EC) Sweden has suffered SBB outbreaks of unprecedented scale, with damage in terms of dead spruces exceeding millions of cubic meters annually. It was estimated that the volume of trees killed by the SBB was 3.5 million m3 in 2018 and 8.0 million m3 in 2020 (Schroeder 2019; Wulff and Roberge 2020). Furthermore, a storm event was not behind this SBB epidemic; the cause was the weakening of spruce trees due to severe drought (Schroeder 2019).
In the north and east of the Baltic Sea, SBB outbreaks have been less damaging than in the south and west in past decades. For example, in Lithuania, Stakėnas et al. (2012) analyzed forest inventory data from 1989 to 2010 and reported SBB damage in spruce forests throughout the country from 1993 to 1997. This damage occurred concurrently with the peak in damage observed in the Białowieża forest (Brzeziecki et al. 2018) and in Kaliningrad Oblast, Russian Federation (Romashkin et al. 2020). Unfortunately, recent official information from large-scale SBB outbreaks in Baltic countries was unavailable. However, outbreaks appear to have increased in the past few years, such as in Estonia (ERR 2020).
Until 2000, the risk of SBB damage to living trees was considered very low in Finland. For example, in their two-year study in severe wind-damaged areas in Western Finland, Annila and Petäjistö (1978) did not find signs of SBB outbreaks damaging standing living trees. However, the situation changed in November 2001, when two major storms hit S Finland; in the following summers, SBB attacks killed standing trees surrounding the gaps created by the storms (Eriksson et al. 2005). Ten years later, from 2010 to 2013, there was a substantial increase in local SBB outbreaks after big storms and exceptionally warm summers (Neuvonen et al. 2014; Viiri et al. 2019). While outbreaks of this scale had not been recorded previously in Finland, the total volume of damaged spruce logs was probably minor compared to the previous damage in Sweden or Central Europe (the volume of damaged trees was not recorded). After 2014, the frequency of salvage loggings due to SBB outbreaks decreased in Finland from 1800 in 2013 to 100–200 at the end of the decade (Metsäkeskus 2022).
1.3 Future trends in climate and outbreak susceptibility
Using the climate change and SBB phenological models, Jönsson et al. (2011) showed the enhancing effect of rising temperatures on the voltinism (number of distinct generations per year) of the SBB in Central and Northern Europe. Since then, new generations of climate models and pathways for atmospheric greenhouse gas concentrations have been developed and made available to climatologists. Moreover, recent SBB epidemics emphasize that, in addition to the projected increase in temperature, drought stress can also play a significant role in the emergence of SBB epidemics and the decline of coniferous forests (Kolb et al. 2016; Seidl et al. 2016; Jabłoński et al. 2019; Netherer et al. 2019; Hlásny et al. 2021a). Therefore, besides temperature sums, the effect of climate change on precipitation and drought stress risk should also be investigated to obtain a more complete picture of future SBB outbreak risks (Marini et al. 2017).
This study compared historical differences in precipitation, temperature sum, and hydrothermic (drought) index between high and low outbreak frequency areas around the Baltic Sea. Multiple recent-generation climate models were then used to create projections for future climatic conditions under three representative concentration pathway (RCP) scenarios around the Northern Baltic Sea area. More specifically, climate projections covering the period of 1900 to 2100 were made for four exact locations in Southeastern (SE) Estonia, S Finland, and EC Sweden. This study aimed to determine the differences in the climatic parameters (temperature sum and drought risk index) that might explain the observed regional variation in the occurrence and severity of SBB epidemics. Moreover, it investigated whether future climatic conditions in the mid and late 21st century favor the development of SBB epidemics in areas where SBB outbreaks have been less damaging.
2 Materials and methods
2.1 Past climate data for the period of 1950–1999
This work focused on three locations in the Northern Baltic Sea area (NBSA), specifically the historically low outbreak frequency areas of SE Estonia and S Finland, and EC Sweden, which has experienced epidemic conditions since the mid-2010s. Two separate (dist. 75–120 km) weather stations with long and continuous climate data series (>60 years) were selected from each location to study climatic conditions in these areas. For reference, two stations (Teterow, NE Germany, and Białystok, NE Poland) were selected from the Southern Baltic Sea area, where SBB outbreaks have been historically more common than in the NBSA. Altogether, past climate data from 1950 to 1999 for eight weather stations around the Baltic Sea area (Fig. 1; Table 1) were used. The weather data came from the KNMI Climate Explorer (ECA&D 2021), an open data bank maintained by the Royal Dutch Meteorological Institute and World Meteorological Organization. However, the Finnish Meteorological Institute (FMI) had a more extended time series in their archives than was available in the KNMI Climate Explorer. Therefore, we used data directly from the FMI for the two Finnish locations.
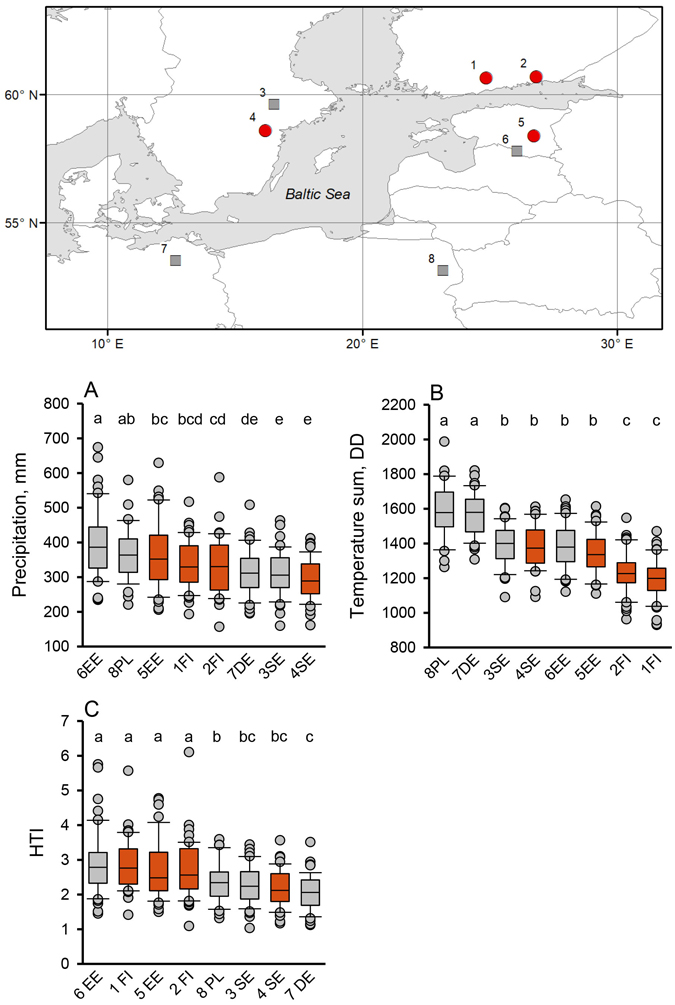
Fig. 1. The Baltic Sea area and the weather station locations (Table 1) whose data were used in this study (upper panel). Box plot graphs (below) show April to September medians and 25th and 75th percentiles (error bars: 10th and 90th percentiles) of (A) precipitation, (B) temperature sum, and (C) hydrothermic index (HTI) values at the given locations in the period 1950–1999. Different letters above the boxes indicate significant differences (LSD post hoc comparison P < 0.05) between locations. The future climate projections were made for four locations in Finland ([1] Hyvinkää, [2] Anjala), Sweden ([4] Norrköping), and Estonia ([5] Tarto) (red circles in the map refer to red boxes in A, B, and C). Additional locations from Sweden and Estonia (squares; [3] Västerås and [6] Valga) provide supportive climate data. The two weather stations in the Southern Baltic Sea area ([7] Teterow, NE Germany, and [8] Białystok, NE Poland) are located in current Ips typographus epidemic areas (2018–2020), as are the Swedish stations (3 and 4).
| Table 1. The names and coordinates of the weather stations (Fig. 1) whose data was used in this study, as given in the European Climate Assessment & Dataset (Climate Explorer, ECA&D 2021). | ||||
| Country | Station name | Coordinates (deg) | Altitude (m a.s.l.) | |
| 1 | Finland | HYVINKAA_HYVINKAANKYLA | 60.60N, 24.81E | 86 |
| 2 | Finland | KOUVOLA_ANJALA | 60.70N, 26.81E | 33 |
| 3 | Sweden | VASTERAS | 59.62N, 16.55E | 10 |
| 4 | Sweden | NORRKOPING-SORBY | 58.61N, 16.12E | 21 |
| 5 | Estonia | TARTU_ORAVERE* | 58.26N, 26.46E | 70 |
| 6 | Estonia | VALGA | 57.79N, 26.04E | 65 |
| 7 | Germany | TETEROW | 53.76N, 12.56E | 38 |
| 8 | Poland | BIALYSTOK | 53.11N, 23.16E | 148 |
| * Meteorological data from years 1964–2021; older data (1866–1996) available from nearby TARTU station (58.30N, 26.73E; 58 m a.s.l.). | ||||
The past climate analysis focused on the weather of the potential growing season (i.e., April to September) when the SBB is most active and Norway spruce is growing. From October to the end of March, the accumulation of temperature sum is very low, and late-year precipitation does not affect the resistance of Norway spruce to the SBB as much as summer precipitation (Netherer et al. 2019). Annual precipitation from April to September was the sum of rainfall (in mm) in the same period. Because daily values were unavailable in older Finnish meteorological data (1930–1959), we used monthly mean values to calculate the annual temperature sum (cumulative temperature sums > +5 °C; degree days [DDs]) from April to September. Using monthly instead of daily means does not cause significant errors in temperature sum values (Romashkin et al. 2020).
Furthermore, April to September precipitation and temperature sum were used to calculate the annual hydrothermic index (HTI; Eq. 1), one modification of Selyaninov’s hydrothermic coefficient (Afonin et al. 2005).

The HTI is a meteorological drought index describing the level of evapotranspiration. Low HTI values indicate dry and/or warm growing seasons, and high HTI values indicate wet and/or cold growing seasons. Differences in past climate (precipitation, temperature sum, and HTI) between the eight weather stations were tested with one-way analysis of variance (ANOVA) using log-transformed values and the IBM SPSS 27.0 statistical software.
2.2 Future climate projections based on CMIP5 RCP scenarios
To analyze potential changes in climatic drivers for SBB outbreaks by 2100, we used data from a total of 23 general climate models (GCMs) from the Coupled Model Intercomparison Project phase 5 (CMIP5; Taylor et al. 2012) under the three RCPs as listed in Table 2. The model simulations used covered the period from 1900 to 2100. The simulations forced by the observational greenhouse gas concentrations extended to the end of 2005, and they were combined with those forced by the RCPs from 2006 onwards. However, as shown in Table 2, the availability of model data varied among the RCPs, and thus, depending on the RCP scenario, 17–23 GCM simulations were used. An overview of the RCPs is presented by van Vuuren et al. (2011a), and the used RCPs (i.e., RCP2.6, RCP4.5, and RCP8.5) are discussed in more detail by van Vuuren et al. (2011b), Thomson et al. (2011), and Riahi et al. (2011), respectively. Briefly, the RCP2.6 represents a pathway to limit the increase in global mean temperature to 2 °C compared to the preindustrial era. This pathway relies on a rapid decrease in global greenhouse gas emissions after the 2020s. In the less ambitious RCP4.5, global greenhouse gas emissions peak before 2050, and the radiative forcing caused by the emissions stabilizes by 2100. The RCP8.5 represents a pathway of increasing global emissions of greenhouse gases throughout the 21st century. The 2.6, 4.5, and 8.5 labels after the RCP acronym refer to the radiative forcing in the upper atmosphere in W m–2 around the year 2100 compared to the preindustrial era. At first, the warming is similar among the different RCPs, but the pathways begin to diverge during the 2020s, and the differences become particularly significant after 2050. By the 2080s, the increase in annual mean temperature in Finland, for example, is most likely >5 °C compared to the climate of the late 20th century under the RCP8.5, approximately 3–4 °C under the RCP4.5, and slightly <2 °C under the RCP2.6 (Ruosteenoja et al. 2016a).
| Table 2. The Coupled Model Intercomparison Project phase 5 (CMIP5) models and representative concentration pathway (RCP) scenarios used in this study. More information about the models can be found in Flato et al. (2013). | |||
| Model | RCP2.6 | RCP4.5 | RCP8.5 |
| ACCESS1.0 | x | x | |
| BCC-CSM1.1 | x | x | x |
| CanESM2 | x | x | x |
| CCSM4 | x | x | x |
| CMCC-CM | x | x | |
| CMCC-CMS | x | x | |
| CNRM-CM5 | x | x | x |
| EC-EARTH | x | x | x |
| GFDL-CM3 | x | x | x |
| GFDL-ESM2M | x | x | x |
| GISS-E2-R | x | ||
| HadGEM2-CC | x | x | |
| HadGEM2-ES | x | x | x |
| INM-CM4 | x | x | |
| IPSL-CM5A-LR | x | x | x |
| IPSL-CM5A-MR | x | x | x |
| MIROC5 | x | x | x |
| MIROC-ESM | x | x | x |
| MIROC-ESM-CHEM | x | x | x |
| MPI-ESM-LR | x | x | x |
| MPI-ESM-MR | x | x | x |
| MRI-CGCM3 | x | x | x |
| NorESM1-M | x | x | x |
Since the climate model data is presented on a relatively coarse grid, and it is generally biased relative to the observed climate, we performed a combined statistical downscaling and bias correction to the model data using weather observations from the four locations in Estonia (Tartu: 58.26N, 26.46E), Sweden (Norrköping: 58.61N, 16.12E) and Finland (Anjala: 60.70N, 26.81E; Hyvinkää: 60.60N, 24.81E), as shown in Fig. 1. Particularly common model biases in NE Europe include too cold winter temperatures, too high precipitation levels in winter and spring, and modeled summer temperatures mostly being too low in Finland and Sweden (Cattiaux et al. 2013; Lehtonen and Jylhä 2019; Demory et al. 2020). The statistical downscaling and bias correction of the model data was performed by applying a quantile mapping technique using smoothing (Räisänen and Räty 2013; Räty et al. 2014). In quantile mapping, cumulative probability distributions of simulated time series of weather variables are fitted to the observed distributions within the calibration period separately for each month. Then, the data for the rest of the simulation period are adjusted similarly. Because of the strong spatial autocorrelation of climatic parameters (shown in regression analyses summarized in the Supplementary file S1: Table S1) and the relatively flat landscape of the NBSA, the simulation results calculated for the four locations (Fig. 1) can be considered to represent climatic conditions in nearby areas around the stations as well (i.e., SE Estonia, S Finland, and eastern parts of Central Sweden around Östergötland).
Daily mean temperature and precipitation observations from 1965 to 2005 were used for the calibration data. Since the bias correction was performed separately for each station, the corrected daily distributions of mean temperature and precipitation matched with the observed distributions at each location by definition during this period. Finally, the monthly values for temperature and precipitation for 1900 to 2100 were constructed from the corrected daily values.
The differences in annual means of GCM predictions of precipitation (mmApr-Sep), temperature sum (DDApr-Sep), and HTI in Tartu, Estonia; Anjala, Finland; and Norrköping, Sweden were tested using generalized linear model (GenLM) analyses (normal distribution and identity as link function) and the IBM SPSS 27.0 statistical software. The GenLM analyses used location, 33-year period, and RCP simulation as predicting factors.
Eleven-year moving averages of GCMs predictions were drawn for the graphical analysis of changes in temperature sum and HTI in Tartu, Estonia; Anjala and Hyvinkää, Finland; and Norrköping, Sweden, and reference lines were established, showing potential critical limits of temperature sum and HTI. The annual life cycle of the SBB starts from the spring swarming and egg laying of over-wintering adults, followed by egg, larval, and pupal stages, and ends with the emergence of new adults (Annila 1969). Completing the reproduction cycle takes an average of 625–750 DDs (Jönsson et al. 2007). New adults may start to reproduce if climatic conditions have been favorable for their development, but their reproduction is genetically regulated with substantial latitudinal variation (Schroeder and Dalin 2017). We used the temperature sum of 1500 DD as a proxy for the emergence of bivoltine and 2250 DD for trivoltine population dynamics (Jönsson et al. 2011; Romashkin et al. 2020). In summers when the temperature sum was <1500 DD, univoltine population dynamics prevail (Jönsson et al. 2011). By bivoltine and trivoltine population dynamics, we refer to the climatic potential for the reproduction of filial F1 and F2 beetle generations originating from the spring emerging parent population within the same season, regardless of the size and number of associated sister broods. To assess the risk of droughts, we examined the observed HTI values in recent SBB epidemic zones (means for 2011–2020 of 1.75 in Teterow, NE Germany, and 1.85 in Norrköping and 2.05 in Västerås, EC Sweden; ECA&D 2021). Based on these values, a reference line for HTI of 2.00 was drawn, indicating a rough threshold for drought stress in Norway spruce; HTI values lower than this facilitate SBB epidemics. These reference lines should not be considered as exact thresholds for the occurrence of SBB epidemics but as approximations intended to help assess the results.
3 Results
3.1 Past climate from 1950 to 1999
In the past climate period of 1950 to 1999, there were apparent differences in the climatic parameters of different locations within the Baltic Sea area (P < 0.001 in all cases; Table 3). Precipitation levels were higher at locations eastward (Estonia, Finland, and Poland) than westward (Germany, Sweden) of longitude 20° E. The highest April to September precipitation levels were recorded in SE Estonia and NE Poland, and the lowest in EC Sweden. The highest median precipitation (386 mm) was in Valga, SE Estonia, and it was 33% higher than the lowest median precipitation, which was in Norrköping, EC Sweden (289 mm; Fig. 1A). Furthermore, the temperature sum increased along the north-south gradient. The highest median temperature sum was recorded in Teterow, NE Germany (1580 DD), and in Białystok, NE Poland (1578 DD), which were 32% higher than the lowest median temperature sum (1199 DD) in Hyvinkää, S Finland (Fig. 1B).
| Table 3. One-way ANOVA results for precipitation (mmApr–Sep), temperature sum (DDApr–Sep), and hydrothermic index (HTI) between different locations in the Baltic Sea area for the period 1950–1999 (Fig. 1). The tested climate parameters are log-transformed. | ||||||||||||
| Precipitation (mmApr–Sep) | Temperature sum (DDApr–Sep) | HTI | ||||||||||
| df | MS | F | P | df | MS | F | P | df | MS | F | P | |
| Between groups | 7 | 0.085 | 8.83 | <0.001 | 7 | 0.085 | 52.53 | <0.001 | 7 | 0.165 | 12.10 | <0.001 |
| Within groups | 371 | 0.010 | 371 | 0.002 | 371 | 0.014 | ||||||
| Total | 378 | 378 | 378 | |||||||||
The HTI values were high in the northeast (Estonia and Finland) and low in the west and south of the Baltic Sea area (Germany, Poland, and Sweden). The highest median HTI value of 2.79 was in Valga, SE Estonia, which was 35% higher than the lowest median HTI value of 2.06 in Teterow, NE Germany (Fig. 1C).
3.2 Simulated climate from 2001 to 2099
3.2.1 Projected changes in precipitation, temperature sum, and HTI
Based on the GCM simulations, April to September precipitation (median of model values) in all three RCP scenarios in the NBSA increased slightly from 2001–2033 to 2064–2099 (Fig. 2A–C; Period [P < 0.001] but no Location × Period interaction [P > 0.05]; Table 4). The increase was 2%–5% in Tartu, Estonia, and Anjala, Finland. In Norrköping, Sweden, the increase was 2% in the RCP2.6 scenario and 6% in the RCP4.5 scenario but only 1% in the RCP8.5 scenario (Location × RCP interaction [P = 0.001]; Table 4). Overall, precipitation was higher in Tartu than in Anjala or Norrköping (Fig. 2A–C; Location [P < 0.001]; Table 4.). In the RCP2.6 and RCP4.5 scenarios, most (58%–70%) GCMs predicted a slight increase in precipitation. In RCP8.5 scenarios, the proportion of models predicting a decrease in precipitation was similar to those predicting an increase in precipitation (50%–55%).
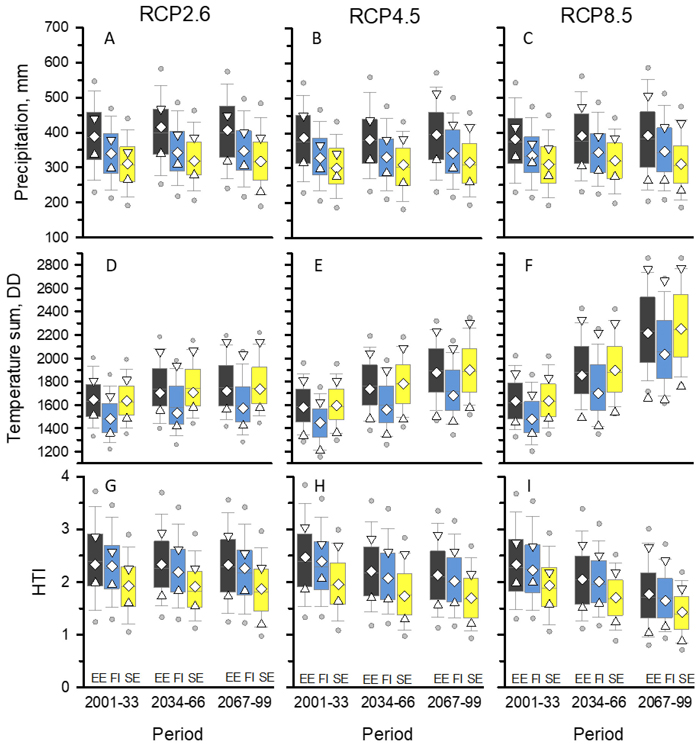
Fig. 2. Global circulation model (GCM) predictions for precipitation (mmApr-Sep), temperature sum (DDApr-Sep), and hydrothermic index (HTI) for three 33-year periods of the 21st century in Tartu, Estonia (EE); Anjala, Finland (FI); and Norrköping, Sweden (SE) under the three representative concentration pathway (RCP) simulations. Open symbols indicate values of the median (◊), maximum (∇), and minimum (Δ) climate models. Boxplots show the pooled data of 33 annual predictions of n climate models (n = the number of models; RCP2.6: n = 17; RCP4.5: n = 23; RCP8.5: n = 22). Boxplot: median and 25th and 75th percentiles (box), 5th and 95th percentiles (bars), and 1st and 99th percentiles (circles).
| Table 4. Generalized linear mixed model (GenLM) analysis results for the effects of Location, Period, and RCP (representative concentration pathway) scenario on global circulation model (GCM) prediction of precipitation (mmApr-Sep), temperature sum (DDApr-Sep), and HTI (Fig. 2). Locations (L): EE Tartu, FI Anjala, and SE Norrköping; Periods (P): 2001–2033, 2034–2066, and 2067–2099; RCP scenarios: RCP2.6, RCP4.5, and RCP8.5. The test parameter was the annual mean of n GCM predictions (n = the number of models; RCP2.6: n = 17; RCP4.5: n = 23; RCP8.5: n = 22). Numbers in bold are statistically significant. | |||||||||
| Precipitation | Temperature sum | HTI | |||||||
| Wald χ2 | df | P | Wald χ2 | df | P | Wald χ2 | df | P | |
| (Intercept) | 334 308.6 | 1 | <0.001 | 583 098.7 | 1 | <0.001 | 203 241.3 | 1 | <0.001 |
| Location | 2667.5 | 2 | <0.001 | 1085.7 | 2 | <0.001 | 1701.0 | 2 | <0.001 |
| Period | 59.2 | 2 | <0.001 | 3736.5 | 2 | <0.001 | 765.2 | 2 | <0.001 |
| RCP scenario | 42.8 | 2 | <0.001 | 1693.1 | 2 | <0.001 | 525.9 | 2 | <0.001 |
| L × P | 1.6 | 4 | 0.806 | 4.0 | 4 | 0.407 | 4.3 | 4 | 0.372 |
| L × RCP | 19.0 | 4 | 0.001 | 2.0 | 4 | 0.737 | 11.9 | 4 | 0.018 |
| P × RCP | 20.0 | 4 | <0.001 | 1297.1 | 4 | <0.001 | 290.4 | 4 | <0.001 |
| L × P × RCP | 2.4 | 8 | 0.966 | 1.0 | 8 | 0.998 | 1.0 | 8 | 0.998 |
The April to September temperature sum (median of model values) increased markedly from 2001–2033 to 2064–2099 in the different RCP scenarios (Fig. 2D–F). The level of increase was very similar in Tartu, Anjala, and Norrköping; 5%–6% in RCP2.6, 16%–19% in RCP4.5, and 36%–38% in RCP8.5 scenarios (no Location × Period or Location × RCP interactions; Table 4). Throughout 2001–2033, 2034–2066, and 2064–2099, the temperature sums were higher in Tartu and Norrköping than in Anjala (Location [P < 0.001]; Table 4). In all RCP scenarios and locations, GCMs predicted an increase in temperature sums, except for two models (GFDL-ESM2M and MPI-ESM-MR, Table 2), which predicted almost no change in the temperature sum in RCP2.6 (<2%).
HTI values for April to September (median of model values) decreased from 2001–2033 to 2064–2099 in the NBSA in RCP4.5 (−16%‒ −13%) and RCP8.5 scenarios (−26%‒ −24%; Fig. 2G–I). In the RCP2.6 scenario, the decrease in HTI was slight or nonexistent (−3%‒ 0%; Period × RCP interaction [P < 0.001]; Table 4). In all RCP scenarios, the HTI value remained much lower in Norrköping than in Anjala or Tartu (Location [P < 0.001]; Table 4).
3.2.2 Temperature sum and HTI values from 1900 to 2100
The three climate change scenarios differed in the pattern of future increases in temperature sums (Fig. 3, multi-year moving average). The RCP2.6 scenario predicted that the increase in temperature sum would peak in the 2020s and then plateau in the 2050s (Fig. 3A). In this scenario, the average temperature sum was approximately 400 DD higher at the end of the 21st century than at the start of the 20th century. Further, the RCP4.5 scenario predicted that temperature sums would continue to increase steadily throughout the 21st century. Therefore, the temperature sums are approximately 500 DD higher at the end of the 21st century than at the start of the 20th century (Fig. 3B). Finally, the RCP8.5 scenario predicted a steep increase in temperature sums throughout the 21st century, reaching 1000 DD by the end of the 21st century compared to the average temperature sum for most of the 20th century (Fig. 3C).
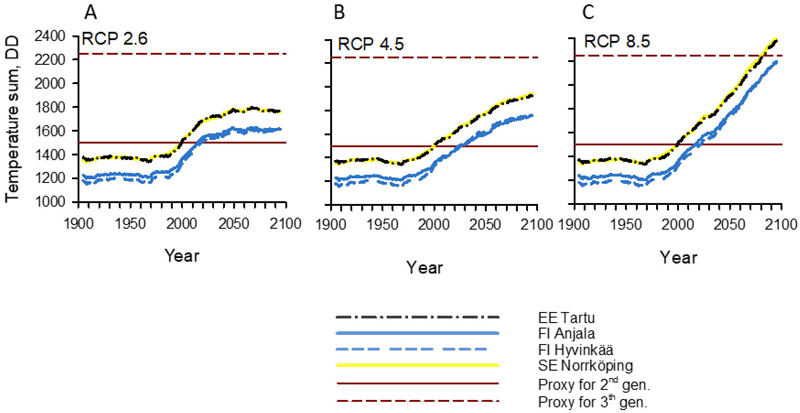
Fig. 3. Temperature sums (DDApr-Sep) for the period 1900–2100 in the Northern Baltic Sea Area under the (A) RCP2.6, (B) RCP4.5, and (C) RCP8.5 climate change scenarios. Graph lines show 11-year moving averages calculated from the annual averages of 17 models in the RCP2.6 scenario, 23 in the RCP4.5 scenario, and 22 in the RCP8.5 scenario. Locations (EE Tartu, FI Anjala, FI Hyvinkää, and SE Norrköping) are shown in Fig. 1. The annual temperature sums needed for the development of second (1500 DD) or third (2250 DD) generations (straight horizontal lines) of Ips typographus are based on the results of Annila (1969), which showed that approximately 750 DD is needed for the development of a single generation. The temperature sum lines of Tartu and Norrköping overlap in the graphs. RCP = representative concentration pathway.
The multi-year average annual temperature sum (DDApr-Sep) exceeded the threshold of 1500 DD (potentially allowing bivoltine SBB population dynamics) around the year 2000 in Tartu, Estonia, and Norrköping, Sweden (Fig. 3). In Anjala and Hyvinkää, S Finland, the 1500 DD threshold was reached approximately 20 years later than in Tartu or Norrköping. The threshold of 2250 DD (potentially allowing trivoltine SBB population dynamics) was not surpassed in the RCP2.6 and RCP4.5 scenarios at any location (Fig. 3A–B). However, in the RCP8.5 scenario, this threshold was surpassed at the end of the 21st century in Tartu and Norrköping, and temperature sums in Anjala and Hyvinkää were close to reaching this threshold (Fig. 3C).
HTI values showed a declining trend throughout the 21st century in the NBSA, indicating an increasing probability of severe droughts (Fig. 4, multi-year moving average). However, unlike the other RCP scenarios, in the RCP2.6 scenario, HTI values first declined and then started to rise towards the end of the 21st century due to slightly decreasing temperatures compared to the 2050s (Fig. 4A). In the RCP4.5 scenario, the decrease in HTI values stopped after the 2050s due to slower temperature increases. However, it remained at low levels until 2100 (Fig. 4B). In the RCP8.5 scenario, the steep decline in HTI values that started in the late 20th century continued throughout the 21st century (Fig. 4C).
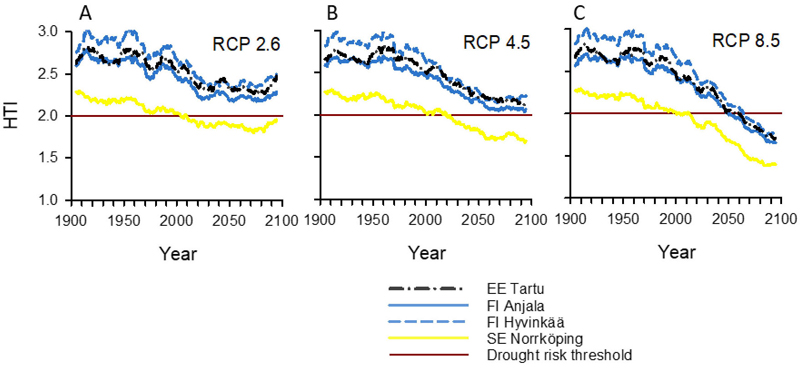
Fig 4. Hydrothermic index (HTI) values for the period 1900–2100 in the Northern Baltic Sea Area under the (A) RCP2.6, (B) RCP4.5, and (C) RCP 8.5 climate change scenarios. Graph lines show 11-year moving averages calculated from the annual averages of 17 models in the RCP2.6 scenario, 23 in the RCP4.5 scenario, and 22 in the RCP8.5 scenario. Locations (EE Tartu, FI Anjala, FI Hyvinkää, and SE Norrköping) are shown in Fig. 1. Values from the known current outbreak epidemic areas within the Baltic Sea Region were used to estimate the drought risk threshold (horizontal straight line), indicating suboptimal conditions for Norway spruce and increased risk of widespread Ips typographus epidemics (see Fig. 1 and Material and methods).
HTI values in Norrköping were much lower than in Tartu, Anjala, or Hyvinkää in all years and for all RCP scenarios (Fig. 4). In Norrköping, most years after 2020 were dry (HTI < 2.00) and largely very dry (HTI < 1.75) in the RCP4.5 and RCP8.5 scenarios (Table 5). The RCP8.5 scenario also predicted frequent moderate to severe droughts for Tartu, Anjala, and Hyvinkää. In Norrköping, multi-year average HTI values dropped below 2.0 in all scenarios in the first decades of the 21st century. Moreover, in Tartu, Anjala, and Hyvinkää, multi-year average HTI values dropped close to but not below 2.0 in the RCP4.5 scenario. In the RCP8.5 scenario, there was a steady and deep decline in HTI values in all locations, and multi-year average HTI values dropped well below 2.0 not only in Norrköping but also in Tartu, Anjala, and Hyvinkää after the 2050s.
| Table 5. Percentage of years with moderate (HTI < 2.00) or severe (HTI < 1.75) drought risk under the three RCP climate change scenarios in the period 2020–2100. Percentages were calculated from annual values (multi-model mean of HTI) for each studied location. The indicative drought risk threshold (HTI < 2.00) was estimated from observed HTI values during recent SBB epidemics in NE Germany and EC Sweden (see Methods and Suppl. file S1: Fig. S2). HTI = hydrothermic index. RCP = representative concentration pathway. | |||||
| Climate change scenario | HTI | Estonia | Finland | Finland | Sweden |
| Tartu | Anjala | Hyvinkää | Norrköping | ||
| RCP2.6 | <2.00 | 2 | 5 | 0 | 79 |
| <1.75 | 0 | 0 | 0 | 15 | |
| RCP4.5 | <2.00 | 6 | 14 | 5 | 94 |
| <1.75 | 0 | 0 | 0 | 38 | |
| RCP8.5 | <2.00 | 56 | 64 | 43 | 98 |
| <1.75 | 17 | 30 | 14 | 72 | |
4 Discussion
4.1 Climate and recent occurrence of SBB epidemics in the NBSA
Our results showed differences in temperature sum and drought index at locations within the NBSA, which may explain why there has recently been a large-scale SBB epidemic in Sweden, on the western side of the NBSA, but not in Estonia or Finland, on the eastern side of the NBSA (Fig. 1). Since 2000, the extreme rise in average temperature sums, well above 1500 DD, have favored the reproduction and growth of SBB populations in EC Sweden (Annila 1968; Baier et al. 2007; Jönsson et al. 2007), where high temperatures have co-occurred with abnormally acute drought stress (Netherer et al. 2019; Nardi et al. 2022). Additionally, these results are consistent with the analyses of Aalto et al. (2021), which indicated significant changes in thermal growing seasons since 1950 in Northern Europe.
Very low HTI values indicate a combination of high temperature sums and low precipitation in EC Sweden (Suppl. file S1: Fig. S2), which have made local Norway spruce forests susceptible to SBB outbreaks (Netherer et al. 2019; Hlásny et al. 2021a; Nardi et al. 2022). Indeed, in the past five years, the HTI values in EC Sweden have been very low (Suppl. file S1: Fig. S2), even with the standards of the Southern Baltic Sea area in Germany and Poland (Fig. 1), where spruce forests have suffered more chronically from SBB epidemics than in the NBSA.
While the temperature sums have been equally high in SE Estonia and EC Sweden, the precipitation has been higher in SE Estonia. One possibility is that the effect of droughts in the 2010s on spruce forests in Estonia has generally not been as severe as in Sweden, which may have helped save Estonia from a large-scale SBB epidemic (see also Suppl. file S1: Fig. S2). However, precipitation has been higher and the temperature sums have been much lower in S Finland than in EC Sweden. Under these conditions, SBB population growth should have been much lower than in EC Sweden or Estonia, and drought stress of spruce trees has been less severe than in Sweden, as suggested by results from earlier empirical studies (Annila 1969; Öhrn et al. 2014; Matthews et al. 2018; Netherer et al. 2019; Nardi et al. 2022).
Our analysis used a meteorological drought index (HTI) describing evapotranspiration using the relationship between precipitation and temperature sum. It can be used to analyze differences in drought risk between climate regimes. Declines in the multiannual average of HTI values reflect changes in precipitation and temperature, which are likely associated with an increase in the frequency of years when extreme drought events can occur. However, like all meteorological drought indices, HTI ignores site factors. A hydrological drought index accounting for soil moisture and other site factors may be better for spatially more explicit risk mapping than a meteorological drought index. At the spruce stand level, the realized drought risk was affected not only by precipitation and temperature but also by site factors, including topography, soil texture, and stoniness (Kosunen et al. 2019). Variation in groundwater level also needs to be considered. Netherer et al. (2019) found that SBB damage risk was higher in sites suffering from acute water stress, whereas spruce trees growing in chronically dry soils may be less favored as host trees. Furthermore, the physiological interactions among drought, a host tree’s carbon-based defenses, pathogens, and SBB outbreaks are complex and uncertain: there are both positive and negative feedback mechanisms (Kolb et al. 2016; Huang et al. 2020). Numerous North American cases generally show that drought increases bark beetle outbreak risk (Kolb et al. 2016).
As mentioned, the average annual temperature sum has reached 1500 DD, which can be considered a necessary precondition for the SBB epidemics (Jönsson et al. 2011) in the early 2000s in EC Sweden and SE Estonia. A similar substantial increase in temperature sums after 2000 and northward movement of the 1500 DD isocline have been reported in European Russia (Romashkin et al. 2020). However, in S Finland, where only some years have been warm (>1500 DD), unfavorable weather for SBB reproduction has been more common, limiting SBB population growth. For example, the heat and storms in 2010 and 2011 caused an SBB outbreak epidemic in SE Finland from 2012 to 2014, fading after cool summers from 2015 to 2017 (J.A. Pulgarin et al., unpublished).
Based on models (e.g., Jönsson et al. 2011), experiments (Öhrn et al. 2014; Lindman et al. 2023) and supporting field observations (SBB outbreaks and 2nd generation were found after very warm and dry summers with >1500 DD and HTI <2.0 in NBSA; Pouttu and Annila 2010; Schroeder 2019) we have relatively good overview about the increasing effect of high temperatures on reproduction rate of SBB in North Europe. However, extensive long-term studies of population dynamics or outbreak frequency are rare. Marini et al. (2013) analyzed long term pheromone trap data (1995–2011) and concluded that storms are the main drivers of population growth of SBB in southern Sweden, but this study was done before the recent dramatic rise of temperatures. New time series studies, which analyze the effect of temperature and precipitation (drought) on occurrence of SBB outbreaks, would greatly help to improve the accuracy of predictions of future SBB outbreak risks in North Europe.
The mean periodic temperature sum of April to September was used as an SBB outbreak risk proxy. It is known that springtime swarming conditions and timing and their subsequent effect on SBB diapause, sister broods, and voltinism impacts the reproduction of SBB populations (Baier et al. 2007; Jönsson et al. 2011; Öhrn et al. 2014). Because of substantial annual variation in spring weather, including swarming conditions is particularly important if the aim is to analyze year-to-year variation in reproductive success. However, the overall positive relationship between the annual temperature sum and the number of warm days in spring (Romashkin et al. 2020) suggests climate warming will generally favor earlier SBB swarming in the NBSA. Moreover, the annual precipitation will increase in winter, but the solar radiation will not change much in spring (April to May; Ruosteenoja et al. 2016a). This pattern suggests that swarming will be promoted by earlier springs with favorable temperatures more frequently in the future than in the current climate.
Large-scale storm damage is likely to occur throughout the NBSA in the future. Current climate analyses suggest only minimal changes in future wind speeds, but due to warmer winters, a shorter cold period when the soil is frozen will further increase the risk of tree uprooting (Peltola et al. 2010; Venäläinen et al. 2020). Marini et al. (2017) concluded that storms as driving factors of SBB epidemics are unrelated to the two other drivers of temperature and drought. However, as the mean temperature sums rise well above 1500 DD in the NBSA, it is very likely that after large-scale storms, there will be a more rapid shift from the endemic to epidemic phase in SBB population dynamics.
4.2 Trends in future climatic conditions favoring SBB epidemics in the NBSA
Future climate projections predicted the average changes in precipitation and temperature for the studied locations (Tartu, Anjala, Hyvinkää, and Norrköping). The high spatial autocorrelation of climatic parameters between neighboring weather stations and the relatively flat landscape of the NBSA allows us to generalize the simulation results (based on station-level weather data) to climatic conditions in somewhat larger areas (e.g., the area between two stations of the same country; Fig. 1; Suppl. file S1: Figs. S1, and S2; Aalto et al. 2021).
In their benchmark study, Jönsson et al. (2011) predicted that SBB populations in the Baltic countries, S Sweden, and southernmost Finland will change from univoltine to bivoltine population dynamics by the end of the 21st century. However, the more recent climate models used in this analysis suggest that the change from univoltine to bivoltine population dynamics has already occurred in the Baltic countries and S Sweden. Southernmost Finland will follow soon, regardless of the RCP climate scenario used in the modeling. This conclusion is supported by the simulations, recent field observations (Kosunen et al. 2019; Pouttu and Annila 2010; Schroeder 2019; Wulff and Roberge 2020), and meteorological data (ECA&D 2021).
The future rise in temperature sums is evident, which predicts an increase in SBB reproductive capacity. The probability of severe droughts, which decrease the ability of spruce to defend against SBB attacks, is higher in the RCP4.5 and RCP8.5 scenarios than in the RCP2.6 scenario, which is unsurprising. From the perspective of forest health, the increase in temperatures in the RCP2.6 scenario suggests a slightly higher future outbreak epidemic risk in the NBSA compared to the current situation. However, both RCP4.5 and RCP8.5 scenarios predict significant escalation and worsening of SBB epidemic risk in the latter half of the 21st century. The following paragraphs outline the potential development of the SBB epidemic risk in the NBSA for different climate change scenarios. These predictions cover only the studied locations and nearby areas with the same climatic regime and large proportion of mature spruce forests in the landscape.
4.2.1 EC Sweden
In the best scenario (RCP2.6), the rapid increase in temperature sum and decrease in HTI will stop between 2020 and 2050. However, both remain at a more dangerous level than in the historical period, suggesting that SBB outbreaks continue to be a significant threat to the health of spruce forests throughout the 21st century in EC Sweden. After periods of dry and warm years, drought-driven SBB epidemics similar to those seen recently may occur (Schroeder 2019; Wulff and Roberge 2020). The realization of RCP4.5 and RCP8.5 climate change scenarios would predict even higher outbreak risks and wider scale damage than previously observed. In the RCP8.5 scenario, the temperature sum will surpass the threshold of 2250 DD at the end of 2100’s, potentially allowing for trivoltine SBB population dynamics.
4.2.2 SE Estonia
SE Estonia is in the same latitude as EC Sweden. Therefore, temperature sums follow a similar trajectory in SE Estonia and EC Sweden. However, the higher precipitation found in SE Estonia may lower the risk of droughts compared to EC Sweden. Because of high precipitation, the drought stress risk (HTI) likely remains moderate until 2100 in the RCP4.5 scenario and is high only after 2040 in the RCP8.5 scenario. Furthermore, in the RCP4.5 and RCP8.5 scenarios, increasing temperature sums put extra pressure on outbreak risk. In the RCP8.5 scenario, the temperature sum will surpass the threshold of 2250 DD at the end of 2100’s, potentially allowing for trivoltine SBB population dynamics.
4.2.3 S Finland
In S Finland, the temperature sums are lower than in SE Estonia, but precipitation is only slightly lower. Therefore, the risk of drought stress in different climate change scenarios is similar to that in SE Estonia. However, the low temperature sums suggest that the overall risk for future SBB epidemics is lower in S Finland than in SE Estonia. The temperature sums generally increase in S Finland in all climate change scenarios, making the future conditions favorable for increased SBB reproduction (including the change from univoltine to bivoltine population dynamics) and a higher SBB outbreak risk.
5 Conclusions
Climate simulations indicated similarities in future climate trends but continued climatic differences between the studied areas within the NBSA. The potential for drought stress (low HTI) will make the spruce forests of EC Sweden vulnerable to SBB outbreaks in all studied climate change scenarios. While drought stress is not such an imminent threat on the eastern side as on the western side of the NBSA, temperatures have already risen to a new level in the entire area. Increases in temperature sums enhance SBB reproduction substantially, especially in EC Sweden and SE Estonia, and are also expected in S Finland later in the 21st century. In the new warmer climate, SBB populations can rapidly grow to outbreak densities after large-scale storm events. As in the RCP8.5 scenario, uncontrolled climate change predicts an ever-worsening SBB outbreak risk in the whole NBSA throughout the 21st century. In response to increasing SBB outbreak risk in the NBSA and its apparent adverse effects on ecosystem services and forest economies, detailed spatial risk analyses (e.g., similar to those performed in Central Europe; de Groot et al. 2019; Hlásny et al. 2021a; Netherer et al. 2019; Nardi et al. 2022) simulating future climatic conditions are in demand. The larger and very urgent goal should be to develop and update SBB outbreak management practices and policy, including changes in forest structure to make them less susceptible to SBB attacks, so that society can respond to the multiple challenges created by increased SBB outbreak frequency (Hlásny et al. 2021b).
Declaration of openness of research materials, data, and code
The meteorological data is freely available in the Climate Explorer database http://climexp.knmi.nl/start.cgi, except for the older Finnish data, which is available from the authors upon request. The CMIP5 data can be downloaded from the Earth System Grid Federation data nodes at https://esgf.llnl.gov/nodes.html and the Climate Data Store of the Copernicus Climate Change Service at https://cds.climate.copernicus.eu. Downscaled climate data for Tartu, Anjala, Hyvinkää, and Norrköping are available from the authors upon request.
Declaration of interests
The authors declare no conflicts of interest.
Authors’ contributions
Conceptualization (OPT), data curation and analysis (OPT, IL), original draft preparation (OPT) and writing (OPT, IL).
Funding
Not applicable.
Acknowledgments
Päivi Lyytikäinen-Saarenmaa and anonymous reviewers gave many helpful and valuable comments on this article. This study was conducted in affiliation with the Academy of Finland Flagship Forest-Human-Machine Interplay–Building Resilience, Redefining Value Networks and Enabling Meaningful Experiences (UNITE), Decision no 337127. We acknowledge the World Climate Research Programme’s Working Group on Coupled Modelling, which was responsible for CMIP, and we thank the climate modeling groups listed in Table 2 for producing and making their model output available. For CMIP, the US Department of Energy’s Program for Climate Model Diagnosis and Intercomparison provided coordinating support and led the development of software infrastructure in partnership with the Global Organization for Earth System Science Portals. We thank Kimmo Ruosteenoja for downloading and pre-processing the climate model data.
References
Aalto J, Pirinen P, Kauppi PE, Rantanen M, Lussana C, Lyytikäinen-Saarenmaa P, Gregow H (2021) High-resolution analysis of observed thermal growing season variability over northern Europe. Clim Dynam 58: 1477–1493. https://doi.org/10.1007/s00382-021-05970-y.
Afonin AN, Lipiyainen KL, Li YS, Tsepelev VY (2005) Climate – Selyaninov’s hydrothermic coefficient. Interactive atlas of useable plants, their pests and ecological factors in Russia and neighboring countries. http://www.agroatlas.ru/en/content/Climatic_maps/GTK/GTK/index.html. Accessed 17 January 2023.
AFZ Der Wald (1999–2016) Waldschutz 1999–2016. [Forest protection 1999–2016]. Allgemeine Forst Zeitschrift für Waldwirtschaft und Umweltvorsorge. BLV Verlagsgesellschaft, München. Issue 7 of years 1999–2016.
AFZ Der Wald (2017) Übersicht Waldschutz 2016/2017. [Overview of forest protection 2016/2017]. Allgemeine Forst Zeitschrift für Waldwirtschaft und Umweltvorsorge. BLV Verlagsgesellschaft, München. Issue 7/2017.
Annila E (1969) Influence of temperature upon the development and voltinism of Ips typographus L. (Coleoptera, Scolytidae). Ann Zool Fennici 6: 161–208. https://www.jstor.org/stable/23731366.
Annila E, Petäistö R-L (1978) Insect attack on windthrown trees after the December 1975 storm in western Finland. Comm Instit For Fenniae 94: 1–24. http://urn.fi/URN:NBN:fi-metla-201207171125.
Baier P, Pennerstorfer J, Schopf A (2007) PHENIPS – a comprehensive phenology model of Ips typographus (L.) (Col., Scolytinae) as a tool for hazard rating of bark beetle infestation. For Ecol Manage 249: 171–186. https://doi.org/10.1016/j.foreco.2007.05.020.
Bengtsson A, Nilsson C (2007) Extreme value modelling of storm damage in Swedish forests. Nat Hazards Earth Syst Sci 7: 515–521. https://doi.org/10.5194/nhess-7-515-2007.
Brzeziecki B, Hilszczański J, Kowalski T, Łakomy P, Małek S, Miścicki S, Modrzyński J, Sowa J, Starzyk JR (2018) Problem masowego zamierania drzewostanów świerkowych w Leśnym Kompleksie Promocyjnym „Puszcza Białowieska”. [The problem of mass dieback of spruce stands in the Forest Complex “Puszcza Białowieska”]. Sylwan 162: 373−386.
Cattiaux J, Douville H, Peings Y (2013) European temperatures in CMIP5: origins of present-day biases and future uncertainties. Clim Dyn 41: 2889–2907. https://doi.org/10.1007/s00382-013-1731-y.
de Groot M, Diaci J, Ogris N (2019) Forest management history is an important factor in bark beetle outbreaks: lessons for the future. For Ecol Manage 433: 467–474. https://doi.org/10.1016/j.foreco.2018.11.02.
Demory M-E, Berthou S, Fernández J, Sørland SL, Brogli R, Roberts MJ, Beyerle U, Seddon J, Haarsma R, Schär C, Buonomo E, Christensen OB, Ciarlo JM, Fealy R, Nikulin G, Peano D, Putrasahan D, Roberts CD, Senan R, Steger C, Teichmann C, Vautard R (2020) European daily precipitation according to EURO-CORDEX regional climate models (RCMs) and high-resolution global climate models (GCMs) from the High-Resolution Model Intercomparison Project (HighResMIP). Geosci Model Dev 13: 5485–5506. https://doi.org/10.5194/gmd-13-5485-2020.
ECA&D (2021) Climate explorer. European Climate Assessment & Dataset. http://climexp.knmi.nl/start.cgi. Accessed 22 April 2022.
ERR (2020) Kuuse-kooreürask vallutab järk-järgult Eesti kuusikuid. [The spruce bark beetle is gradually conquering Estonian spruce trees]. Estoninan bradcasting company, Eesti Rahvusringhääling, news story 14 May 2020. https://novaator.err.ee/1089240/kuuse-kooreurask-vallutab-jark-jargult-eesti-kuusikuid. Accessed 17 January 2023.
Eriksson M, Pouttu A, Roininen H (2005) The influence of windthrow area and timber characteristics on colonization of wind-felled spruces by Ips typographus (L.). For Ecol Manage 216: 105–116. https://doi.org/10.1016/j.foreco.2005.05.044.
Flato G, Marotzke J, Abiodun B, Braconnot P, Chou SC, Collins W, Cox P, Driouech F, Emori S, Eyring V, Forest C, Gleckler P, Guilyardi E, Jakob C, Kattsov V, Reason C, Rummukainen M (2013) Evaluation of climate models. In: Stocker TF, Qin D, Plattner G-K, Tignor M, Allen SK, Boschung J, Nauels A, Xia Y, Bex V, Midgley PM (eds) Climate change 2013 - the physical science basis. Contribution of Working Group I to the Fifth Assessment Report of the Intergovernmental Panel on Climate Change. Cambridge and New York, NY. Cambridge University Press, pp 741–866. https://doi.org/10.1017/CBO9781107415324.020.
Hlásny T, Krokene P, Liebhold A, Montagné-Huck C, Müller J, Qin H, Raffa K, Schelhaas M-J, Seidl R, Svoboda M, Viiri H (2019) Living with bark beetles: impacts, outlook and management options. From science to policy 8. European Forest Institute. https://doi.org/10.36333/fs08.
Hlásny T, Zimová S, Merganičová K, Štěpánek P, Modlinger R, Turčáni M (2021a) Devastating outbreak of bark beetles in the Czech Republic: drivers, impacts, and management implications. For Ecol Manage 490, article id 119075. https://doi.org/10.1016/j.foreco.2021.119075.
Hlásny T, König L, Krokene P, Lindner M, Montagné-Huck C, Müller J, Qin H, Raffa K, Schelhaas M-J, Seidl R, Svoboda M, Viiri H, Seidl R (2021b) Bark beetle outbreaks in Europe: state of knowledge and ways forward for management. Curr For Rep 7: 138–165. https://doi.org/10.1007/s40725-021-00142-x.
Huang J, Kautz M, Trowbridge AM, Hammerbacher A, Raffa KF, Adams HD, Goodsman DW, Xu C, Meddens AJH, Kandasamy D, Gershenzon J, Seidl R, Hartmann H (2020) Tree defence and bark beetles in a drying world: carbon partitioning, functioning and modelling. New Phytol 225: 26–36. https://doi.org/10.1111/nph.16173.
Jabłoński T, Tarwacki G, Sukovata L (2019) Pine forest conditions in Poland in 2015–2018. In: Tkach V, Meshkova V, Vysotska N, Kobets O, Obolonyk I, Tsapenko D (eds) Pine forests: current status, existing challenges and ways forward. Proceedings of International Scientific and Practical Conference, 12–13 June 2019, Kyiv, Ukraine, pp 83–88. ISBN 978-617-7751-30-3.
Jansen M (2021) Waldschutzsituation 2020 in Mecklenburg-Vorpommern. [Forest protection situation 2020 in Mecklenburg-Western Pomerania]. AFZ-DerWald 9/21: 51–54. https://www.wald-mv.de/serviceassistent/download?id=1637189. Accessed 17 January 2023.
Jönsson AM, Harding S, Bärring L, Ravn HP (2007) Impact of climate change on the population dynamics of Ips typographus in southern Sweden. Agric For Meteorol 146: 70–81. https://doi.org/10.1016/j.agrformet.2007.05.006.
Jönsson AM, Harding S, Krokene P, Lange H, Lindelöw Å, Økland B, Ravn HP, Schroeder LM (2011) Modelling the potential impact of global warming on Ips typographus voltinism and reproductive diapause. Clim Chang 109: 695–718. https://doi.org/10.1007/s10584-011-0038-4.
Kolb TE, Fettig CJ, Ayres MP, Bentz BJ, Hicke JA, Mathiasen R, Stewart JE, Weed AS (2016) Observed and anticipated impacts of drought on forest insects and diseases in the United States. For Ecol Manage 380: 321–334. https://doi.org/10.1016/j.foreco.2016.04.051.
Komonen A, Schroeder LM, Weslien J (2011) Ips typographus population development after a severe storm in a nature reserve in southern Sweden. J Appl Entomol 135: 132–141. https://doi.org/10.1111/j.1439-0418.2010.01520.x.
Kosunen M, Lyytikäinen-Saarenmaa P, Ojanen P, Blomqvist M, Starr M (2019) Response of soil surface respiration to storm and Ips typographus (L.) disturbance in boreal Norway spruce stands. Forests 10, article id 307. https://doi.org/10.3390/f10040307.
Lehtonen I, Jylhä K (2019) Tendency towards a more extreme precipitation climate in the Coupled Model Intercomparison Project Phase 5 models. Atmos Sci Lett 20, article id e895. https://doi.org/10.1002/asl.895.
Lindelöw Å, Schroeder M (2008) The storm “Gudrun” and the spruce bark beetle in Sweden. Forstschutz Aktuell 44 Sonderheft. https://bfw.ac.at/db/bfwcms.web?dok=7613. Accessed 17 January 2023.
Lindman L, Ranius T, Schroeder M (2023) Regional climate affects habitat preferences and thermal sums required for development of the Eurasian spruce bark beetle, Ips typographus. For Ecol Manage 544, article id 121216. https://doi.org/10.1016/j.foreco.2023.121216.
Marini L, Lindelöw Å, Jönsson AM, Wulff S, Schroeder LM (2013) Population dynamics of the spruce bark beetle: a long‐term study. Oikos 122: 1768–1776. https://doi.org/10.1111/j.1600-0706.2013.00431.x.
Marini L, Økland B, Jönsson AM, Bentz B, Carroll A, Forster B, Grégoire JC, Hurling R, Nageleisen LM, Netherer S, Ravn HP, Weed A, Schroeder M (2017) Climate drivers of bark beetle outbreak dynamics in Norway spruce forests. Ecography 40: 1426–1435. https://doi.org/10.1111/ecog.02769.
Matthews B, Netherer S, Katzensteiner K, Pennerstorfer J, Blackwell E, Henschke P, Hietz P, Rosner S, Jansson PE, Schume H, Schopf A (2018) Transpiration deficits increase host susceptibility to bark beetle attack: experimental observations and practical outcomes for Ips typographus hazard assessment. Agric Forest Meteor 263: 69–89. https://doi.org/10.1016/j.agrformet.2018.08.004.
Metsäkeskus (2022) Metsätuhot. [Forest damages – reports of salvage loggings]. WWW interface of GIS database, Finnish Forest Centre. https://metsakeskus.maps.arcgis.com/apps/dashboards/1ac031022db14461b4ec7256423f3c70. Accessed 16 January 2023.
Nardi D, Jactel H, Pagot E, Samalens JC, Marini L (2022) Drought and stand susceptibility to attacks by the European spruce bark beetle: a remote sensing approach. Agric For Entomol 25: 119–129. https://doi.org/10.1111/afe.12536.
Netherer S, Panassiti B, Pennerstorfer J, Matthews B (2019) Acute drought is an important driver of bark beetle infestation in Austrian Norway spruce stands. Front For Glob Chang 2, article id 39. https://doi.org/10.3389/ffgc.2019.00039.
Neuvonen S, Tikkanen O-P, Pouttu A, Silver T (2015) Kirjanpainajatilanne 2014 ja vertailua aiempiin vuosiin. [Spruce bark beetle situation in in 2014 and comparisons to previous years]. In: Heino E, Pouttu A (eds) Metsätuhot vuonna 2014. Luonnonvara- ja biotalouden tutkimus 39/2015: 16–21. http://urn.fi/URN:ISBN:978-952-326-048-1.
Öhrn P, Långström B, Lindelöw Å, Björklund N (2014) Seasonal flight patterns of Ips typographus in southern Sweden and thermal sums required for emergence. Agric For Entomol 16: 147–157. https://doi.org/10.1111/afe.12044.
Peltola H, Ikonen VP, Gregow H, Strandman H, Kilpeläinen A, Venäläinen A, Kellomäki S (2010) Impacts of climate change on timber production and regional risks of wind-induced damage to forests in Finland. For Ecol Manage 260: 833–845. https://doi.org/10.1016/j.foreco.2010.06.001.
Pouttu A, Annila E (2010) Kirjanpainajalla kaksi sukupolvea kesällä 2010. [Bivoltinism observed in spruce bark beetle in summer 2010]. Metsätieteen aikakauskirja 4/2010: 521–523. https://doi.org/10.14214/ma.6951.
Räisänen J, Räty O (2013) Projections of daily mean temperature variability in the future: cross-validation tests with ENSEMBLES regional climate models. Clim Dyn 46: 339–353. https://doi.org/10.1007/s00382-015-2587-0.
Räty O, Räisänen J, Ylhäisi JS (2014) Evaluation of delta change and bias correction methods for future daily precipitation: intermodal cross-validation using ENSEMBLES simulations. Clim Dyn 42: 2287–2303. https://doi.org/10.1007/s00382-014-2130-8.
Riahi K, Rao S, Krey V, Cho C, Chirkov V, Fischer G, Kindermann G, Nakicenovic N, Rafaj P (2011) RCP8.5 – a scenario of comparatively high greenhouse gas emissions. Clim Change 109: 33–57. https://doi.org/10.1007/s10584-011-0149-y.
Romashkin I, Neuvonen S, Tikkanen O-P (2020) Northward shift in temperature sum isoclines may favour Ips typographus outbreaks in European Russia. Agric For Entomol 22: 238–249. https://doi.org/10.1111/afe.12377.
Ruosteenoja K, Jylhä K, Kämäräinen M (2016a) Climate projections for Finland under the RCP forcing scenarios. Geophysica 51: 17–50. https://www.geophysica.fi/pdf/geophysica_2016_51_1-2_017_ruosteenoja.pdf. Accessed 17 January 2023.
Ruosteenoja K, Räisänen J, Venäläinen A, Kämäräinen M (2016b) Projections for the duration and degree days of the thermal growing season in Europe derived from CMIP5 model output. Int J Climat 36: 3039–3055. https://doi.org/10.1002/joc.4535.
Schiebe C, Hammerbacher A, Birgersson G, Witzell J, Brodelius PE, Gershenzon J, Hansson BS, Krokene P, Schlyter F (2012) Inducibility of chemical defenses in Norway spruce bark is correlated with unsuccessful mass attacks by the spruce bark beetle. Oecologia 170: 183–198. https://doi.org/10.1007/s00442-012-2298-8.
Schroeder M (2019) Granbarkborrens angreppstäthet och förökningsframgång i dödade träd den extremt varma och torra sommaren 2018. [Spruce bark beetle attack frequency and reproductive success in dead trees during the extremely hot and dry summer of 2018]. Arbetsrapport, Sveriges lantbruksuniversitet, SLU. https://www.slu.se/globalassets/ew/org/inst/ekol/rapporter/granbarkborre2019.pdf. Accessed 17 January 2023.
Schroeder M, Dalin P (2017) Differences in photoperiod-induced diapause plasticity among different populations of the bark beetle Ips typographus and its predator Thanasimus formicarius. Agric For Entomol 19: 146–153. https://doi.org/10.1111/afe.12189.
Seidl R, Müller J, Hothorn T, Bässler C, Heurich M, Kautz M (2016) Small beetle, large‐scale drivers: how regional and landscape factors affect outbreaks of the European spruce bark beetle. J Appl Ecol 53: 530–540. https://doi.org/10.1111/1365-2664.1254.
Stakėnas V, Žemaitis P, Ozolinčius R (2012) Crown condition of Norway spruce in different eco-climatic regions of Lithuania: implications for future climate. Balt For 18: 187–195.
Stereńczak K, Mielcarek M, Kamińska A, Kraszewski B, Piasecka Ż, Miścicki S, Heurich M (2020) Influence of selected habitat and stand factors on bark beetle Ips typographus (L.) outbreak in the Białowieża Forest. For Ecol Manage 459, article id 117826. https://doi.org/10.1016/j.foreco.2019.117826.
Taylor KE, Stouffer RJ, Meehl GA (2012) An overview of CMIP5 and the experimental design. Bull Am Meteorol Soc 93: 485–498. https://doi.org/10.1175/BAMS-D-11-00094.1.
Thomson AM, Calvin KV, Smith SJ, Page Kyle G, Volke A, Patel P, Delgado-Arias S, Bond-Lamberty B, Wise MA, Clarke LE, Edmonds JA (2011) RCP4.5: a pathway for stabilization of radiative forcing by 2100. Clim Change 109: 77–94. https://doi.org/10.1007/s10584-011-0151-4.
van Vuuren DP, Edmonds J, Kainuma M, Riahi K, Thomson A, Hibbard K, Hurt GC, Kram T, Krey V, Lamarque, J-F, Masui T, Mainshausen M, Nakicenovic N, Smith SJ, Rose SK (2011a) The representative concentration pathways: an overview. Clim Chang 109: 5–31. https://doi.org/10.1007/s10584-011-0148-z.
van Vuuren DP, Stehfest E, den Elzen MGJ, Kram T, van Vliet J, Deetman S, Isaac M, Klein Goldewijk K, Hof A, Mendoza Beltran A, Oostenrijk R, van Ruijven B (2011b) RCP2.6: exploring the possibility to keep global mean temperature increase below 2°C. Clim Change 109: 95–116. https://doi.org/10.1007/s10584-011-0152-3.
Venäläinen A, Lehtonen I, Laapas M, Ruosteenoja K, Tikkanen O-P, Viiri H, Ikonen V-P, Peltola H (2020) Climate change induces multiple risks to boreal forests and forestry in Finland: a literature review. Glob Chang Biol 26: 4178–4196. https://doi.org/10.1111/gcb.15183.
Viiri H, Viitanen J, Mutanen A, Leppänen J (2019) Metsätuhot vaikuttavat Euroopan puumarkkinoihin – Suomessa vaikutukset toistaiseksi vähäisiä. [Forest damages affect timber market prices in Europe – effects in Finland so far minor]. Metsätieteen aikakauskirja, article id10200. https://doi.org/10.14214/ma.10200.
Wulff S, Roberge S (2020) Inventering av granbarkborreangrepp I Götaland och Svealand 2020. [Inventory of spruce bark beetle outbreaks in Götaland and Svealand 2020]. Arbetsrapport, Sveriges lantbruksuniversitet, SLU. https://pub.epsilon.slu.se/21827/1/wulff_s_et_al_210201.pdf. Accessed 17 January 2023.
Total of 59 references.
