Lauri Männistö  ,
Jari Miina,
Saija Huuskonen
,
Jari Miina,
Saija Huuskonen
How to utilize natural regeneration of birch to establish mixed spruce-birch forests in Finland?
Männistö L., Miina J., Huuskonen S. (2024). How to utilize natural regeneration of birch to establish mixed spruce-birch forests in Finland? Silva Fennica vol. 58 no. 3 article id 23075. https://doi.org/10.14214/sf.23075
Highlights
- Naturally emerging birch admixture provides a sufficient starting point for mixed forest in young, planted spruce stands
- Creating mixed forest is a time sensitive process, as different growth patterns among tree species might cause a situation where one tree species suppresses the other, leading to monoculture or two-storied mixed forest
- Birch admixture should be retained during early cleaning.
Abstract
Mixed forests are known for their ability to provide a wide range of ecosystem services. Such forests have higher biodiversity compared to monocultures, are resilient against disturbances and may mitigate the effects of climate change. Despite well-known benefits, there is still little information on how these forests should be established and managed. The aim of this study was to describe the early growth dynamics of current boreal young mixed stands of planted Norway spruces (Picea abies (L.) Karst.) and naturally regenerated birches (Betula spp.). We collected data from 9 stands planted for spruce 8–14 years ago in Southern and Central Finland. Stem analysis was conducted to 144 spruces and to 144 birches to determine previous growth. We modelled the height and diameter development of individual trees in relation to tree age at stump height using non-linear mixed Chapman-Richards model. There were no significant differences between spruce and seed-origin birch in diameter growth at stump height, but the initial height increments of natural birches were larger than those of planted spruces. However, planted spruces were able to keep up with the height development of birches, if spruces received a head start over naturally regenerated seed-origin birch for two growing seasons. Thus, naturally regenerated birch admixture can be utilized to establish single-storied spruce-birch mixtures, and the admixture should be retained during the early cleaning of planted spruce stands.
Keywords
Betula pendula;
Picea abies;
Betula pubescens;
mixed model;
Chapman-Richards;
mixed stands
-
Männistö,
Natural Resources Institute Finland (Luke), Natural resources, Latokartanonkaari 9, FI-00790 Helsinki, Finland
 https://orcid.org/0009-0009-0213-1972
E-mail
lauri.mannisto@luke.fi
https://orcid.org/0009-0009-0213-1972
E-mail
lauri.mannisto@luke.fi
-
Miina,
Natural Resources Institute Finland (Luke), Natural resources, Yliopistokatu 6 B, FI-80100 Joensuu, Finland
https://orcid.org/0000-0002-8639-4383
E-mail
jari.miina@luke.fi
-
Huuskonen,
Natural Resources Institute Finland (Luke), Natural resources, Latokartanonkaari 9, FI-00790 Helsinki, Finland
https://orcid.org/0000-0001-8630-3982
E-mail
saija.huuskonen@luke.fi
Received 8 December 2023 Accepted 22 April 2024 Published 30 April 2024
Views 64082
Available at https://doi.org/10.14214/sf.23075 | Download PDF

1 Introduction
Forests in Northern Europe are mostly dominated by single-species forests (Bakkebø Fjellstad and Skrøppa 2020; Korhonen et al. 2021; Nilsson et al. 2022). Single-species conifer forests have been favored in the Fennoscandian forestry for decades mainly due to simpler forest management and conifers’ higher economic value and their tendency for less unwanted features, such as bends or forking (Felton et al. 2016; Pukkala 2018; Huuskonen et al. 2021). Currently in southern and central parts of Finland, over 70% of felled stands are regenerated to Norway spruce (Picea abies (L.) Karst.) (from now onwards spruce) (Ruotsalainen et al. 2022). However, due to climate change and increased interest in a high variety of ecosystem services, forestry based on pure stands of spruce might become unfeasible. Homogenic forests have low resilience and resistance against disturbances, which will further increase as a consequence of climate change (Bernier and Schoene 2009; Huuskonen et al. 2021). Disturbance agents caused directly by climate change include extreme weather conditions such as droughts and high winds combined with unfrozen soil (Peltola et al. 1999; Bréda et al. 2006; Ikonen et al. 2017; Krejza et al. 2021). Indirectly caused disturbance agents include the increased abundance of pests and pathogens (Grodzki et al. 2004; Wermelinger 2004; Jönsson et al. 2007; Müller et al. 2012; Temperli et al. 2013; Müller et al. 2014; Seidl et al. 2014). Peltola et al. (2010) predicted a radical decrease of spruce dominated forests especially in southern Finland by the end of the century. Mixed forests have been proposed to mitigate the risks caused by the climate change and to increase the variety of ecosystem services as they usually are more diverse as an ecosystem (Carnus et al. 2006; Felton et al. 2010; Felton et al. 2016; Huuskonen et al. 2021). Spruce-birch (Betula spp.) is the most common mixture in fertile mineral soils in Fennoscandia as both species have similar site requirements and birch naturally regenerates well in juvenile spruce dominated stands, making it tempting alternative to pure spruce stands (Kuusela 1990; Götmark et al. 2005; Kaila et al. 2006; Hynynen et al. 2010; Lee et al. 2023).
Utilizing naturally emerging birch admixture is the key element in shifting from pure spruce stands to mixed spruce-birch stands. In Europe, two different birch species are common: silver birch (Betula pendula Roth) and downy birch (Betula pubescens Ehrh.) (Hynynen et al. 2010; Räty and Vaahtera 2021). Birches are pioneer species specializing in colonizing bare forest sites (Kuusela 1990). Hence, birches, along with other pioneer species, emerge to the stand quickly after soil preparation (Siipilehto et al. 2014). Birches may regenerate naturally either by sprouting from stumps or by seeds from nearby trees (Hynynen et al. 2010). In current single species-oriented forest management, these broadleaf saplings are removed during early cleaning (EC) and pre-commercial thinning (PCT) (Fahlvik et al. 2011; Huuskonen et al. 2021; Ara et al. 2022). Decisions made during the EC and PCT determine the structure and tree species composition of the forest (Fahlvik et al. 2015; Äijälä et al. 2019). Especially on fertile soils, seedling emergence decreases rapidly as a stand ages (Siipilehto et al. 2014). Birch sprouts after the PCT are unable to compete against the established vegetation (Fällman et al. 2003; Holmström et al. 2016b). To establish a spruce-birch mixed forest, an adequate number of birches suitable for crop trees should remain after the PCT (Ara et al. 2022). Nevertheless, PCT is an important measure as it releases space and resources for crop trees (Huuskonen and Hynynen 2006; Huuskonen 2008; Holmström et al. 2016b).
Several aspects advocate for mixed forests. Admixture of tree species with different rooting and growth traits reduces competition (Huuskonen et al. 2021). Birches and spruces differ in their ability to withstand shading and their rooting traits are different (Tertti 1949; Salmi 1977; Kalliokoski et al. 2008; Hynynen et al. 2010). Different traits may even supplement each other: trees in mixed stands can withstand droughts better, as tree species with deep root systems transport water to the top layers by a phenomenon known as hydraulic lift (Zapater et al. 2011; Pretzsch et al. 2014; Cao et al. 2022). However, it is unclear whether hydraulic lift occurs in spruce-birch mixed stands. Especially in Central Europe, admixture of different tree species has also resulted in better growth or overyielding (Pretzsch and Schütze 2009). Yet according to Huuskonen et al. (2021), due to differences in forest management practices between Central and Northern Europe, the density of forests in Northern Europe is lower, resulting in less spatial competition and therefore lack of overyielding. Only few studies comparing the yield of single storied spruce-birch mixed forests to pure spruce stands in boreal Europe have been conducted, and the results are not uniform: some studies report increased growth (Ekö 1985; Mielikäinen 1985; Frivold and Frank 2002), whereas some report decreased growth (Agestam 1985). The benefits of mixed spruce-birch forests are not limited to potentially increasing yield, since increasing the variety of tree species increases the variation of forest owners’ portfolio and hence makes the stand more resistant to fluctuation in timber prices (Felton et al. 2016). By using naturally emerging seedlings, the cost of regeneration is also reduced (Holmström et al. 2016b).
The ability to predict the development of a stand is a crucial element of forest planning (Hynynen 1995). The early development of both spruce and birch has been studied in pure stands (Saksa et al. 2005; Kund et al. 2010). However, as species interact with each other, the dynamics of mixed forests might differ from pure stands. Mielikäinen (1985) studied the development of mixed spruce-birch stands, but the growth of planted spruce has since then improved due to improved silvicultural practices and higher quality seedlings (Koistinen et al. 2016; Sikström et al. 2020; Haapanen 2020). Previously, birches outgrew the spruces causing two-storied forest structure, unless spruces received a head start (Mielikäinen 1985). However, recent studies suggest that due to spruces’ improved height growth, differences between height increments of spruce and birch might be non-significant. Research on mixed spruce-birch forest in Fennoscandia has increased lately (Felton et al. 2016; Holmström et al. 2016a, 2016b, 2021; Dahlgren Lidman et al. 2021; Huuskonen et al. 2021, 2023). However, most of the studies were synthesis reports or emphasized different forest management scenarios for mixed forests. Huuskonen et al. (2023) studied the development of mixed spruce-birch stands approaching the stage of the first commercial thinning, and pointed out the need for research on the structure and growth dynamics of mixed spruce-birch sapling stands before precommercial thinning. Our study aims to meet this need as no study has focused on the early development and growth dynamics of these juvenile mixed stands in boreal Europe.
The goal of this study was to determine the diameter and height growth rates of planted Norway spruces and naturally regenerated birches by assessing past growth of nine well-managed, mixed stands of ages between 8 and 14 years. Naturally regenerated birches included silver and downy birches regenerated either by sprouting from stumps or natural seeds. All species and origin combinations were considered separately. Our hypotheses were as follows. Planting gives spruce enough lead, so spruces will not get suppressed by naturally regenerated birches (H1). Naturally regenerated birches can keep up with planted spruces and hence will not be suppressed (H2). Despite origin or species, birches grow roughly at the same rate and hence all origins and species can be utilized in creating admixture (H3). Based on the results, we discuss the possibility to utilize natural regeneration of birch to establish single-storied, mixed spruce-birch forests.
2 Materials and methods
2.1 Study area
Nine mixed stands of Norway spruce and birches (silver birch and downy birch) were selected in southern and central Finland (Fig. 1, Table 1). Requirements for the stands were as follows: stands were regenerated by spruce planting after mounding, early cleaning was carried out, the admixture of birch was at least 25% of the stem count, stands were juvenile single-storied, and pre-commercial thinning had not yet been performed. Thus, the stands were regenerated and managed according to the current silvicultural recommendations (Äijälä et al. 2019). The recommended timing for early cleaning is when the height of crop trees is approximately one meter (Uotila and Saksa 2014), and precommercial thinning is recommended at the mean height of 3–4 m to the density of about 1800 stems ha−1 (Äijälä et al. 2019).
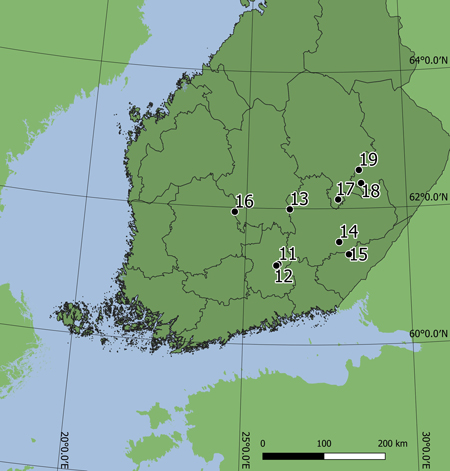
Fig. 1. Locations of nine stands used to study the early development of spruce-birch mixtures. The coordinates of stands varied between 61.162451°–62.56185° north and 24.63745°–28.59488° east. Two plots of 500 m2 were measured in each stand. Stand characteristics are described in Tables 1 and 2.
| Table 1. Basic site information of nine stands used to study the early development of spruce-birch mixtures. Age is time since planting, TS is temperature sum in degree days (dd), EC is early cleaning, and C/N organic and mineral are carbon-nitrate ratio in different layers of soil. Thickness of organic layer is mean thickness of all samples from each stand. | |||||||||
| Stand | Age, years | Planting year | EC year | Site type | TS, dd | Municipality | C/N organic | C/N mineral | Thickness of organic layer, mm |
| 10 | 8 | 2013 | 2017 | OMT | 1371 | Heinola | 23.8 | 21.5 | 8 |
| 12 | 10 | 2011 | 2015 | OMT | 1371 | Heinola | 25.3 | 23.3 | 11 |
| 13 | 9 | 2012 | 2016 | MT | 1235 | Joutsa | 27.6 | 27.1 | 20 |
| 14 | 8 | 2013 | 2017 | MT | 1383 | Puumala | 23.3 | 21.8 | 21 |
| 15 | 8 | 2013 | 2017 | MT | 1403 | Taipalsaari | 19.7 | 19.3 | 23 |
| 16 | 11 | 2010 | 2015 | MT | 1243 | Jämsä | 30.5 | 23.9 | 33 |
| 17 | 14 | 2007 | 2016 | MT | 1256 | Joroinen | 19.8 | 19.6 | 16 |
| 18 | 12 | 2009 | 2016 | MT | 1287 | Heinävesi | 27.4 | 24.9 | 33 |
| 19 | 14 | 2007 | 2014 | MT | 1260 | Leppävirta | 28.8 | 24.3 | 49 |
Stands fulfilling these requirements were searched from the forest resource databases of Metsähallitus, UPM-Kymmene Oyj Forest and Tornator Oyj. The final selection of the studied stands was confirmed on the field. The age of the stands varied between 8–14 years. According to Cajander (1925), the forest type was Myrtillus forest type (MT, fresh site) in seven stands, and Oxalis-Myrtillus type (OMT, herb-rich site) in two stands. All stands were growing on mineral soils.
2.2 Data collection
On each stand, two circular sample plots of 500 m2 were established in 2021. The locations of the plots were determined by fitting the longest possible line within a stand and placing plots along the line so that they divided the line into three equal parts. However, the plots were not established within 25 m from the stand border to avoid edge effect. There could not be any deviances, such as ditches, large boulders, gaps, or logging roads inside the sample plot. If the plot could not be established into a predetermined location for the reasons stated above, it was moved to closest suitable spot. The search for a suitable spot started from northward proceeding in a clockwise spiral form. A total of 18 plots was measured on nine stands.
On each plot, diameter at breast height (DBH), height and location of all crop trees were measured. In addition, tree species, origin (planted, seed, sprout), possible damage agents and characteristics lowering external quality were recorded (Vuokila 1987). Crop tree was defined as one that can compete against surrounding trees and thus has potential to achieve economic significance in the future. On each plot, 16 crop trees were selected as sample trees. Of the sample trees, 8 were spruces and 8 birches. Sample trees were chosen by dividing the diameter distribution weighted by basal area into four parts and picking two trees by random out of each part. This was performed to spruces and birches separately. Even though sample trees were picked by random, no significant characteristics lowering their quality were allowed.
Sample trees were cut down and further measurements were conducted. The annual height increments of sample-tree spruces were determined by measuring the distance from the top to each branch whorl. For birches, the annual height increments during last growing seasons were determined based on terminal bud scars. At least three completed annual height increments were measured from the top of birches; more if possible. To estimate the height development of birches at the lower part of the stem, the age of birches was determined from increment core samples collected at stump height, breast height (1.3 m), 4 m and 6 m. However, if the tree had reached the height of 4 m or 6 m during the last three whole growing seasons, core sample was not collected at that height as the annual height increments were already measured utilizing bud scars. Using the method of Carmean (1972) and Machado et al. (2010), annual height increments were assumed to be constant between two adjacent core samples, and the core sample was collected at the middle of annual height growth. This method provides two estimates for each height a core sample is collected (1.3 m, 4 m, and 6 m). At these heights, an average of these estimates was used.
On each sample plot of 500 m2, ten samples of organic layer and mineral soil were collected using a steel auger (diameter 5.8 cm). Samples were collected systematically: two from the immediacy of the center point and the rest from the cardinal and half-cardinal points 8 m from the center point. The samples were divided into two plastic bags, one for organic and one for mineral soil samples. The bags were stored open in room temperatures and were closed only during transport from forest to laboratory and when stored in near-freezing conditions. The soil type of the mineral soil samples was defined. The pH and content of carbon and nitrogen were assessed separately for the organic (fibric and humic layer, litter excluded) and mineral layers.
2.3 Data analyses
Using the KPL software (Heinonen 1994) and measurements on crop trees, stand characteristics such as stem number, stand basal area and volume, mean height and DBH, and dominant height (by 100 thickest trees ha−1) were calculated separately for each tree species and origin on each plot (two plots per stand). Stand-level characteristics were obtained by averaging plot-level characteristics. Stem number, stand basal area and volume were calculated as arithmetic mean of plots within stand, while the average values of mean height and DBH were calculated as stem number weighted means.
Carbon-nitrogen ratio was assumed to describe site fertility in more details than site type classification. The ratio was calculated separately for organic and mineral layers. Low carbon-nitrogen ratio suggests high fertility and vice versa (Helmisaari et al. 2007; Högberg et al. 2017). Another important stand characteristic is the temperature sum, as low temperatures often limit the productivity of an ecosystem in boreal forests (Kauppi and Posch 1985; Tamminen 1993). The temperature sum was calculated for each plot as an average of a 30-year period (1981–2010) in degree days. The temperature sum was estimated based on the longitude, latitude and elevation of the stand. The temperature sum was estimated from 10 × 10 km grid data (Venäläinen et al. 2005). The threshold for temperature sum accumulation was +5 °C as day mean temperature of 5 °C is generally considered and often used as the limit of a growth period (Solantie 2004; Szyga-Pluta and Tomczyk 2019; Aalto et al. 2022).
Differences among the plot-level characteristics were tested by performing analyses of variance. First, a linear model was created where tree species (Norway spruce, silver birch and downy birch), origin (planted, seed and sprout) and stand were used as independent variables. Then, analysis of variance was carried out using the Anova function in the R package stats (R Core Team 2023). Differences of mean height, mean DBH, stand basal area and volume, stem number and dominant height among tree species and origins as well as stands were tested. Bonferroni correction was used to adjust the p-values.
Linear mixed effect models were fitted for tree-level variables to analyze differences between all tree species and origins. The tree variables were age, under-bark stump diameter (DSH), height and mean 4-year increments of height and DSH. For three small sample trees, 4-year DSH increment was not recorded. In such cases, mean DSH increments were calculated from a shorter time period. There were three trees where no DSH increments were recorded, and they were hence excluded from the model. In the model, tree species and origin were used as fixed effects. Due to the hierarchical data structure, stand and plot were random effects. The models were fitted using the lme function in the R package nlme (Pinheiro et al. 2022). Comparisons among the tree species and origins were made using the emmeans function in the R package emmeans (Lenth 2022). Differences between mean values and whether the differences were statistically significant at 95% confidence level (p < 0.05) were reported. The p-values were adjusted using the Bonferroni method. Analyses were performed to all sample trees and to dominant sample trees separately. The four sample trees with the largest DSH by tree species on each plot were determined as the dominant sample trees.
Tree-level DSH and height development of each tree species and origin were analyzed using sigmoid growth functions (Hall and Bailey 2001). Diameter and height growth were analyzed as a function of tree age at the stump height. An artificial time series of tree development was created by examining the past annual height and diameter growth of the sample trees. This enabled examining the dimensions of individual trees at different points of time. The stump height variables (diameter and age) were used instead of the breast height ones to also cover the earlier development of the trees.
A general Chapman-Richards growth model was used to predict the dimensional development of individual trees through time (Fang et al. 2001; Hall and Clutter 2004). The models were created using the nlme function in the R package nlme (Pinheiro et al. 2022).

yijkt represents the under-bark diameter at stump height (mm) or the height (m) for tree i located in plot j within stand k at a specific age t. Variable age refers to the age of the tree when measured at stump height. Tref is a constant reference age. β1, β2, and β3 are parameters. Parameter β1 represents the expected diameter at stump height or tree height when the tree is at the reference age Tref. β2 and β3 determine the growth rate and shape of the growth curve. These parameters were allowed to vary among different tree species and origins by incorporating fixed effects specific to each species and origin and to be linearly dependent to the site characteristics: the carbon-nitrogen ratio and temperature sum. Initially, all parameters β were considered random variables at different levels (stand, plot, tree). However, due to issues with the nonconvergence of the estimation procedure, the model’s complexity had to be simplified. As a result, only β1 and β3 remained as mixed-effect parameters at stand, plot and tree levels. The random effects associated with β1 and β3, which were assumed to follow a normal distribution, were correlated within the same level, with a mean of 0and constant variances, i.e., bivariate normal distributions for both the stand-, plot-, and tree-specific random effects were assumed. Random errors within trees (e) followed a normal distribution with a mean of 0and a constant variance. Heteroscedasticity of error variances across different tree species and origins was observed using Levene’s test, and to account for this, error variances were estimated for each specific tree species and origin using a varIdent variance structure. The model’s significance, with these species- and origin-specific error variances, was confirmed through a likelihood-ratio test. A first-order autoregressive error structure was also tested and found non-significant in the diameter and height models. The Chapman-Richards models were separately fitted to all the sample trees and the dominant sample trees.
The spatial distribution of birches and spruces was examined using bivariate L12-function to determine whether the spruces and birches species were truly mixed and not in small separate groups. The function is based on Ripley’s k-function (Ripley 1977). The bivariate k12-function is an extension to the k-function (Lotwick and Silverman 1982). The k12-fuction is transformed to L12-function by taking a square root of the k12-function divided by π (Besag 1977).

where r is an observation distance; N1 is the number of type 1 points (spruces in this case); N2 is the number of type 2 points (birches in this case); kij is a variable that defines the edge correction; and A is the sampling window area (plot in this case).
The function was calculated using the Lcross function in the R package spatstat (Baddeley et al. 2015). An isotropic edge correction method was used to avoid bias from trees near the border of plot (Ripley 1988). L12-function was calculated separately for each plot. The radius varied from 0to 6.32 meters with 1.2 cm intervals. To establish whether the differences between observed and expected values of L12-function were statistically significant, the confidence intervals were calculated based on maximum and minimum values of 999 Monte Carlo simulations at all different radiuses.
3 Results
3.1 Stand level analyses
On the sample stands, there were on average 3011 crop trees ha−1 (range 2340–3920 trees ha−1), of which 57% were spruces, 29% silver birches, 10% downy birches and 5% pines rounded to the nearest whole percent (Table 2). The number of crop tree spruces was on average 1703 ha−1 (range 1380–1980 ha−1), which corresponds to the recommended density of 1600–2000 spruces ha−1 (Äijälä et al. 2019). Spruce planting was successful in most stands, but in three stands (stands 17–19) the number of crop tree spruces was lower than the recommended minimum density. Both sprout- and seed-origin birches were present in all stands. The minimum of 25% birch admixture was found in all stands. The number of crop tree birches was on average 1157 ha−1 (range 760–1820 ha−1).
| Table 2. Characteristics of nine stands used to study the early development of spruce-birch mixtures by tree species and origin. | ||||||||
| Stand | Species | Origin | Stem number, ha−1 | % of stems | Basal area, m2 ha−1 | Mean DBH, cm | Mean height, m | Dominant height, m |
| 11 | all | all | 2930 | 100% | 0.90 | 1.7 | 2.5 | 3.7 |
| Scots pine | seed | 80 | 3% | 0.06 | 2.6 | 2.6 | 3.0 | |
| Norway spruce | planted | 1810 | 62% | 0.56 | 1.8 | 2.2 | 3.4 | |
| Silver birch | seed | 790 | 27% | 0.22 | 1.6 | 2.9 | 4.7 | |
| Silver birch | sprout | 70 | 2% | 0.01 | 1.3 | 2.8 | 3.0 | |
| Downy birch | seed | 170 | 6% | 0.07 | 2.0 | 3.5 | 4.6 | |
| Downy birch | sprout | 10 | 0% | 0 | 1.0 | 2.6 | 2.6 | |
| 12 | all | all | 3320 | 100% | 3.80 | 3.6 | 3.9 | 5.1 |
| Scots pine | seed | 490 | 15% | 0.98 | 4.7 | 3.7 | 5.3 | |
| Norway spruce | planted | 1750 | 53% | 2.29 | 3.9 | 3.8 | 5.8 | |
| Silver birch | seed | 360 | 11% | 0.17 | 2.3 | 3.9 | 5.0 | |
| Silver birch | sprout | 270 | 8% | 0.14 | 2.5 | 4.1 | 4.8 | |
| Downy birch | seed | 130 | 4% | 0.10 | 2.9 | 4.4 | 5.0 | |
| Downy birch | sprout | 320 | 10% | 0.15 | 2.3 | 4.3 | 5.2 | |
| 13 | all | all | 3180 | 100% | 1.02 | 1.7 | 2.6 | 5.1 |
| Scots pine | seed | 60 | 2% | 0.01 | 1.3 | 1.9 | 1.9 | |
| Norway spruce | planted | 1980 | 62% | 0.74 | 1.9 | 2.5 | 4.7 | |
| Silver birch | seed | 240 | 8% | 0.07 | 1.6 | 2.9 | 4.1 | |
| Silver birch | sprout | 660 | 21% | 0.11 | 1.2 | 2.7 | 3.8 | |
| Downy birch | seed | 130 | 4% | 0.08 | 2.2 | 3.4 | 5.2 | |
| Downy birch | sprout | 110 | 3% | 0.01 | 1.1 | 2.7 | 3.0 | |
| 14 | all | all | 3230 | 100% | 1.60 | 2.1 | 2.9 | 5.6 |
| Scots pine | seed | 130 | 4% | 0.09 | 2.8 | 2.6 | 3.1 | |
| Norway spruce | planted | 1760 | 54% | 1.12 | 2.6 | 2.9 | 5.3 | |
| Silver birch | seed | 1070 | 33% | 0.35 | 1.6 | 3.1 | 6.6 | |
| Silver birch | sprout | 220 | 7% | 0.02 | 0.9 | 2.5 | 3.0 | |
| Downy birch | seed | 40 | 1% | 0.02 | 2.0 | 3.6 | 3.6 | |
| Downy birch | sprout | 10 | 0% | 0.01 | 2.1 | 4.5 | 4.5 | |
| 15 | all | all | 3920 | 100% | 2.63 | 2.6 | 3.5 | 5.5 |
| Scots pine | seed | 260 | 7% | 0.49 | 4.4 | 3.3 | 4.8 | |
| Norway spruce | planted | 1840 | 47% | 1.40 | 3.0 | 3.2 | 6.2 | |
| Silver birch | seed | 1130 | 29% | 0.54 | 2.1 | 3.9 | 7.5 | |
| Silver birch | sprout | 510 | 13% | 0.13 | 1.7 | 3.5 | 5.2 | |
| Downy birch | seed | 80 | 2% | 0.05 | 2.6 | 4.9 | 5.1 | |
| Downy birch | sprout | 100 | 3% | 0.03 | 1.7 | 3.8 | 4.5 | |
| 16 | all | all | 3040 | 100% | 3.78 | 3.4 | 3.5 | 5.8 |
| Scots pine | seed | 110 | 4% | 0.10 | 3.0 | 2.5 | 3.1 | |
| Norway spruce | planted | 1950 | 64% | 3.52 | 4.5 | 3.8 | 6.5 | |
| Silver birch | seed | 20 | 1% | 0.01 | 2.2 | 3.9 | 3.9 | |
| Silver birch | sprout | 900 | 30% | 0.13 | 1.3 | 3 | 4.0 | |
| Downy birch | seed | 20 | 1% | 0.02 | 3.4 | 4.9 | 4.9 | |
| Downy birch | sprout | 40 | 1% | 0.01 | 1.5 | 2.8 | 2.8 | |
| 17 | all | all | 2790 | 100% | 4.77 | 4.0 | 4.5 | 9.5 |
| Scots pine | seed | 0 | 0% | 0 | 0 | 0 | 0 | |
| Norway spruce | planted | 1380 | 49% | 3.18 | 5.0 | 4.3 | 7.6 | |
| Silver birch | seed | 220 | 8% | 0.39 | 3.5 | 5.2 | 9.4 | |
| Silver birch | sprout | 320 | 11% | 0.17 | 2.0 | 3.9 | 5.8 | |
| Downy birch | seed | 470 | 17% | 0.75 | 3.9 | 5.4 | 9.5 | |
| Downy birch | sprout | 400 | 14% | 0.29 | 2.4 | 4.1 | 7.4 | |
| 18 | all | all | 2350 | 100% | 5.98 | 5.3 | 5.5 | 7.7 |
| Scots pine | seed | 110 | 5% | 0.24 | 4.8 | 3.9 | 4.8 | |
| Norway spruce | planted | 1400 | 60% | 4.62 | 6.4 | 5.7 | 6.9 | |
| Silver birch | seed | 210 | 9% | 0.52 | 5.2 | 6.8 | 8.5 | |
| Silver birch | sprout | 390 | 17% | 0.45 | 3.4 | 5.2 | 8.2 | |
| Downy birch | seed | 100 | 4% | 0.08 | 3.0 | 4.9 | 5.9 | |
| Downy birch | sprout | 140 | 6% | 0.09 | 2.6 | 4.5 | 5.5 | |
| 19 | all | all | 2340 | 100% | 4.54 | 4.6 | 4.7 | 7.3 |
| Scots pine | seed | 120 | 5% | 0.49 | 6.9 | 4.8 | 5.3 | |
| Norway spruce | planted | 1460 | 62% | 3.61 | 5.5 | 4.9 | 7.5 | |
| Silver birch | seed | 170 | 7% | 0.09 | 2.5 | 4.3 | 5.0 | |
| Silver birch | sprout | 220 | 9% | 0.18 | 3.0 | 4.6 | 6.4 | |
| Downy birch | seed | 120 | 5% | 0.08 | 2.7 | 4.7 | 5.4 | |
| Downy birch | sprout | 250 | 11% | 0.11 | 2.3 | 4.1 | 4.6 | |
Norway spruce had the largest mean DBH (3.8 cm) with a significant difference compared to birch’s mean DBH (1.47–2.54 cm depending on birch species and origin) (Table 3). Within birches, the only significant difference was between seed- and sprout-origin downy birches; otherwise, the differences between species and origins were non-significant. There were no significant differences in mean height among tree species or origin, but the dominant height of spruces and seed-origin silver birches was significantly greater than that of sprout-origin downy birches. Spruce had a significantly larger mean stem number, basal area, and volume than birches, but differences between silver and downy birches were non-significant.
| Table 3. Mean values (mean) and standard deviations (SD) of the plot-level variables of crop trees by tree species and origin on 18 sample plots in 9 stands. Data for the same variable marked with different letters are significantly different (p < 0.05). The significance of tree species, origin effect and stand effect was tested by the analysis of variance. | |||||||||
| Spruce | Silver birch | Downy birch | Effect of species and origin | Effect of stand | |||||
| planted | seed | sprout | seed | sprout | F | p | F | p | |
| Variable | Mean ± SD | Mean ± SD | Mean ± SD | Mean ± SD | Mean ± SD | ||||
| Mean DBH, cm | 3.80 ± 1.72a | 2.37 ± 1.44bc | 1.87 ± 0.85bc | 2.54 ± 1.27b | 1.47 ± 0.96c | 14.09 | <0.001 | 8.02 | <0.001 |
| Mean height, m | 3.67 ± 1.2a | 3.89 ± 1.64a | 3.56 ± 0.95a | 4 ±1.69a | 2.87 ± 1.71a | 2.36 | 0.060 | 5.77 | <0.001 |
| Dominant height, m | 5.31 ± 1.52a | 5.12 ± 2.18a | 4.33 ± 1.52ab | 4.46 ±2.17ab | 3.3 ± 2.13b | 4.60 | 0.002 | 6.37 | <0.001 |
| Basal area, m2 ha−1 | 2.32 ± 1.69a | 0.26 ± 0.24b | 0.15 ± 0.14b | 0.13 ± 0.23b | 0.07 ± 0.11b | 31.35 | <0.001 | 2.20 | 0.036 |
| Stem number, ha−1 | 1646 ± 291a | 468 ± 426b | 393 ± 289bc | 140 ±148c | 153 ± 164c | 87.49 | <0.001 | 0.94 | 0.489 |
| Volume, m3 ha−1 | 7.32 ± 5.8a | 0.92 ± 0.95b | 0.49 ± 0.49b | 0.48 ±0.89b | 0.24 ± 0.39b | 26.46 | <0.001 | 2.42 | 0.022 |
3.2 Tree level analyses
From a total of 288 sample trees measured, 272 trees were used in tree-level analyses. The core samples of five sample trees were destroyed by rot due to poor storage and 11 sample trees were discarded as the core samples revealed them to belong into a previous tree generation and to have been left standing in regeneration cutting. Out of the sample trees used, 50% were spruces (all planted), 35% silver birches (20% seed and 15% sprout-origin) and remaining 15% were downy birches (9% seed and 6% sprout-origin).
Based on tree ages at stump height, sample-tree spruces were older than birches, except for seed-origin downy birches, and sprout-origin birches were the youngest (Table 4). The measured age of sample-tree spruces was on average 1.3 years less than the time since planting. Thus, the tree age measured from the core sample taken at stump height, i.e., above the point of origin was lower than the true age. The core sample was collected using a hand bore, making it impossible to collect the sample at the very bottom of the stem.
| Table 4. Mean values (mean) and standard deviations (SD) of the tree-level variables of the sample trees by tree species and origin. Data for the same variable marked with different letters are significantly different (p < 0.05). F-test based on estimated marginal means shows the significance of the fixed effects of tree species and origin in the mixed effect models estimated for the given variable. DSH = diameter at stump height, iDSH = increment of diameter at stump height, ih = height increment. | |||||||
| Variable | Spruce | Silver birch | Downy birch | F | p | ||
| Planted | Seed | Sprout | Seed | Sprout | |||
| Mean ± SD | Mean ± SD | Mean ± SD | Mean ± SD | Mean ± SD | |||
| All sample trees | N = 136 | N = 55 | N = 42 | N = 25 | N = 16 | 45.20 | <0.001 |
| Age (years) | 9.1 ± 2.0a | 7.5 ± 2.0bc | 5.3 ± 3.3d | 8.3 ± 1.8ab | 6.7 ± 3.3cd | 27.87 | <0.001 |
| DSH (mm) | 48.2 ± 21.5a | 36.9 ± 15.0bc | 34.4 ± 16.9d | 43.7 ± 18.7ab | 26.1 ± 17.8cd | 13.67 | <0.001 |
| Height (cm) | 341 ± 148a | 432 ± 139b | 341 ± 148a | 459 ± 135b | 345 ± 150a | 3.85 | 0.005 |
| Mean iDSH in the last 4 years (mm) | 6.9 ± 2.7a | 6.3 ± 2.6a | 5.7 ± 2.4a | 6.9 ± 3.1b | 5.1 ± 1.8c | 16.34 | <0.001 |
| Mean ih in the last 4 years (cm) | 45.8 ± 17.5ab | 57.7 ± 11.1a | 55 ± 13.5a | 61.1 ± 14.6a | 54.1 ± 12.8b | ||
| Dominant sample trees | N = 73 | N = 42 | N = 22 | N = 23 | N = 12 | ||
| Age (years) | 9.3 ± 2.0a | 7.6 ± 2.1b | 5.8 ± 3.3c | 8.4 ± 1.8ab | 6.9 ± 3.4bc | 24.46 | <0.001 |
| DSH (mm) | 55.8 ± 23.4a | 40.9 ± 15.5b | 29.0 ± 18.5b | 44.1 ± 19.2a | 31.3 ± 18.7ab | 22.76 | <0.001 |
| Height (cm) | 379 ± 160a | 453 ± 137b | 380 ± 149ab | 455 ± 126b | 365 ± 135ab | 6.03 | <0.001 |
| Mean iDSH in the last 4 years (mm) | 7.9 ± 2.9a | 6.9 ± 2.6ab | 6.7 ± 2.4ab | 6.9 ± 3.2ab | 5.8 ± 2.0b | 3.34 | 0.012 |
| Mean ih in the last 4 years (cm) | 49.8 ± 18.5a | 59.4 ± 11.2b | 57.2 ± 14.6ab | 60.8 ± 14.9b | 57.2 ± 13.0ab | 6.06 | <0.001 |
Moreover, spruce had the largest diameter at stump height (DSH) whereas sprout-origin silver birches had the smallest. Seed-origin birches were taller than sprout-origin birches and spruces. The height differences between spruces and sprout-origin birches were non-significant. However, the height distributions of the tree species and origins varied a lot among stands (Fig. 2). Downy birch had the largest and smallest 4 year DSH increments of all tree species: Seed-born saplings were the largest while sprout-born ones were the smallest. Both origins of downy birch had significant difference compared to all other species and origins. There were no significant differences in DSH increments between spruce and silver birch of either origin. The height increments of sprout-origin downy birches were significantly smaller compared to other birches. No other significant height increment differences were observed.
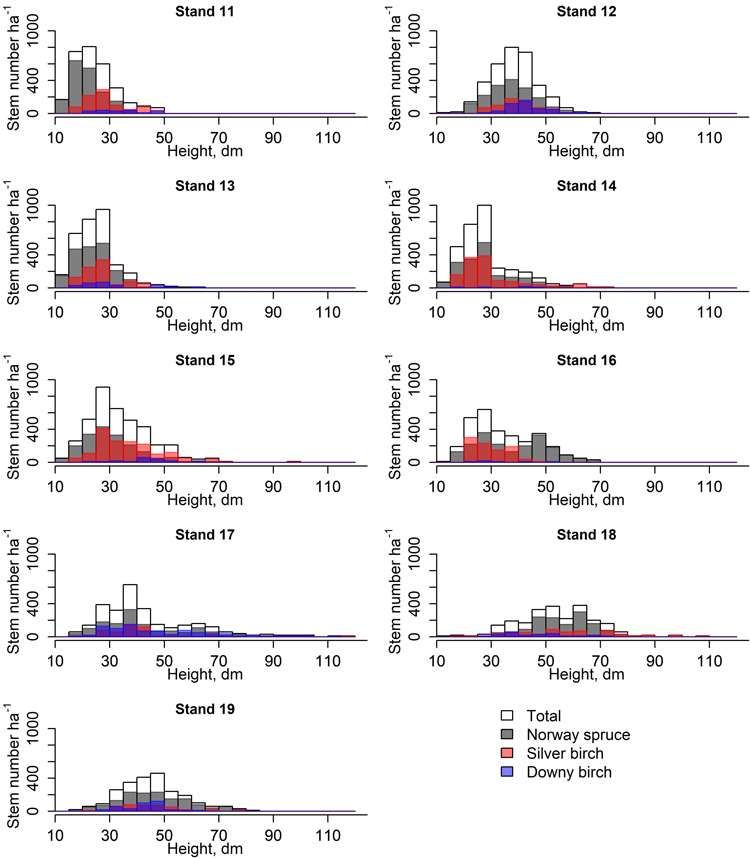
Fig. 2. Height class distribution (5 dm) of spruces and birches in nine stands used to study the early development of spruce-birch mixtures.
When studying the dominant sample trees, the significant difference of ages between different origins of downy birch vanished. The diameter of dominant spruces at stump height was significantly greater compared to dominant birches. The diameter of the dominant sprout-origin silver birch was significantly smaller than that of the seed-origin birches. Dominant seed-origin birches were significantly taller than spruces. Dominant spruces had a significantly greater diameter increments than sprout-origin downy birches. The height increments of dominant seed-origin birches were significantly greater than the height increments of dominant spruces.
3.3 Tree growth dynamics
By the end of the observation period, the stump height diameter growth rate of spruce and downy birch was already slowing down (Fig. 3). Spruce achieved the maximum DSH increment at the age of nine years. The maximum diameter growth rate (inflection point) of spruce was 7.1 mm year−1 at the diameter of 47 mm (all sample trees) or 8.4 mm year−1 at the diameter of 53 mm (dominant sample trees). The highest DSH growth rate of silver birch was 7.4 mm year−1 at the diameter of 69 mm at the end of observation period for all sample trees, and 7.4 mm year−1 at diameter of 57 mm at the age of ten years for dominant silver birches. The maximum DSH growth rate of downy birch was 7.1 mm year−1 at the diameter of 34 mm at the age of 7 years (all sample trees), and 7.2 mm year−1 at the diameter of 33 mm at the age of seven years for dominant downy birches.
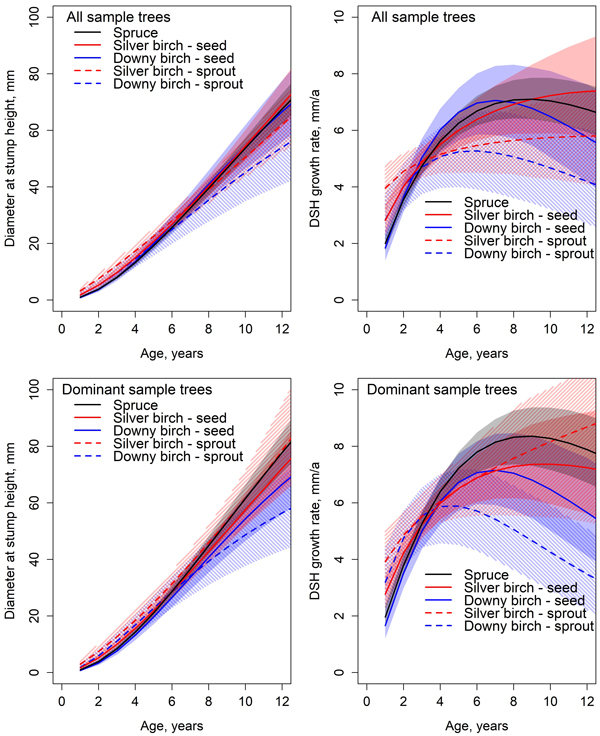
Fig. 3. Predicted development and absolute growth rate of diameter at stump height (DSH) based on the Chapman-Richards type growth models fitted for all sample trees and dominant sample trees. Colored areas indicate 95% confidence bands derived from the estimates and standard errors of the fixed parameters (Table 5). The mean value of C/N ratio in organic layer (25.5) was used in predictions.
Differences of diameter at stump height were statistically non-significant between all tree species at all studied ages (Fig 3.). There were significant differences in the DSH model parameter between species and origins (Table 5). The height model asymptote parameters β1 of all sample trees did not differ between tree species nor origins (Table 6). For dominant sample trees, the asymptote parameter β1 was significantly smaller for sprout-origin downy birch compared to spruces. β2 parameter estimate for silver birch differed statistically significantly from that of spruce and downy birch. There was no significant difference between spruce and downy birch for β2 parameter estimate. Origin did not affect the significance. There were no significant differences between dominant downy birches of different origins. However, they differed significantly from all other tree species. The β2 parameter for sprout origin silver birch differed significantly from all other species and origins of dominant trees. Parameter β3 for dominant sample trees and all sample trees had no significant difference between spruce and downy birch or seed-origin silver birch and sprout-origin downy birch. Between all other estimates, the differences were significant.
| Table 5. Chapman-Richards models (Eq. 1) for under-bark diameter at stump height of all sample trees (8 spruces and 8 birches per plot) and dominant sample trees (4 thickest trees per species and plot). Fitting statistics using only fixed effects are also given. Note: Planted Norway spruce was used as reference. | |||||
| All sample trees | Dominant sample trees | ||||
| Estimate | S.E. | Estimate | S.E. | ||
| Fixed parameter (species) | |||||
| β1 (all species) | 84.5496 | 7.8833 | 111.1110 | 10.4781 | |
| β1 (silver birch, seed-origin) | 0.7415ns | 2.9090 | −4.0413ns | 3.2554 | |
| β1 (downy birch, seed-origin) | 0.6440ns | 3.9894 | −7.1718ns | 4.0967 | |
| β1 (silver birch, sprout-origin) | −3.2092ns | 3.6216 | 0.0857ns | 4.8827 | |
| β1 (downy birch, sprout-origin) | −8.5849ns | 5.0510 | −12.8707 | 5.3436 | |
| β1,C/N organic (all species) | −1.2090 | 0.3019 | −1.9427 | 0.4019 | |
| β2 (all species) | 0.0791 | 0.0048 | 0.0870 | 0.0061 | |
| β2 (silver birch, seed-origin) | −0.0456 | 0.0140 | −0.0309ns | 0.0160 | |
| β2 (downy birch, seed-origin) | 0.0373ns | 0.0198 | 0.0391 | 0.0199 | |
| β2 (silver birch, sprout-origin) | −0.0645 | 0.0168 | −0.0899 | 0.0223 | |
| β2 (downy birch, sprout-origin) | 0.0109ns | 0.0214 | 0.0476 | 0.0222 | |
| β3 (all species) | 1.9984 | 0.0671 | 2.1430 | 0.0900 | |
| β3 (silver birch, seed-origin) | −0.4216 | 0.0940 | −0.4251 | 0.1204 | |
| β3 (downy birch, seed-origin) | 0.2601ns | 0.1766 | 0.2427ns | 0.1903 | |
| β3 (silver birch, sprout-origin) | −0.7730 | 0.0975 | −0.8384 | 0.1378 | |
| β3 (downy birch, sprout-origin) | −0.3200ns | 0.1708 | −0.2966ns | 0.1974 | |
| Random parameters | |||||
| Stand level | sd(β1,k) | -- | corr(β1,k, β3,k) | -- | corr(β1,k, β3,k) |
| sd(β3,k) | -- | -- | -- | -- | |
| Plot level | sd(β1,jk) | 5.6840 | corr(β1,jk, β3,jk) | 7.7010 | corr(β1,jk, β3,jk) |
| sd(β3,jk) | 0.1939 | 0.894 | 0.2376 | 0.877 | |
| Tree level | sd(β1,ijk) | 16.6163 | corr(β1,ijk, β3,ijk) | 14.9734 | corr(β1,ijk, β3,ijk) |
| sd(β3,ijk) | 0.3897 | 0.313 | 1.7595 | 0.264 | |
| Error term | sd(eijk) (spruce) | 1.6002 | 1.7424a | ||
| sd(eijk) (silver birch) | 1.4985 | 1.6261a | |||
| sd(eijk) (downy birch) | 1.9117 | 1.7595a | |||
| Fitting statistics | Random + fixed | Fixed only | Random + fixed | Fixed only | |
| R2 | 99.4% | 77.4% | 99.5% | 82.4% | |
| Bias, mm (Bias%) | 0.02 (0.1%) | −0.11 (−0.5%) | 0.03 (0.1%) | −0.16 (−0.6%) | |
| RMSE, mm (RMSE%) | 1.40 (6.1%) | 8.84 (38.3%) | 1.48 (5.8%) | 8.60 (33.6%) | |
| ns Non-significant at 0.05. a Based on the likelihood-ratio test, the model estimated with different relative variance weights for each tree species was not significantly better than the one assuming homogeneity of variances. | |||||
| Table 6. Chapman-Richards models (Eq. 1) for height of all sample trees (8 spruces and 8 birches per plot) and dominant sample trees (4 thickest trees per species and plot). Fitting statistics using only fixed effects are also given. Note: Planted Norway spruce was used as reference. | ||||
| All sample trees | Dominant sample trees | |||
| Estimate | S.E. | Estimate | S.E. | |
| Fixed parameter (species) | ||||
| β1 (all species) | 716.1577 | 93.2797 | 833.3473 | 111.0242 |
| β1 (silver birch, seed-origin) | 192.5226 | 21.3071 | 172.7279 | 25.3613 |
| β1 (downy birch, seed-origin) | 193.3425 | 29.3316 | 155.9348 | 32.1360 |
| β1 (silver birch, sprout-origin) | 203.5790 | 26.4137 | 212.1720 | 35.7630 |
| β1 (downy birch, sprout-origin) | 147.2801 | 37.8146 | 117.1191 | 43.1173 |
| β1,C/N organic (all species) | −13.6956 | 3.6286 | −16.5793 | 4.3262 |
| β2 (all species) | −0.0741 | 0.0065 | −0.0747 | 0.0085 |
| β2 (silver birch, seed-origin) | −0.0092ns | 0.0197 | −0.0475ns | 0.0251 |
| β2 (downy birch, seed-origin) | −0.1350 | 0.0351 | −0.1878 | 0.0434 |
| β2 (silver birch, sprout-origin) | −0.0689 | 0.0249 | −0.1002 | 0.0347 |
| β2 (downy birch, sprout-origin) | −0.1438 | 0.0419 | −0.1236 | 0.0474 |
| β3 (all species) | 1.0550 | 0.0407 | 1.0390 | 0.0423 |
| β3 (silver birch, seed-origin) | −0.3110 | 0.0520 | −0.3786 | 0.0555 |
| β3 (downy birch, seed-origin) | −0.4628 | 0.0685 | −0.5092 | 0.0673 |
| β3 (silver birch, sprout-origin) | −0.4500 | 0.0565 | −0.4942 | 0.0648 |
| β3 (downy birch, sprout-origin) | −0.5940 | 0.0774 | −0.5385 | 0.0806 |
| Random parameters | ||||
| Stand level | ||||
| sd(β1,k) | 34.8201 | corr(β1,k, β3,k) | 17.8919 | corr(β1,k, β3,k) |
| sd(β3,k) | 0.0759 | −0.166 | 0.0726 | −0.960 |
| Plot level | ||||
| sd(β1,jk) | 42.6272 | corr(β1, jk, β3,jk) | 58.9656 | corr(β1, jk, β3,jk) |
| sd(β3,jk) | 0.0634 | 0.970 | 0.0321 | 0.748 |
| Tree level | ||||
| sd(β1,ijk) | 116.1489 | corr(β1,ijk, β3,ijk) | 111.1361 | corr(β1,ijk, β3,ijk) |
| sd(β3,ijk) | 0.2177 | −0.312 | 0.1675 | −0.204 |
| Error term | ||||
| sd(eijk) (spruce) | 11.9095 | 12.9492 | ||
| sd(eijk) (silver birch) | 22.2558 | 24.2960 | ||
| sd(eijk) (downy birch) | 21.7166 | 22.1014 | ||
| Fitting statistics | Random + fixed | Fixed only | Random + fixed | Fixed only |
| R2 | 98.9% | 65.1% | 98.8% | 69.1% |
| Bias, mm (Bias%) | −0.17 (−0.1%) | 2.13 (1.0%) | −0.23 (−0.1%) | −1.62 (−0.7%) |
| RMSE, mm (RMSE%) | 15.14 (7.0%) | 87.19 (40.9%) | 17.02 (7.2%) | 85.58 (36.0%) |
| ns Non-significant at 0.05. a Based on the likelihood-ratio test, the model estimated with different relative variance weights for each tree species was not significantly better than the one assuming homogeneity of variances. | ||||
The early height development of birch was significantly faster compared to spruce (Fig. 4). Height differences between downy and silver birches were non-significant at all ages. However, spruce’s height growth rate increased with age and by the end of the observation period, there were no significant differences between the height growth rates of silver birch and spruce. Despite the improved height growth, spruce did not reach birch. Especially the height growth rate of downy birch seemed to increase rapidly. The greatest height growth rate of all tree species was achieved at the end of the observation period. The height growth rate of spruce increased annually through the observation period from 24 cm year−1 to 65 cm year−1 at the age of 12 years. At the beginning of the observation period, the annual height increments of silver birch and downy birch were respectively 58 cm year−1 and 48 cm year−1, and by the end of the observation period, 67 cm year−1 and 100 cm year−1.
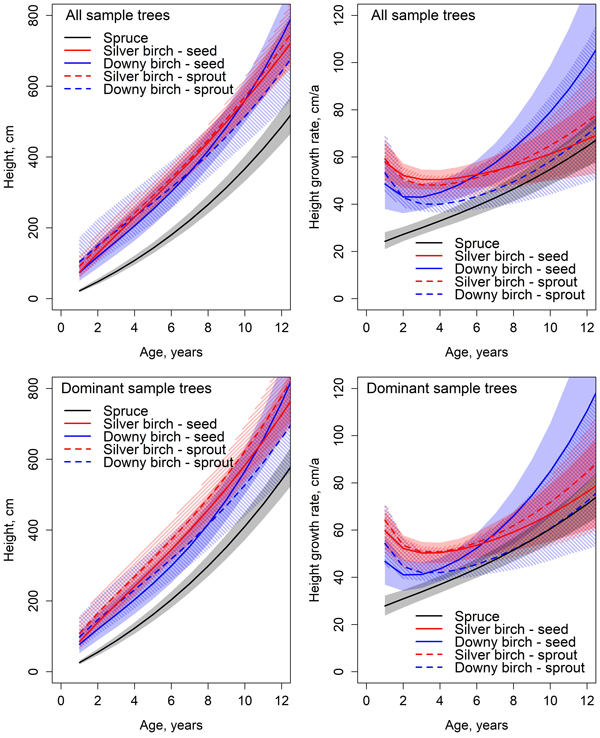
Fig. 4. Predicted development and absolute growth rate of height based on the Chapman-Richards type growth models fitted for all sample trees and dominant trees. Colored areas indicate 95% confidence bands derived from the estimates and standard errors of the fixed parameters (Table 6). The mean value of C/N ratio in organic layer (25.5) was used in predictions.
In the height models, the estimate for parameter β1 for spruce was statistically significantly smaller than the estimates of either birch (Tables 6 and 7). Differences between birches in species and origins were non-significant in parameter β1. The estimates of parameter β2 for spruce and seed-origin silver birch differed significantly from the rest of the birches. The estimates of β2 parameter for spruce and seed-origin silver birch had no significant differences. The estimates for the rest of the birches differed from each other non-significantly. Spruce’s estimate for parameter β3 differed significantly from all birches. The estimate of β3 parameter for seed-origin silver birch differed significantly from spruce and other birches. There were no significant differences between downy birches and sprout-origin silver birches.
| Table 7. Statistically significant differences (p < 0.05) among the species- and origin-specific fixed parameters of Chapman-Richards models (Eq. 1) for under-bark diameter at stump height and height of all sample trees (8 spruces and 8 birches per plot) and dominant sample trees (4 thickest trees per species and plot). Parameter estimates for the same model and parameter marked with different letters are significantly different (p < 0.05). | |||||||
| Model for | Spruce | Silver birch, seed-origin | Downy birch, seed-origin | Silver birch, sprout-origin | Downy birch, sprout-origin | ||
| Diameter at stump height | All sample trees | β1 | a | a | a | a | a |
| β2 | a | b | a | b | a | ||
| β3 | ab | c | b | d | ac | ||
| Dominant sample trees | β1 | a | ab | ac | ad | bcd | |
| β2 | a | a | b | c | b | ||
| β3 | ab | c | b | d | ac | ||
| Height | All sample trees | β1 | a | b | b | b | b |
| β2 | a | a | b | b | b | ||
| β3 | a | b | c | c | c | ||
| Dominant sample trees | β1 | a | b | b | b | b | |
| β2 | a | a | bc | ab | ac | ||
| β3 | a | b | b | b | b | ||
Examining the stand level development by taking different timings of emergence into account, the height differences between seed-origin birches and planted spruces were less than one meter (Fig. 5). Seed-origin birches rapidly overtook planted spruces, but as they aged, the growth rate slowed down and the height difference remained fairly stable. Sprout-origin birches were not able to reach the height of the spruces during the observation period. However, the height difference was less than one meter. The planted spruces were expected to be one year old when planted. The birch seeds were assumed to fall into the stand at the end of the first growing season and to germinate either at the end of the of the first growing season or at the beginning of the 2nd. EC was expected to occur in the early months of 4th growing season after which sprouting from stems occurs. The height differences between tree species during EC were small: at the end of the 3rd growing season, the height of spruce was 108 cm. The heights of seed-born silver and downy birches were 129 cm and 119 cm, respectively.
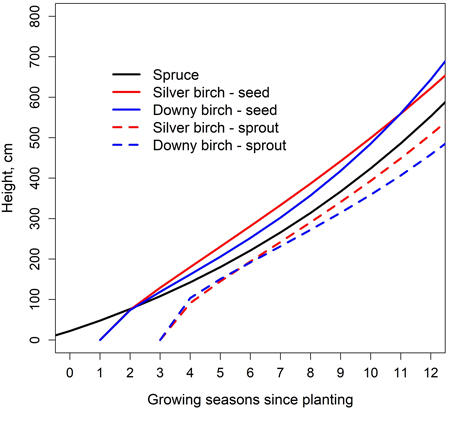
Fig. 5. Simulated height development of Norway spruce, silver birch and downy birch in a mixed spruce-birch stand (Eq. 1, Table 6); carbon-nitrogen ratio of 25.5 was used. Spruce is planted, and birches regenerate naturally from seeds and sprouts. EC is performed at the beginning of 4th growing season after spruce planting.
3.4 Comparing the early growth dynamics
The fitted models were compared to the models created in earlier studies. A faster height growth rate of Norway spruce was reported by Huuskonen et al. (2023). On the other hand, Siipilehto et al. (2014), Elfving (1982), Saksa (2005) and Björkdahl (1983) reported a slower growth rate for Norway spruce (Fig 6) compared to our model. Especially on growth models by Elfving (1982) and Björkdahl (1983), spruce’s height growth rate was remarkably slower compared to our findings. Likewise, the growth of seed-origin birches reported by Elfving (1982) was slower compared to our results. The annual growth of silver birch reported by Huuskonen et al. (2023) was greater than in our findings, whereas the annual growth of downy birch was approximately the same. The predictions of the model created by Björkdahl (1983) depended on the diameter of the stump the saplings are emerging from, but in general, the estimates matched our model (Fig. 6).
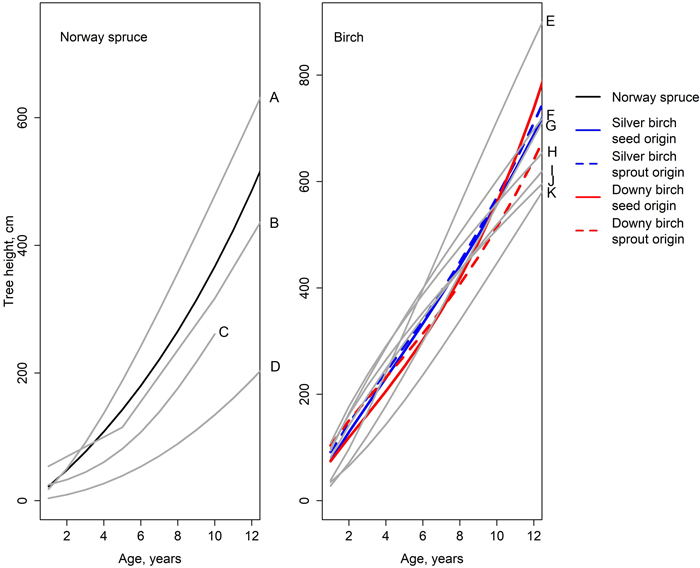
Fig. 6. Height developments simulated by the models of this study (Eq. 1, Table 6); the earlier studies are illustrated with gray lines. A = spruce in a mixed spruce-birch stand (Huuskonen et al. 2023), B = spruce in a pure spruce stand on fresh site (Siipilehto et al. 2014), C = spruce in a pure spruce stand (Saksa et al. 2005), D = spruce in a pure spruce stand (Elfving 1982), E = silver birch in a mixed spruce-birch stand (Huuskonen et al. 2023), F = sprout-origin silver birch, stump diameter 5 cm (Björkdahl 1983), G = downy birch in a mixed spruce-birch stand (Huuskonen et al. 2023), H = sprout-origin downy birch, stump diameter 5 cm (Björkdahl 1983), I = sprout-origin silver birch, stump diameter 2.5 cm (Björkdahl 1983), J = sprout-origin downy birch, stump diameter 2.5 cm (Björkdahl 1983), and K = seed-origin birch (Elfving 1982).
The model describing the development of spruce’s diameter at stump height fits fairly well with the earlier models (Fig. 7). During the first few years, our model estimated slightly a larger DSH than the models created by Huuskonen et al. (2023) and Bianchi et al. (2021). From the age of 10, the model of Huuskonen et al. (2023) estimated a larger DSH than our model. The model created by Bianchi et al. (2021) estimated a smaller diameter through the time period studied. For birch, our model estimated a larger DSH during the first five years than the model by Huuskonen et al. (2023). However, from that point onward until the end of the observation period, all our estimated diameters were smaller than the estimates by Huuskonen et al. (2023). Especially the diameters of sprout-origin birches were lacking behind. The model created by Huuskonen et al. (2023) did not make a difference between the origins of the birch. The smallest difference between the models was that of the seed-origin downy birch.
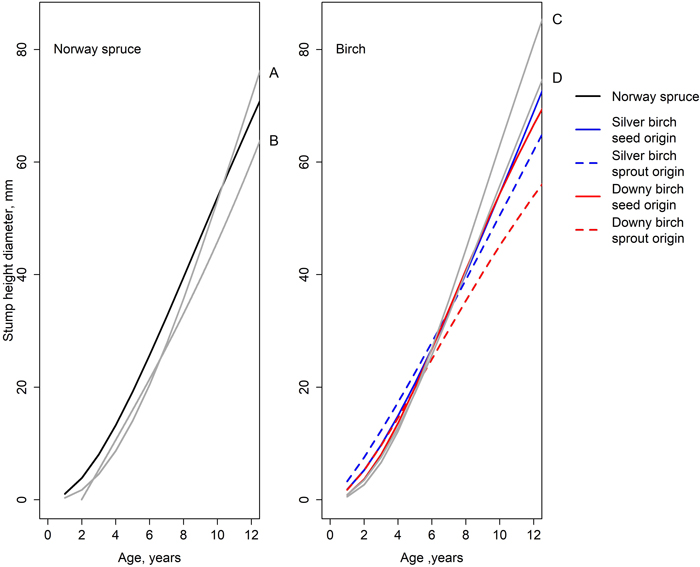
Fig. 7. Development of stump height diameter simulated by the models of this study (Eq. 1, Table 5) and earlier studies: A = spruce in a mixed spruce-birch stand (Huuskonen et al. 2023), B = spruce in a mixed pine-spruce stand (Bianchi et al. 2021), C = silver birch in a mixed spruce-birch stand (Huuskonen et al. 2023), and D = downy birch in a mixed spruce-birch stand (Huuskonen et al. 2023).
3.5 Spatial distribution of spruces and birches
The spatial distribution of birches and spruces was on average random at all observation distances, suggesting the species were truly mixed with each other (Fig. 8). Yet in some stands, spruces and birches were statistically significantly dispersed at short observation distances and more clustered at large observation distances. 2.4% of all observations suggested dispersed and less than 1% clustered distribution. All observations suggesting clustered distribution were at the same plot (Plot 1 of stand 12).
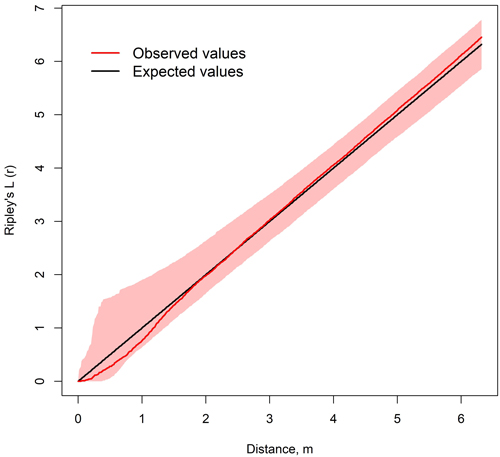
Fig. 8. Average of Ripley’s L12-functions of spruce and birch on 18 sample plots in nine mixed spruce-birch stands. Colored area represents the confidence level of 999 Montecarlo simulations.
4 Discussion
The aim of this study was to examine the species-specific diameter and height developments in young mixed spruce-birch stands. The goal was to describe the spatial and size structure of the mixed stands, determine how species and origin affect the growth rate of trees, and how the growth dynamics change during the first 12 growing seasons after spruce planting.
The current size and spatial structure of the mixed stands enables preservation of birch admixture in PCT. The stem number of admixture birches was high enough and the admixture did not occur in clusters. Thus, the stands were mixed even by stricter definitions (Bravo‐Oviedo et al. 2014). The slight dispersion at small observation distances on some sample plots was most likely caused by soil preparation and planting and by the selection of crop trees, since a minimum distance of 1 meter was required between the crop trees.
Tree-level analyses revealed the spruces to be older and shorter, but thicker than the birches. The results were as expected, as young spruces tend to have a larger DBH than birches of same height (Näslund 1936; Bronisz and Mehtätalo 2020). Rapid height growth is typical for birches (Tham 1994). That is necessary, since birch is a light-demanding tree and thus it must outgrow surrounding trees to survive (Frivold and Frank 2002). The height difference has been recognized in earlier studies, but birches’ lead tends to dwindle as the stands age, and eventually spruce outgrows birch (Mielikäinen 1985; Frivold and Frank 2002; Huuskonen et al. 2023). In this study, the stands were young and therefore the birches still had a larger annual height increments compared to the spruces.
The age differences between birches and spruces were as expected (Table 4). Spruce saplings usually grow for one to two growing seasons at a nursery before planting (Rikala 2012). Therefore, planted spruces may be biologically older than saplings naturally regenerated on the regeneration area. Mielikäinen (1985) reported birches to be older than spruces on average. Yet according to our results, planted spruces were the oldest and seed-origin birches were older than sprout-origin birches. Early cleaning promotes sprouting (Kaila et al. 2006). Hence, as expected, birch sprouts were younger than seed-origin birches. Previous studies have pointed that the number of sprouts is the highest in the first year after a clear cut, and seed-origin birches start to appear 2–3 years thereafter (Hytönen 2020). However, differences in the stand structure of the previous rotation might explain these differences: in pure spruce stands, there are no birch stumps to sprout from. On average, EC was carried out 5 years after establishing the stand. In our data, some sprout-origin crop trees emerged before or after the EC. On average, sprout-origin trees emerged soon after the EC, but the variation between and even within stands was great in some cases. It is possible that our study design favors the sprout-origin trees that have emerged before EC; due to their older age, they have more likely reached the dimensions of a crop tree.
Earlier studies showed that naturally regenerated spruce requires a 12-year advantage over birch to avoid being suppressed to under-story (Mielikäinen 1985). However, more recent studies suggest that modern forest management practices have changed growth dynamics and, hence, planted spruces may form single-story mixed forests with birch emerged at the time of planting (Huuskonen et al. 2023). The height models estimated in this study suggested birches to outgrow spruces during the period considered if all species and origins were equally old. However, as there were age differences between origins, our study supports the results of Huuskonen et al. (2023). Birches do not emerge before the spruces have been established and, therefore, the height development of different species is somewhat equal. Planting gives spruce a head start, which is enough to compete with birches at least until the precommercial thinning. Our height model suggested that when taking assumed age differences between species and origins into account, all different crop tree estimates were within 1.5 m of each other through the observation period (Fig 5). According to Huuskonen et al. (2023), as a stand ages, the height increments of spruce are greater than that of birch, and therefore spruce eventually overtakes birch. Thus, retaining birches slightly taller than spruces during EC may improve the chance of birches not being suppressed during late rotation and therefore promote the mixed structure over a rotation period. The assumed age differences presented (Fig. 5) are dependent on how the stand is managed. The emergence of seed-origin saplings depends on the timing of soil preparation, as successful germination is much more likely if mineral soil is exposed (Luoranen et al. 2019). Hence, a longer time between soil preparation and planting might cause earlier development of seed-origin birches. Likewise, the timing of EC affects the timing of sprouting as EC creates plenty of stumps prone to sprouting (Hytönen 2019).
The height increments of all species were the largest at the end of the observation, suggesting the height increment vertex had not been achieved. These findings are supported by earlier studies. Maximal height growth of Norway spruce in mixed stands has been recorded at the age of 13 (Huuskonen et al. 2023). In addition, results from pure spruce stands support our findings (Elfving 1982; Saksa et al. 2005). The height development of birches differed from earlier results. Our results suggest annual height increments were still growing at the end of the observation period. According to some previous studies, birch reaches its greatest height growth before the age of 10 in both mixed and pure stands (Kund et al. 2010; Huuskonen et al. 2023). According to the height models of Elfving (1982) and Björkdahl (1983), the annual height increments of birch increase through the first 12 growing seasons. The height growth of downy birch is smaller than that of silver birch during the first two years but later increases rapidly. This is contrary to previous studies, where the height difference between spruce and downy birch was small at a young age (Huuskonen et al. 2023). It is worth noticing that in our study the number of sample trees was lower in the older age classes and hence the 95% confidence interval grew as the age increased. This was the case especially with downy birches as the sample size was small to begin with. In addition, it is possible that silver birches have been favored during EC; only the most vigorous downy birches have been retained and therefore they have extraordinarily large height increments. Thus, results considering downy birch include high levels of uncertainty. Generally, our results are in accordance with earlier studies.
Our results suggest that naturally emerging birch admixture no longer overgrows planted Norway spruce, supporting Hypothesis 1, which stated that planting gives Norway spruce enough head start to avoid being suppressed by naturally emerging birch admixture. Our study design does not enable analyzing reasons for the changed dynamics, but we presume the growth of Norway spruce has improved due to modern silviculture and, hence, it can compete with birch. However, timing is crucial. If there is a long gap between clear cut, soil preparation and planting, the risk of birches suppressing spruce saplings increases. The height increments of seed-origin birches are large during the first growing seasons and, hence, there is no risk of being suppressed by spruce saplings if enough vigorous trees are retained during EC. This finding supports Hypothesis 2, which suggested that naturally regenerated birch can keep up with planted spruce and, hence, will not be suppressed. The height development of birch is similar in all origin and species combinations. Our data and previous studies suggest sprouting to occur after early cleaning. Therefore, sprout-origin birches are suppressed since emergence, and they cannot reach the height of established vegetation. However, we are not able to determine whether this height difference is fatal for sprout-origin trees in the long run. Hence, we reject Hypothesis 3, which stated that birches grow roughly at the same rate despite different origins and species. If the sprout-origin birches can withstand the slight suppression or have adequate growing space, they may be utilized to promote admixture.
When comparing the estimated height growth to earlier models, some differences emerged. Especially when modeling the height growth of spruce, the newer models estimated noticeably faster early growth. The improved growth rate can be explained by improved soil preparation methods and tree breeding as noted in several studies (Heiskanen 2005; Saksa et al. 2005; Luoranen and Kiljunen 2006; Saksa 2011; Haapanen 2020). However, Huuskonen et al. (2023) predicted even faster height growth than ours, which could have been caused by differences of data: their data consisted of trees aged 17–29 years and, hence, the model might have estimated the early development less accurately. In addition, when comparing the Huuskonen et al.’s (2023) height model of all sample trees to our height model of dominant sample trees, the differences are small. Therefore, it is probable that our model of all sample trees includes slower growing trees, which will be removed during PCT, whereas the model by Huuskonen et al. (2023) only included the best trees left standing after PCT.
The number of previous studies explaining the development of DSH by the function of age is low and, therefore, there is little data to compare our findings to. All comparison models focus on the later development of stand and may therefore describe early development inaccurately. Yet, their estimates do not differ radically from the estimates provided by our model. Huuskonen et al. (2023) do not provide separate models for different origins of silver and downy birches nor report the origin of sample trees and, therefore, accurate comparison impossible.
Overall, there are no prominent differences between the comparison models and ours, suggesting that the models created are in line with previous studies. This indicates that we successfully described the development of mixed stands consisting of planted spruce and naturally regenerated silver and downy birches with varying origin. The models were created to describe the development of selected stands and it should not be used as a tool to simulate the development of other stands. Our results suggest that retaining natural regenerated birch admixture in early clearing provides a good basis for a mixed forest structure.
Due to the limitations of our study design, we do not know the stand structure prior to EC and therefore have no information on the properties of the trees removed. However, if EC has been carried out according to recommendations, the trees posing the greatest threat to crop trees (i.e. the most vigorous birches) have been removed (Äijälä et al. 2019). In such case, our model might slightly underestimate the height development of birch compared to a situation where the trees removed during EC were chosen by random. Therefore, the results should only be applied to stands where the early management has been carried out following current recommendations.
5 Conclusions
Our results suggest that to create mixed spruce-birch stand, naturally emerging birch admixture should be retained during the early management. Depending on the timing of early cleaning, sprout-origin trees might end up being suppressed by spruces and therefore it is uncertain whether they can be utilized in an admixture. After EC, the heights of birch and spruce should be approximately the same, perhaps birches slightly taller. We did not observe spruces suppressed by birches. The annual height increments of birches were larger but due to age differences, the height differences were small through the study period of first 12 growing seasons after sprucer planting. Yet, the importance of timing of silvicultural measures, especially of soil preparation, should be highlighted, since the successful early development dynamics depend greatly on age differences between tree species. Our findings support the proposal that natural birch admixture can be used to supplement planted spruce stands and to create single-storied mixed stands. Further research is needed to investigate how height differences between spruces and birches during EC affect the growth patterns over the whole rotation. Another topic, which requires further attention, is the density and admixture proportion of mixed forests needed to fulfill sustainable and multifunctional forest management goals.
Authors’ contributions
Conceptualization (SH, LM, JM), data curation (LM, SH, JM), data analysis (LM, JM, SH), original draft preparation (LM), writing (LM, SH, JM), project administration (SH). All authors have read and agreed to the published version of the manuscript.
Acknowledgements
We would like to thank Metsähallitus, UPM-Kymmene Oyj Forest and Tornator Oyj for providing the mixed stands for the study. We would also like to thank the field measurement groups, especially Henri Jakovuori, and Joel Saarinen, Sauli Räihä and Janne Heikkinen. We are grateful for Kati Tammela for increment core analysis and laboratory staff for soil sample analysis. We also thank Olivia Eckstein for reviewing the wording and grammar of this article.
Funding
This work was supported by the Ministry of Agriculture and Forestry in Finland, through the project Forest management regimes of mixed forest – SEKAVA, grant no. VN/6837/2020 (Catch the Carbon -program).
Declaration of openness of research materials, data, and code
Data available on request from the corresponding author.
References
Aalto J, Pirinen P, Kauppi PE, Rantanen M, Lussana C, Lyytikäinen-Saarenmaa P, Gregow H (2022) High-resolution analysis of observed thermal growing season variability over northern Europe. Clim Dyn 58: 1477–1493. https://doi.org/10.1007/s00382-021-05970-y.
Agestam E (1985) En produktionsmodell för blandbestånd av tall, gran och björk i Sverige. [Production model for mixed forests of pine, spruce and birch in Sweden]. Rapport nr 15, Sveriges Lantbruksuniversitet, Institutionen för Skogsproduktion. ISBN 978-91-576-2528-1.
Äijälä O, Koistinen A, Sved J, Vanhatalo K, Väisänen P (eds) (2019) Metsänhoidon suositukset. [Silvicultural recomendations]. Tapion julkaisuja. ISBN 978-952-5632-75-0.
Ara M, Berglund M, Fahlvik N, Johansson U, Nilsson U (2022) Pre-commercial thinning increases the profitability of Norway spruce monoculture and supports Norway spruce–birch mixture over full rotations. Forests 13, article id 1156. https://doi.org/10.3390/f13081156.
Baddeley A, Rubak E, Turner R (2015) Spatial point patterns: methodology and applications with R. Chapman and Hall/CRC Press, London. https://doi.org/10.1201/b19708.
Bakkebø Fjellstad K, Skrøppa T (2020) State of forest genetic resources in Norway 2020. Norwegian Genetic Resource Centre, NIBIO report 6/167. ISBN 978-82-17-02709-6.
Bernier P, Schoene D (2009) Adapting forests and their management to climate change: an overview. Unsylva 60: 5–11.
Besag J (1977) Discussion on Dr Ripleys paper. J R Stat Series B 39: 193–195. https://doi.org/10.1111/j.2517-6161.1977.tb01616.x.
Bianchi S, Huuskonen S, Hynynen J, Oijala T, Siipilehto J, Saksa T (2021) Development of young mixed Norway spruce and Scots pine stands with juvenile stand management in Finland. Scand J For Res 36: 374–388. https://doi.org/10.1080/02827581.2021.1936155.
Björkdahl G (1983) Höjdutveckling hos stubbskott av vårt- och glasbjörk samt tall och gran efter mekanisk röjning. [Height development of sprout born silver and downy birch, spruce and pine after mechanical clearing]. Stencil nr 18, Sveriges lantbruksuniversitet, Institutionen för skogsproduktion.
Bravo‐Oviedo A, Pretzsch H, Ammer C, Andenmatten E, Barbati A, Barreiro S, Brang P, Bravo F, Coll L, Corona P, Ouden J den, Ducey MJ, Forrester DI, Giergiczny M, Jacobsen JB, Lesiński J, Löf M, Mason B, Matović B, Metslaid M, Morneau F, Motiejūnaitė J, Pach M, Ponette Q, Río M del, Short I, Skovsgaard JP, Soliño M, Spathelf P, Sterba H, Stojanović DB, Střelcová K, Svoboda M, Verheyen K, Lüpke N von, Zlatanov T (2014) European mixed forests: definition and research perspectives. For Syst 23: 518–533. https://doi.org/10.5424/fs/2014233-06256.
Bréda N, Huc R, Granier A, Dreyer E (2006) Temperate forest trees and stands under severe drought: a review of ecophysiological responses, adaptation processes and long-term consequences. Ann For Sci 63: 625–644. https://doi.org/10.1051/forest:2006042.
Bronisz K, Mehtätalo L (2020) Mixed-effects generalized height–diameter model for young silver birch stands on post-agricultural lands. For Ecol Manag 460, article id 117901. https://doi.org/10.1016/j.foreco.2020.117901.
Cao J, Liu H, Zhao B, Peng R, Liang B, Anenkhonov OA, Korolyuk AYu, Sandanov DV (2022) Mixed forest suffered less drought stress than pure forest in southern Siberia. Agric For Meteorol 325, article id 109137. https://doi.org/10.1016/j.agrformet.2022.109137.
Carnus J-M, Parrotta J, Brockerhoff E, Arbez M, Jactel H, Kremer A, Lamb D, O’Hara K, Walters B (2006) Planted forests and biodiversity. J For 104: 65–77. https://doi.org/10.1093/jof/104.2.65.
Dahlgren Lidman F, Holmström E, Lundmark T, Fahlvik Nils (2021) Management of spontaneously regenerated mixed stands of birch and Norway spruce in Sweden. Silva Fenn 55, article id 10485. https://doi.org/10.14214/sf.10485.
Ekö PM (1985) En produktionsmodell för skog i Sverige, baserad på bestånd från riksskogstaxeringens provytor. [A growth simulator for Swedish forests, based on data from the national forest survey]. Rapporter nr 16, Swedish University of Agricultural Sciences, Department of Silviculture, Umeå. ISBN 978-91-576-2386-7.
Elfving Björn (1982) HUGIN’s ungskogstaxering 1976–1979. [HUGIN young forest calculations 1976–1979]. Rapport nr 27, Projekt HUGIN, Sveriges lantbruksuniversitet, Skogsvetenskapliga fakulteten, Umeå.
Fahlvik N, Agestam E, Ekö PM, Lindén M (2011) Development of single-storied mixtures of Norway spruce and birch in Southern Sweden. Scand J For Res 26: 36–45. https://doi.org/10.1080/02827581.2011.564388.
Fahlvik N, Ekö PM, Petersson N (2015) Effects of precommercial thinning strategies on stand structure and growth in a mixed even-aged stand of Scots pine, Norway spruce and birch in southern Sweden. Silva Fenn 48, article id 1302. https://doi.org/10.14214/sf.1302.
Fällman K, Ligné D, Karlsson A, Albrektson A (2003) Stem quality and height development in a Betula-dominated stand seven years after precommercial thinning at different stump heights. Scand J For Res 18: 145–154. https://doi.org/10.1080/02827580310003713.
Fang Z, Bailey RL, Shiver BD (2001) A multivariate simultaneous prediction system for stand growth and yield with fixed and random effects. For Sci 47: 550–562. https://doi.org/10.1093/forestscience/47.4.550.
Felton A, Lindbladh M, Brunet J, Fritz Ö (2010) Replacing coniferous monocultures with mixed-species production stands: an assessment of the potential benefits for forest biodiversity in northern Europe. For Ecol Manag 260: 939–947. https://doi.org/10.1016/j.foreco.2010.06.011.
Felton A, Nilsson U, Sonesson J, Felton AM, Roberge J-M, Ranius T, Ahlström M, Bergh J, Björkman C, Boberg J, Drössler L, Fahlvik N, Gong P, Holmström E, Keskitalo EC, Klapwijk MJ, Laudon H, Lundmark T, Niklasson M, Nordin A, Pettersson M, Stenlid J, Sténs A, Wallertz K (2016) Replacing monocultures with mixed-species stands: ecosystem service implications of two production forest alternatives in Sweden. Ambio 45: 124–139. https://doi.org/10.1007/s13280-015-0749-2.
Frivold LH, Frank J (2002) Growth of mixed birch-coniferous stands in relation to pure coniferous stands at similar sites in south-eastern Norway. Scand J For Res 17: 139–149. https://doi.org/10.1080/028275802753626782.
Götmark F, Fridman J, Kempe G, Norden B (2005) Broadleaved tree species in conifer-dominated forestry: regeneration and limitation of saplings in southern Sweden. For Ecol Manag 214: 142–157. https://doi.org/10.1016/j.foreco.2005.04.001.
Grodzki W, McManus M, Knı́žek M, Meshkova V, Mihalciuc V, Novotny J, Turčani M, Slobodyan Y (2004) Occurrence of spruce bark beetles in forest stands at different levels of air pollution stress. Environ Pollut 130: 73–83. https://doi.org/10.1016/j.envpol.2003.10.022.
Haapanen M (2020) Performance of genetically improved Norway spruce in one-third rotation-aged progeny trials in southern Finland. Scand J For Res 35: 221–226. https://doi.org/10.1080/02827581.2020.1776763.
Hall DB, Bailey RL (2001) Modeling and prediction of forest growth variables based on multilevel nonlinear mixed models. For Sci 47: 311–321. https://doi.org/10.1093/forestscience/47.3.311.
Hall DB, Clutter M (2004) Multivariate multilevel nonlinear mixed effects models for timber yield predictions. Biometrics 60: 16–24. https://doi.org/10.1111/j.0006-341X.2004.00163.x.
Heinonen J (1994) KPL – koealojen puu- ja puustotunnusten laskentaohjelman käyttöohje. [User’s manual for KPL- computer programme for computing stand and single tree charastersetics from sample plot measurements]. Metsäntutkimuslaitoksen tiedonantoja 504. http://urn.fi/URN:ISBN:951-40-1369-7.
Heiskanen J (2005) Jurovatko kuusentaimet? [Are spruce spalings stagnateing?]. Taimiuutiset 8: 4–5. http://urn.fi/URN:NBN:fi-metla-201211066696.
Helmisaari H-S, Derome J, Nöjd P, Kukkola M (2007) Fine root biomass in relation to site and stand characteristics in Norway spruce and Scots pine stands. Tree Physiol 27: 1493–1504. https://doi.org/10.1093/treephys/27.10.1493.
Högberg P, Näsholm T, Franklin O, Högberg MN (2017) Tamm review: on the nature of the nitrogen limitation to plant growth in Fennoscandian boreal forests. For Ecol Manag 403: 161–185. https://doi.org/10.1016/j.foreco.2017.04.045.
Holmström E, Hjelm K, Johansson U, Karlsson M, Valkonen S, Nilsson U (2016a) Pre-commercial thinning, birch admixture and sprout management in planted Norway spruce stands in South Sweden. Scand J For Res 31: 56–65. https://doi.org/10.1080/02827581.2015.1055792.
Holmström E, Hjelm K, Karlsson M, Nilsson U (2016b) Scenario analysis of planting density and pre-commercial thinning: will the mixed forest have a chance? Eur J Forest Res 135: 885–895. https://doi.org/10.1007/s10342-016-0981-8.
Holmström E, Carlström T, Goude M, Lidman FD, Felton A (2021) Keeping mixtures of Norway spruce and birch in production forests: insights from survey data. Scand J For Res 36: 155–163. https://doi.org/10.1080/02827581.2021.1883729.
Huuskonen S (2008) Nuorten männiköiden kehitys: taimikonhoito ja ensiharvennus. [Development of young pine stands: early management and precomercial thinning]. Diss For 62. https://doi.org/10.14214/df.62.
Huuskonen S, Hynynen J (2006) Timing and intensity of precommercial thinning and their effects on the first commercial thinning in Scots pine stands. Silva Fenn 40: 645–662. https://doi.org/10.14214/sf.320.
Huuskonen S, Domisch T, Finér L, Hantula J, Hynynen J, Matala J, Miina J, Neuvonen S, Nevalainen S, Niemistö P, Nikula A, Piri T, Siitonen J, Smolander A, Tonteri T, Uotila K, Viiri H (2021) What is the potential for replacing monocultures with mixed-species stands to enhance ecosystem services in boreal forests in Fennoscandia? For Ecol Manag 479, article id 118558. https://doi.org/10.1016/j.foreco.2020.118558.
Huuskonen S, Lahtinen T, Miina J, Uotila K, Bianchi S, Niemistö P (2023) Growth dynamics of young mixed Norway spruce and birch stands in Finland. Forests 14, article id 56. https://doi.org/10.3390/f14010056.
Hynynen J (1995) Modelling tree growth for managed stands. Metsäntutkimuslaitoksen tiedonantoja 576. http://urn.fi/URN:ISBN:951-40-1480-4.
Hynynen J, Niemistö P, Viherä-Aarnio A, Brunner A, Hein S, Velling P (2010) Silviculture of birch (Betula pendula Roth and Betula pubescens Ehrh.) in northern Europe. Forestry 83: 103–119. https://doi.org/10.1093/forestry/cpp035.
Hytönen J (2019) Stump diameter and age affect coppicing of downy birch (Betula pubescens Ehrh.). Eur J For Res 138: 345–352. https://doi.org/10.1007/s10342-019-01175-5.
Hytönen J (2020) Development of downy birch (Betula pubescens Ehrh.) Coppice Stands during Nine Years. Forests 11, article id 958. https://doi.org/10.3390/f11090958.
Ikonen V-P, Kilpeläinen A, Zubizarreta-Gerendiain A, Strandman H, Asikainen A, Venäläinen A, Kaurola J, Kangas J, Peltola H (2017) Regional risks of wind damage in boreal forests under changing management and climate projections. Can J For Res 47: 1632–1645. https://doi.org/10.1139/cjfr-2017-0183.
Jönsson AM, Harding S, Bärring L, Ravn HP (2007) Impact of climate change on the population dynamics of Ips typographus in southern Sweden. Agric For Meteorol 146: 70–81. https://doi.org/10.1016/j.agrformet.2007.05.006.
Kaila S, Kiljunen N, Miettinen A, Valkonen S (2006) Effect of timing of precommercial thinning on the consumption of working time in Picea abies stands in Finland. Scand J For Res 21: 496–504. https://doi.org/10.1080/02827580601073263.
Kalliokoski T, Nygren P, Sievänen R (2008) Coarse root architecture of three boreal tree species growing in mixed stands. Silva Fenn 42: 189–210. https://doi.org/10.14214/sf.252.
Kauppi P, Posch M (1985) Sensitivity of boreal forests to possible climatic warming. Clim Change 7: 45–54. https://doi.org/10.1007/BF00139440.
Koistinen A, Käär L, Päivänen R (2016) Metsäntutkimus tehokkaammin käyttöön. Metsätiedepaja–konsepti ja sen toteutus aiheesta Metsänjalostuksen kannattavuus. [Forest research to practise. Forest research workshop -concept and in practise]. Tapion raportteja 13. ISBN 978-952-5632-44-6.
Korhonen K, Ahola A, Heikkinen J, Henttonen H, Hotanen J-P, Ihalainen A, Melin M, Pitkänen J, Räty M, Sirviö M, Strandström M (2021) Forests of Finland 2014–2018 and their development 1921–2018. Silva Fenn 55, article id 10662. https://doi.org/10.14214/sf.10662.
Krejza J, Cienciala E, Světlík J, Bellan M, Noyer E, Horáček P, Štěpánek P, Marek MV (2021) Evidence of climate-induced stress of Norway spruce along elevation gradient preceding the current dieback in Central Europe. Trees 35: 103–119. https://doi.org/10.1007/s00468-020-02022-6.
Kund M, Vares A, Sims A, Tullus H, Uri V (2010) Early growth and development of silver birch (Betula pendula Roth.) plantations on abandoned agricultural land. Eur J For Res 129: 679–688. https://doi.org/10.1007/s10342-010-0369-0.
Kuusela K (1990) The dynamics of boreal coniferous forests. SITRA 112, SITRA, Helsinki. ISBN 978-951-563-274-6.
Lee D, Holmström E, Hynynen J, Nilsson U, Korhonen KT, Westerlund B, Bianchi S, Aldea J, Huuskonen S (2023) Current state of mixed forests available for wood supply in Finland and Sweden. Scand J For Res 38: 442–452. https://doi.org/10.1080/02827581.2023.2259797.
Lenth RV (2022) emmeans: estimated marginal means, aka least-squares means. https://CRAN.R-project.org/package=emmeans.
Lotwick HW, Silverman BW (1982) Methods for analysing spatial processes of several types of points. J R Stat Series B 44: 406–413. https://doi.org/10.1111/j.2517-6161.1982.tb01221.x.
Luoranen J, Kiljunen N (2006) Kuusen paakkutaimien viljelyopas. [Guide of containered seedlings of spruce saplings]. Metsäntutkimuslaitos, Suonenjoki. http://urn.fi/URN:ISBN:978-951-40-1997-5.
Luoranen J, Helenius P, Himanen K (2019) Maanmuokkaus parantaa itämistä, kasvua ja elossa oloa. [Soil preparation imroves spruting, growth and liveabilty]. In: Laine T, Luoranen J, Ilvesniemi H (eds) Metsämaan muokkaus: Kirjallisuuskatsaus maanmuokkauksen vaikutuksista metsänuudistamiseen, vesistöihin sekä ekologiseen ja sosiaaliseen kestävyyteen. Luonnonvara- ja biotalouden tutkimus 58/2019: 25–32. http://urn.fi/URN:ISBN:978-952-326-813-5.
Mielikäinen K (1985) Koivusekoituksen vaikutus kuusikon rakenteeseen ja kehitykseen. [Effect of birch admixture to structure and developement of spruce stand]. Communicationes Instituti Forestalis Fenniae 133. http://urn.fi/URN:ISBN:951-40-0711-5.
Müller M, Hantula J, Henttonen H, Huitu O, Kaitera J, Matala J, Neuvonen S, Piri T, Sievänen R, Viiri H, Vuorinen M (2012) Metsien terveys. [Forest health]. In: Asikainen A, Ilvesniemi H, Sievänen R, Vapaavuori E, Muhonen T (eds) Bioenergia, ilmastonmuutos ja Suomen metsät. Metlan työraportteja 240: 121–153. http://urn.fi/URN:ISBN:978-951-40-2378-1.
Müller M, Sievänen R, Beuker E, Meesenburg H, Kuuskeri J, Hamberg L, Korhonen K (2014) Predicting the activity of Heterobasidion parviporum on Norway spruce in warming climate from its respiration rate at different temperatures. For Path 44: 325–336. https://doi.org/10.1111/efp.12104.
Näslund M (1936) Skogsförsöksanstaltens gallringsförsök i tallskog. [Forest research institutes thinning experiment in pine forests]. Meddelanden från Statens skogsförsöksanstalt 29. https://res.slu.se/id/publ/124955.
Nilsson P, Roberge C, Dahlgren J, Fridman J (2022) Skogsdata 2022. Institutionen för skoglig resurshushållning, Sveriges lantbruksuniversitet.
Peltola H, Kellomäki S, Väisänen H (1999) Model computations of the impact of climatic change on the windthrow risk of trees. Clim Change 41: 17–36. https://doi.org/10.1023/A:1005399822319.
Peltola H, Ikonen V-P, Gregow H, Strandman H, Kilpeläinen A, Venäläinen A, Kellomäki S (2010) Impacts of climate change on timber production and regional risks of wind-induced damage to forests in Finland. For Ecol Manag 260: 833–845. https://doi.org/10.1016/j.foreco.2010.06.001.
Pinheiro J, Bates D, R Core Team (2022) nlme: linear and nonlinear mixed effects models.
Pretzsch H, Schütze G (2009) Transgressive overyielding in mixed compared with pure stands of Norway spruce and European beech in Central Europe: evidence on stand level and explanation on individual tree level. Eur J For Res 128: 183–204. https://doi.org/10.1007/s10342-008-0215-9.
Pretzsch H, Rötzer T, Matyssek R, Grams TEE, Häberle K-H, Pritsch K, Kerner R, Munch J-C (2014) Mixed Norway spruce (Picea abies [L.] Karst) and European beech (Fagus sylvatica [L.]) stands under drought: from reaction pattern to mechanism. Trees 28: 1305–1321. https://doi.org/10.1007/s00468-014-1035-9.
Pukkala T (2018) Effect of species composition on ecosystem services in European boreal forest. J For Res 29: 261–272. https://doi.org/10.1007/s11676-017-0576-3.
R Core Team (2023) R: a language and environment for statistical computing. R Foundation for Statistical Computing, Vienna, Austria.
Räty M, Vaahtera E (2021) Metsävarat. [Forest resources]. In: Vaahtera E, Niinistö T, Peltola A, Räty M, Sauvula-Seppälä T, Torvelainen J, Uotila E, Kulju I (eds) Metsätilastollinen vuosikirja 2021. Luonnonvarakeskus, Helsinki, pp 17–39. http://urn.fi/URN:ISBN:978-952-380-325-1.
Rikala R (2012) Metsäpuiden paakkutaimien kasvatusopas. [Guide to containered saplings of forest trees]. Metsäntutkimuslaitos. http://urn.fi/URN:ISBN:978-951-40-2359-0.
Ripley BD (1977) Modelling spatial patterns. J R Stat Series B 39: 172–192. https://doi.org/10.1111/j.2517-6161.1977.tb01615.x.
Ripley BD (1988) Statistical inference for spatial processes. Cambridge University Press, Cambridge. https://doi.org/10.1017/CBO9780511624131.
Ruotsalainen S, Himanen K, Viherä-Aarnio A, Aarnio L, Haapanen M, Luoranen J, Matala J, Riikonen J, Uotila K, Ylioja T (2022) Puulajivalikoiman monipuolistaminen metsänviljelyssä : Synteesiraportti. [Diversifying the tree species assortment in forestry: synthesis report]. Luonnonvara- ja biotalouden tutkimus 24/2022. http://urn.fi/URN:ISBN:978-952-380-394-7.
Saksa T (2011) Kuusen istutustaimien menestyminen ja tukkimiehentäin tuhot eri tavoin muokatuilla uudistusaloilla. [The succes of planted spruce saplings and damages caused by pine weevil at sites with different soil preparation]. Metsätieteen aikakauskirja 2/2011: 91–105. https://doi.org/10.14214/ma.6634.
Saksa T, Heiskanen J, Miina J, Tuomola J, Kolström T (2005) Multilevel modelling of height growth in young Norway spruce plantations in southern Finland. Silva Fenn 39: 143–153. https://doi.org/10.14214/sf.403.
Salmi J (1977) Suomalaisia ja ulkomaisia puulajeja Osa II, Lehtipuut A...N. [Finnish and forgein tree species part II, Broadleaved trees A...N]. Tiedonantoja 35. Helsingin yliopisto. Metsäteknologian laitos, Helsinki. ISBN 951-45-1081-X.
Seidl R, Schelhaas M-J, Rammer W, Verkerk PJ (2014) Increasing forest disturbances in Europe and their impact on carbon storage. Nat Clim Change 4: 806–810. https://doi.org/10.1038/nclimate2318.
Siipilehto J, Valkonen S, Ojansuu R, Hynynen J, Miina J, Saksa T (2014) Metsikön varhaiskehityksen kuvaus MOTTI-ohjelmistossa. [Describing the early devlopement of a stand in MOTTI-software]. Metlan työraportteja 286. http://urn.fi/URN:ISBN:978-951-40-2463-4.
Sikström U, Hjelm K, Holt Hanssen K, Saksa T, Wallertz K (2020) Influence of mechanical site preparation on regeneration success of planted conifers in clearcuts in Fennoscandia – a review. Silva Fenn 54, article id 10172. https://doi.org/10.14214/sf.10172.
Solantie R (2004) Daytime temperature sum – a new thermal variable describing growing season characteristics and explaining evapotranspiration. Boreal Environ Res 9: 319–333.
Szyga-Pluta K, Tomczyk A (2019) Anomalies in the length of the growing season in Poland in the period 1966–2015. Időjárás 123: 391–408. https://doi.org/10.28974/idojaras.2019.3.8.
Tamminen P (1993) Pituusboniteetin ennustaminen kasvupaikan ominaisuuksien avulla Etelä-Suomen kangasmetsissä. [Predicting the site index by the site characteristics in southern Finland]. Folia For 819. http://urn.fi/URN:ISBN:951-40-1337-9.
Temperli C, Bugmann H, Elkin C (2013) Cross-scale interactions among bark beetles, climate change, and wind disturbances: a landscape modeling approach. Ecol Monogr 83: 383–402. https://doi.org/10.1890/12-1503.1.
Tertti M (1949) Kotimaiset puulajit. [Domestic tree species]. In: Erkki K (ed) Suuri metsäkirja – metsänhoito. Werner Söderström, Porvoo, pp 117–155.
Tham Å (1994) Crop plans and yield predictions for Norway spruce (Picea abies (L.) Karst.) and birch (Betula pendula Roth & Betula pubescens Ehrh.) mixtures. Stud For Suec 195.
Uotila K, Saksa T (2014) Effects of early cleaning on young Picea abies stands. Scand J For Res 29: 111–119. https://doi.org/10.1080/02827581.2013.869349.
Venäläinen A, Tuomenvirta H, Pirinen P, Drebs A (2005) A basic Finnish climate data set 1961-2000 - description and illustrations. Reports 2005:5. Finnish Meteorological Institute, Helsinki. https://doi.org/10.13140/RG.2.2.24473.62567.
Vuokila Y (ed) (1987) Metsikkökokeiden maastotyöohjeet. [Fieldwork instructions for field experiments]. Metsäntutkimuslaitoksen tiedonantoja 257. http://urn.fi/URN:ISBN:951-40-0853-7.
Wermelinger B (2004) Ecology and management of the spruce bark beetle Ips typographus – a review of recent research. For Ecol Manag 202: 67–82. https://doi.org/10.1016/j.foreco.2004.07.018.
Zapater M, Hossann C, Bréda N, Bréchet C, Bonal D, Granier A (2011) Evidence of hydraulic lift in a young beech and oak mixed forest using 18O soil water labelling. Trees 25: 885–894. https://doi.org/10.1007/s00468-011-0563-9.
Total of 94 references.
