Mikko T. Niemi  ,
Marjo Palviainen,
Annamari Laurén
,
Marjo Palviainen,
Annamari Laurén
Enhanced multi-objective decision support in peatland forestry using Peatland simulator SUSI
Niemi M. T., Palviainen M., Laurén A. (2026). Enhanced multi-objective decision support in peatland forestry using Peatland simulator SUSI. Silva Fennica vol. 60 no. 2 article id 25025. https://doi.org/10.14214/sf.25025
Highlights
- Reaching multidimensional economic and environmental objectives in peatland forest management can be enhanced using process-based ecosystem models
- Applying ditch depth of 60 cm in ditch network maintenance improved the trade-off between timber production and soil greenhouse gas emissions compared with the conventional ditch depth of 90 cm
- Intensive drainage can reduce tree growth in southern Finland during dry summers.
Abstract
Boreal peatland forests have been extensively drained to increase timber production, but the maintenance of shallowed ditches has been questioned due to increased greenhouse gas (GHG) emissions and negative impacts on water quality. Ditch network maintenance (DNM) lowers water table, which typically increases tree growth, but also increases rate of peat decomposition and consequently CO2 emissions. Multi-objective forest planning balances between the conflicting economic gains and adverse environmental impacts. We used a process-based Peatland simulator SUSI to simulate three management scenarios for 20 forest stands, covering the variety of growing conditions in Finland. We studied how DNM with a reduced ditch depth (60 cm) and a conventional ditch depth (90 cm) affected stand growth, GHG balance, and nitrogen and phosphorus export. Over a 20-year simulation period, annual volume growth response was on average 0.8 m3 ha-1 when ditch depth was changed from 30 cm to 60 cm and 1.0 m3 ha-1 when ditch depth was changed from 30 cm to 90 cm. In southern Finland, DNM decreased stand growth in fertile sites. Soil GHG emissions increased on average by 49% and 119% in 60 cm and 90 cm ditch depths, respectively, compared to 30 cm ditch depth. The cost of reducing GHG emissions ranged from 0–22 € per ton of CO2 in our study sites and scenarios. Our results support the idea that omitting DNM or reducing ditch depth may lead to acceptable compromises, as the marginal cost of soil GHG emissions considerably increases with increasing ditch depth.
Keywords
forest planning;
drainage;
tree growth;
nutrient leaching;
trade-offs;
ditch depth;
greenhouse gas emissions
-
Niemi,
Department of Forest Sciences, University of Helsinki, 00014 Helsinki, Finland; School of Forest Sciences, University of Eastern Finland, 80101 Joensuu, Finland
 https://orcid.org/0000-0003-0461-3667
E-mail
mikko.t.niemi@helsinki.fi
https://orcid.org/0000-0003-0461-3667
E-mail
mikko.t.niemi@helsinki.fi
-
Palviainen,
Department of Forest Sciences, University of Helsinki, 00014 Helsinki, Finland
https://orcid.org/0000-0001-9963-4748
E-mail
marjo.palviainen@helsinki.fi
-
Laurén,
Department of Forest Sciences, University of Helsinki, 00014 Helsinki, Finland
https://orcid.org/0000-0002-6835-9568
E-mail
annamari.lauren@helsinki.fi
Received 20 May 2025 Accepted 22 April 2026 Published 8 May 2026
Views 8442
Available at https://doi.org/10.14214/sf.25025 | Download PDF

Supplementary Files
1 Introduction
In boreal peatland forests, drainage has been considered a prerequisite for economically productive tree growth (Heikurainen 1964; Sarkkola et al. 2012), and consequently peatlands have been extensively drained to increase timber production throughout the boreal region, especially in Finland (Päivänen and Hånell 2012). The condition of ditches tends to deteriorate over time due to erosion, sedimentation, and vegetation encroachment (Saarinen 1935; Stenberg 2016), resulting in reduced ditch water transport. This leads to higher ditch water levels, decreased drainage and higher water table (WT) in the forest. Typically, high WT in peat reduces tree growth (Heikurainen 1980). Therefore, ditch network maintenance (DNM, i.e. cleaning old ditches and/or adding ditches) has been a recommended forest management practice in Finland (Vanhatalo et al. 2019). The 13th National Forest Inventory (NFI13) proposed DNM for 0.8 million ha of productive (annual growth greater than 1 m3 ha–1 a–1) forestry-drained peatlands, representing 18% of total drained peatland forests (Korhonen et al. 2024). In the NFI, the need for DNM was assessed as a combined effect of site fertility, temperature sum, stand volume, and visual observation of ditch condition, tree growth, and soil wetness (Korhonen 2023).
The feasibility of peatland drainage have been questioned due to increased greenhouse gas (GHG) emissions (Ojanen et al. 2010; Jauhiainen et al. 2019) and the export of sediments, nutrients, and organic carbon that cause eutrophication, turbidity, and browning of water bodies (Nieminen et al. 2017; Finér et al. 2021; Koivunen et al. 2023). Timber production may conflict with other ecosystem services such as climate change mitigation, clean water provision, biodiversity, and recreational benefits. Thus forest planning seeks an acceptable balance between the harvest revenues and the environmental impacts to promote sustainable peatland forestry (Miettinen et al. 2020; Eyvindson et al. 2023; Ahtikoski et al. 2024). Too intensive drainage should be avoided because late summer WT of approximately 35 cm below the soil surface is sufficient for near-maximal tree growth (Sarkkola et al. 2012), and deeper WT causes negative environmental impacts (Hökkä et al. 2021). Recent findings indicate that deeper WT has decreased tree growth in transformed drained peatlands, where the development of a mor humus layer has altered nutrient cycling and site hydrology (Hökkä et al. 2025). In the future, global warming will expose boreal forests to increasingly frequent droughts (Ruosteenoja and Jylhä 2021), making peatland forests vulnerable to over-drainage and decreased tree growth. The need for water management should shift forest planning from stand-level drainage decisions to catchment-level planning.
In forested peatlands, timber production and other ecosystem services depend on tree species, site fertility, climate, and ditch depth (Ojanen et al. 2010; Sarkkola et al. 2012; Nieminen et al. 2017; Tong et al. 2024). Forestry decision support systems based on simulation and optimization methods (Rasinmäki et al. 2009; Lämås et al. 2023) have enabled the search for optimized forest management alternatives with respect to multiple decision criteria. However, this approach has primarily been applied in mineral soils, and the connected empirical growth models cannot fully account for the wide range of hydrological conditions that depend on drainage, peat properties and weather. Decision support in forest management can be improved by integrating process-based ecosystem models to the planning. The advantage of process-based ecosystem models is that they can be used to simulate complex ecosystem interactions according to causal or mechanistic principles (Mäkelä et al. 2000; Gilson et al. 2025). Novel, advanced process-based Peatland simulator SUSI (Laurén et al. 2021; Palviainen et al. 2024) enables multi-objective forest management planning also in peatlands. SUSI is suitable for studying the economic and environmental objectives with respect to drainage intensity or forest management practices in different site types and climatic conditions. This is because it simultaneously calculates WT, water, nutrient and carbon fluxes and balances, biomass growth, and nutrient export to ditches. A further advantage of SUSI is that it uses standard forest inventory and site data as input.
Drainage intensity affects wood production, ecosystem and soil carbon balances and nutrient exports to water courses (Saari et al. 2025). Optimal drainage intensity may vary depending on site type, weather conditions and according to objectives. Holistic understanding of drainage intensity considering wood production, economy and environmental impacts is lacking.
The aim of this study was to investigate the effect of ditch depth on stand growth, forest value, GHG balances and nutrient export to watercourses using nationally representative forest data in different site types. We used the Peatland simulator SUSI (Laurén et al. 2021; Palviainen et al. 2024) to simulate three ditch depth scenarios (30, 60 and 90 cm) for 20 drained peatland forest stands. The stands represented different site fertility classes (SFC) and average stand characteristics in four regions of Finland. Additionally, we evaluated the potential application of ecosystem models in forest management decision-making processes.
2 Material and methods
2.1 Forest data
We divided Finland into four study regions: southern Finland (SF), central Finland (CF), North Ostrobothnia–Kainuu (NOB–K) and Lapland, covering the range of climatic conditions within mainland Finland (Fig. 1). In all regions, we examined the four most common SFCs of transformed drained peatlands identified by Vasander and Laine (2008) (Fig. 2). In decreasing order of soil fertility, these are herb-rich heath (Rhtkg), bilberry (Vaccinium myrtillus L.) type (Mtkg), lingonberry (Vaccinium vitis-idaea L.) type (Ptkg), and dwarf shrub type (Vtkg). Together, these SFCs cover 98% of the productive forestry-drained peatlands in Finland (Natural Resources Institute Finland 2023).
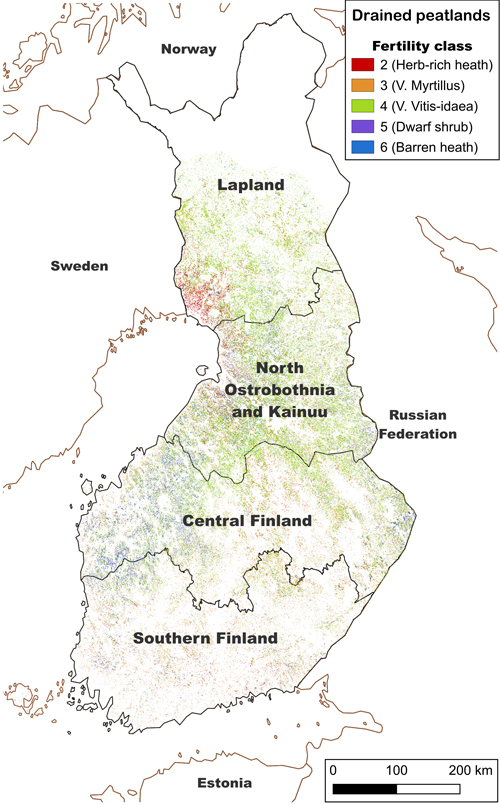
Fig. 1. Study regions and presence of productive (annual growth greater than 1 m3 ha–1 yr–1) drained peatland forests classified by fertility class. Administrative boundaries from the National Land Survey of Finland, 4/2024. Peatland fertility map: Geological Survey of Finland (GTK) (2024) open license CC BY 4.0, including GTK’s data of peatland fertility levels in Finland 1.0/2023, imported from the Hakku service on July 31, 2024.
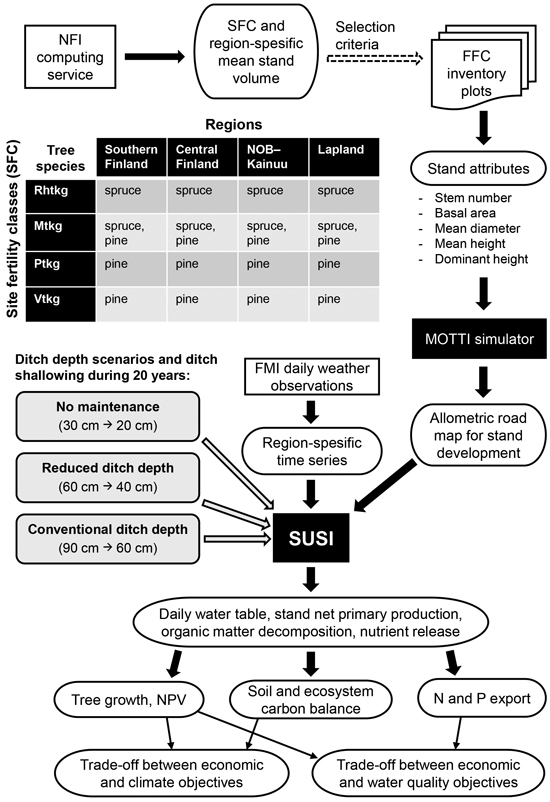
Fig. 2. Study procedure. First, the representative forest attribute data were derived from the Finnish Forest Centre (FFC) inventory plots for 20 forest stands, as shown in the table. Details of the allometric roadmap processed by the MOTTI simulator can be found in Laurén et al. (2021), section 2.3.8. Three ditch depth scenarios were simulated for all study sites. SUSI calculates daily hydrological and biogeochemical fluxes of the ecosystem, which are derived into economic and environmental indicators and their trade-offs.
We calculated the representative forest attribute data for the SFC and region-specific simulations using a two-step procedure, as shown in Fig. 2. First, we used the NFI computing service (Natural Resources Institute Finland 2023) to determine the arithmetic mean stand volume for the four SFCs in each region (Table 1). Second, we searched openly available inventory plots from the Finnish Forest Centre (FFC 2023) for those thinning-stage and mature peatland forests where the stand volume was within 10 m3 ha–1 of the NFI-derived mean stand volume. These plots were used to derive forest attributes of stem number, basal area, mean diameter, mean height, dominant height, and total and assortment volume for each region-specific SFC (Table 2). In addition, the selection was limited by dominant tree species, as shown in Fig. 2, because Scots pine (Pinus sylvestris L.) is the only commercial tree species on Ptkg and Vatkg sites, while Norway spruce (Picea abies (L.) Karst.) is the only economically viable tree species on Rhtkg.
| Table 1. Total area, area of productive (annual growth greater than 1 m3 ha–1 yr–1) peatland forests and mean volume of productive peatland forests of different site fertility classes (SFC) in different regions. SFCs were classified according to Vasander and Laine (2008). Data derived from the NFI computing service (Natural Resources Institute Finland 2023). | |||||
| Region | SFC | Abbreviation | Total area [ha] | Productive forests [ha] | Mean volume [m3 ha–1] |
| Southern Finland (SF) | Herb-rich heath | Rhtkg | 151 255 | 145 041 | 177 |
| Vaccinium myrtillus | Mtkg | 313 263 | 299 173 | 168 | |
| V. vitis-idaea | Ptkg | 204 703 | 194 034 | 135 | |
| Dwarf shrub | Vtkg | 121 811 | 95 130 | 95 | |
| Central Finland (CF) | Herb-rich heath | Rhtkg | 149 554 | 139 549 | 153 |
| V. myrtillus | Mtkg | 445 609 | 415 501 | 146 | |
| V. vitis-idaea | Ptkg | 521 154 | 467 359 | 122 | |
| Dwarf shrub | Vtkg | 371 867 | 243 159 | 83 | |
| North Ostrobothnia–Kainuu (NOB–K) | Herb-rich heath | Rhtkg | 106 670 | 80 914 | 116 |
| V. myrtillus | Mtkg | 372 538 | 264 537 | 130 | |
| V. vitis-idaea | Ptkg | 669 930 | 401 992 | 107 | |
| Dwarf shrub | Vtkg | 378 863 | 157 673 | 71 | |
| Lapland | Herb-rich heath | Rhtkg | 63 870 | 45 495 | 90 |
| V. myrtillus | Mtkg | 121 036 | 80 652 | 119 | |
| V. vitis-idaea | Ptkg | 369 941 | 197 602 | 81 | |
| Dwarf shrub | Vtkg | 213 000 | 45 371 | 52 | |
| Table 2. Forest attributes representing average forest characteristics in different regions and site fertility classes (SFC), calculated from Finnish Forest Centre inventory plots (FFC 2023). SF = Southern Finland, CF = Central Finland, NOB–K = North Ostrobothnia–Kainuu, N = number of stems, BA = basal area, Dg = basal area-weighted mean diameter, Hg = basal area-weighted mean height, Hdom = dominant height, VOL = stem volume. SFCs were classified according to Vasander and Laine (2008). The * indicates the extended range of selection by stand volume due to lack of similar field plots. | ||||||||
| Region | SFC and dominant tree species | FFC plots | N [ha–1] | BA [m2 ha–1] | Dg [cm] | Hg [m] | Hdom [m] | VOL [m3 ha–1] |
| SF | Rhtkg (spruce) | 6 | 1073 | 22.6 | 20.3 | 16.4 | 19.2 | 178 |
| Mtkg (spruce) | 14 | 851 | 20.2 | 21.3 | 17.4 | 19.7 | 169 | |
| Mtkg (pine) | 16 | 932 | 19.8 | 22.0 | 17.9 | 20.2 | 168 | |
| Ptkg (pine) | 44 | 915 | 16.8 | 20.2 | 16.6 | 18.6 | 134 | |
| Vtkg (pine) | 11 | 1156 | 15.1 | 15.0 | 12.3 | 14.4 | 94 | |
| CF | Rhtkg (spruce) | 4 | 903 | 21.1 | 21.8 | 15.3 | 17.9 | 149 |
| Mtkg (spruce) | 21 | 1111 | 19.2 | 18.9 | 15.6 | 18.4 | 144 | |
| Mtkg (pine) | 13 | 1391 | 20.5 | 17.3 | 14.7 | 17.4 | 147 | |
| Ptkg (pine) | 78 | 872 | 16.1 | 18.9 | 15.6 | 17.7 | 122 | |
| Vtkg (pine) | 34 | 1015 | 13.6 | 15.7 | 12.2 | 14.3 | 84 | |
| NOB–K | Rhtkg (spruce) | 5 | 1420 | 20.0 | 18.1 | 12.7 | 15.4 | 120 |
| Mtkg (spruce) | 7 | 1328 | 19.1 | 17.9 | 14.1 | 17.0 | 130 | |
| Mtkg (pine) | 41 | 1296 | 19.0 | 17.2 | 14.1 | 16.4 | 132 | |
| Ptkg (pine) | 44 | 1131 | 16.0 | 16.4 | 13.3 | 15.5 | 106 | |
| Vtkg (pine) | 18 | 1266 | 12.9 | 13.9 | 10.8 | 12.8 | 71 | |
| Lapland | Rhtkg (spruce) | 3* | 1637 | 20.6 | 16.5 | 11.4 | 13.8 | 113 |
| Mtkg (spruce) | 3* | 1824 | 19.3 | 16.2 | 12.7 | 15.6 | 118 | |
| Mtkg (pine) | 15 | 1904 | 20.2 | 14.6 | 11.6 | 14.0 | 119 | |
| Ptkg (pine) | 5 | 2224 | 16.4 | 12.3 | 9.5 | 12.3 | 81 | |
| Vtkg (pine) | 3* | 2083 | 12.4 | 10.6 | 8.2 | 10.2 | 55 | |
2.2 Weather data
We acquired the time series data (2004–2023) from the representative weather stations of the Finnish Meteorological Institute (FMI 2024) for our study regions. Weather data at fine time resolution were aggregated to daily values of mean, maximum and minimum temperature, precipitation, solar radiation and water vapor pressure (Table 3, Fig. 3). Missing weather observations, e.g. due to technical problems of the data provider, were supplemented by searching for the corresponding information at the nearest weather station, secondly by interpolating missing measurements from three previous and three following days, or thirdly by calculating average observations on the same day from different years. Daily water vapor pressure was derived from daily temperature and relative humidity (%) measurements using the equations of Buck (1981). Daily radiation data were obtained from all available stations (a total of seven stations in mainland Finland) and interpolated for our study regions by latitude using inverse distance weighting. A more detailed description of weather data processing is available in Supplementary file S1.
| Table 3. Annual and midsummer (July–August) weather statistics in our study regions. SF = Southern Finland, CF = Central Finland, NOB–K = North Ostrobothnia–Kainuu. | |||||
| SF | CF | NOB–K | Lapland | ||
| Annual mean temperature (°C) | min. | 3.2 | 1.7 | 1.0 | –0.7 |
| mean | 5.1 | 3.8 | 2.9 | 1.5 | |
| max. | 6.8 | 5.4 | 4.5 | 2.8 | |
| July–August mean temperature (°C) | min. | 14.5 | 13.4 | 13.1 | 12.5 |
| mean | 16.3 | 15.2 | 15.0 | 14.5 | |
| max. | 18.7 | 17.6 | 17.1 | 16.9 | |
| Annual rainfall (mm) | min. | 434 | 441 | 406 | 387 |
| mean | 644 | 663 | 621 | 539 | |
| max. | 814 | 857 | 786 | 754 | |
| July–August rainfall (mm) | min. | 69 | 30 | 34 | 26 |
| mean | 148 | 170 | 168 | 130 | |
| max. | 288 | 276 | 303 | 239 | |
| Annual solar radiation (MJ m–2) | min. | 3053 | 2933 | 2887 | 2613 |
| mean | 3409 | 3200 | 3145 | 2895 | |
| max. | 3659 | 3583 | 3475 | 3107 | |
| July–August solar radiation (MJ m–2) | min. | 925 | 866 | 825 | 781 |
| mean | 1034 | 998 | 980 | 901 | |
| max. | 1181 | 1209 | 1151 | 1081 | |
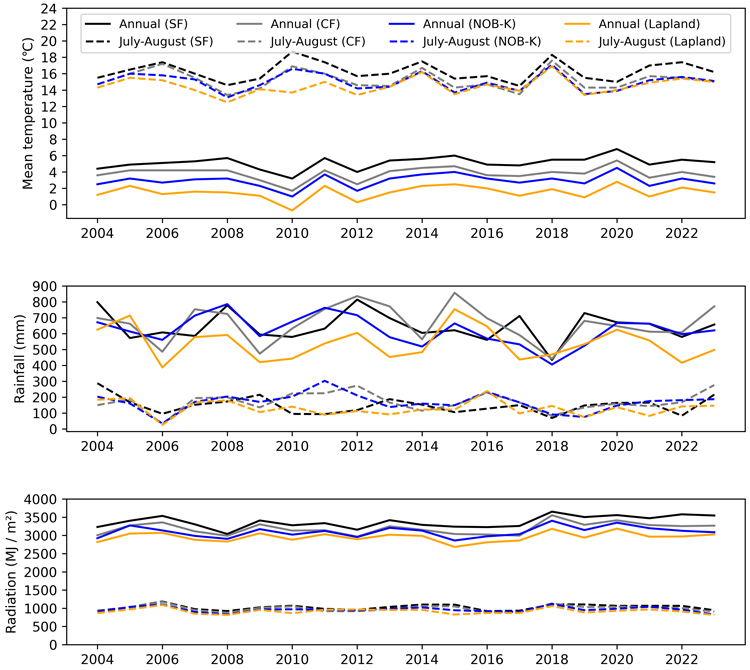
Fig. 3. Annual and midsummer (July–August) temperature, precipitation, and solar radiation during the 20-year simulation period in our study regions. SF = Southern Finland, CF = Central Finland, NOB–K = North Ostrobothnia–Kainuu.
2.3 Simulations
The modeling domain of SUSI consists of a forest stand and a 2-dimensional peat profile between two adjacent ditches (Laurén et al. 2021). Different SFCs had specific peat type and bulk density profiles (Hökkä et al. 2021). We assumed a distance of 40 m between adjacent ditches, which represents a typical ditch spacing in Finnish peatland forests. Peat hydraulic properties were assigned from peat bulk density and peat type as described by Päivänen (1973). Sphagnum peat was used for dwarf shrub peatland forests, while combined Carex and woody peat properties were used for the other SFCs (Päivänen 1973). The MOTTI stand simulator (Hynynen et al. 2002; Salminen et al. 2005) was used to calculate the allometric roadmap for stand development, including total and assortment volumes and biomass of leaves, branches, stems, roots and stumps (Laurén et al. 2021).
We simulated three ditch depth scenarios (Fig. 2). In the initial ditch depth of 30 cm, it is reasonable to consider DNM, and here the forest manager has three options: doing nothing (NO_DNM), opening the deteriorated ditches to the depth of 90 cm according to current guidelines (DNM_90) or opening the ditches only to the depth of 60 cm (DNM_60). Ditch depths decrease nonlinearly over time so that shallowing rate is highest in deepest ditches (Hökkä et al. 2020). Ditches become shallower due to sedimentation and vegetation ingrowth and simultaneous peat subsidence that lowers the reference level, where the ditch depth is measured. Following Hökkä et al. (2020) at the end of the 20-year simulation period, ditch depths were 20 cm, 40 cm, and 60 cm in the NO_NDM, DNM_60, and DNM_90 scenarios, respectively.
SUSI calculates daily WT, stand net primary production, organic matter decomposition, CO2 and CH4 emissions, and nutrient release (Laurén et al. 2021; Palviainen et al. 2024). The annual soil carbon balance Csoil [kg ha–1 yr–1] was calculated as:
![]()
where BMlitter is the mass flux of woody and non-woody litterfall, BMmort is the mass flux of dead trees, BMLR is the mass flux of logging residues, BMGV is the mass flux of ground vegetation litterfall, BMdecomp is the mass loss due to decomposition of soil organic matter, BMtoC is the ratio of soil carbon to total mass (0.5), and DOCHMW and DOCLMW are the fluxes of high and low molecular weight dissolved organic carbon to downstream water bodies. All fluxes are expressed in kg ha–1 yr–1. Furthermore, the annual ecosystem carbon balance Cecosystem [kg ha–1 yr–1] was calculated as follows:
![]()
where BMtree_growth is the net tree biomass growth [kg ha–1 yr–1] and BMGV_change is the biomass change of the ground vegetation [kg ha–1 yr–1]. The mass of carbon components (Csoil and Cecosystem) was then converted to the corresponding mass of CO2 [kg ha–1 yr–1] as follows:

where the molar mass of CO2 (MCO2) is 44 g mol–1 and the molar mass of C (MC) is 12 g mol–1. Finally, CO2 and CH4 emissions were aggregated into CO2-equivalent (CO2eq) emissions using the global warming potential (GWP) of 27 for CH4 emissions (Forster et al. 2021) as follows:
![]()
Annual N and P export loads [kg ha–1 yr–1] were calculated by adding the mass of N and P released below the rooting layer to the unused (by trees and ground vegetation) fraction of N and P released in the rooting layer (Laurén et al. 2021). All equations used in the SUSI simulator are openly available in the Zenodo repository (https://doi.org/10.5281/zenodo.17130513). An overview of the simulator’s processes is provided in Suppl. file S2.
2.4 Economic objectives and trade-offs
We calculated the net present value (NPVDNM k) [€ ha–1] of the DNM investment in ditch depth scenario k (DNM_60, DNM_90) by comparing the incremental value growth achieved by DNM over 20 years to the cost of operating DNM as follows:
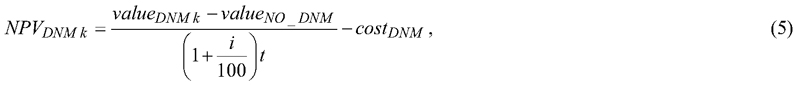
where valueDNM k is the value of the forest stand [€ ha–1] in DNM scenario k at the end of the simulation period, valueNO_DNM is the value of the forest stand [€ ha–1] in NO_DNM scenario at the end of the simulation period, i is the discount rate, t is the time in years, and costDNM is the cost of DNM operation now [€ ha–1]. Sawlog prices of 65.3 € m–3 and 67.1 € m–3 and pulpwood prices of 24.0 € m–3 and 24.9 € m–3 were used for Scots pine and Norway spruce, respectively, which represent the inflation-adjusted average stumpage prices for forest thinning in Finland for the years 2021–2024 (OSF 2025a, 2025b). The inflation-adjusted average unit cost of DNM was 1044.8 € km–1 (OSF 2024, 2025a). The minimum drainage density is 250 m ha–1 when the parallel ditches are spaced 40 meters apart. However, edge and transverse ditches, as well as irregularly shaped drained areas, significantly increase drainage density. For this study, we assumed an average ditch requirement of 300 m ha–1, resulting in a DNM cost of 313.4 € ha–1. Site and scenario specific NPVs were calculated using discount rates of 2%, 3% and 4%.
The cost-effectiveness of DNM in terms of negative climate impacts depends on the trade-offs (TONPV GHG k) between NPV and varying soil CO2eq emissions [€ kg–1] for the DNM scenario k, which were calculated as follows:

where GHGDNM k is the 20-year cumulative soil CO2eq emissions [kg ha–1] in the DNM scenario k, and GHGNO_DNM is the 20-year cumulative soil CO2eq emissions [kg ha–1] in the NO_DNM scenario.
3 Results
Deeper ditches lowered WT, but the magnitude of the lowering was highly dependent on stand location and SFC (Table 4). In our study sites, average growing season WT was 29 cm, 40 cm, and 58 cm in the NO_DNM, DNM_60, and DNM_90 scenarios, respectively. The annual variation in growing season WT is shown in Fig. 4 for four example sites, ranging from the most fertile study site of herb-rich heath forest (Rhtkg) in SF to low-fertility dwarf-shrub peatland (Vtkg) in the NOB–K region. In Rhtkg (SF), late summer WT (July–August) was below 35 cm in 75% of the years also in the NO_DNM scenario. However, in Vtkg located in NOB–K region the late summer WT was below 35 cm only in the dry summer 2006 in the NO_DNM and DNM_60 scenario. In the Norway spruce-dominated Mtkg and Scots pine-dominated Vtkg located in CF region, the ditch depth scenario had a large influence on the number of years in which the growing season WT was optimal (50%–80% in Mtkg, and 35%–85% in Vtkg) for tree growth.
| Table 4. Average water table below the soil surface during the growing season (May–October) in different regions, site fertility classes (SFC) and scenarios: NO_DNM = no ditch network maintenance, DNM60 = reduced ditch depth of 60 cm, DNM90 = conventional ditch depth of 90 cm. SF = Southern Finland, CF = Central Finland, NOB–K = North Ostrobothnia–Kainuu. SFCs were classified according to Vasander and Laine (2008). | ||||
| Region | SFC | NO_DNM [m] | DNM_60 [m] | DNM_90 [m] |
| SF | Rhtkg | –0.47 | –0.55 | –0.73 |
| SF | Mtkg (spruce) | –0.49 | –0.66 | –0.95 |
| SF | Mtkg (pine) | –0.43 | –0.75 | –1.09 |
| SF | Ptkg | –0.35 | –0.57 | –0.89 |
| SF | Vtkg | –0.26 | –0.41 | –0.67 |
| CF | Rhtkg | –0.38 | –0.51 | –0.72 |
| CF | Mtkg (spruce) | –0.34 | –0.41 | –0.53 |
| CF | Mtkg (pine) | –0.32 | –0.51 | –0.80 |
| CF | Ptkg | –0.27 | –0.37 | –0.54 |
| CF | Vtkg | –0.19 | –0.27 | –0.41 |
| NOB–K | Rhtkg | –0.30 | –0.35 | –0.45 |
| NOB–K | Mtkg (spruce) | –0.28 | –0.31 | –0.39 |
| NOB–K | Mtkg (pine) | –0.25 | –0.39 | –0.62 |
| NOB–K | Ptkg | –0.22 | –0.29 | –0.41 |
| NOB–K | Vtkg | –0.14 | –0.20 | –0.30 |
| Lapland | Rhtkg | –0.26 | –0.34 | –0.49 |
| Lapland | Mtkg (spruce) | –0.25 | –0.30 | –0.40 |
| Lapland | Mtkg (pine) | –0.23 | –0.34 | –0.52 |
| Lapland | Ptkg | –0.20 | –0.27 | –0.36 |
| Lapland | Vtkg | –0.14 | –0.21 | –0.31 |
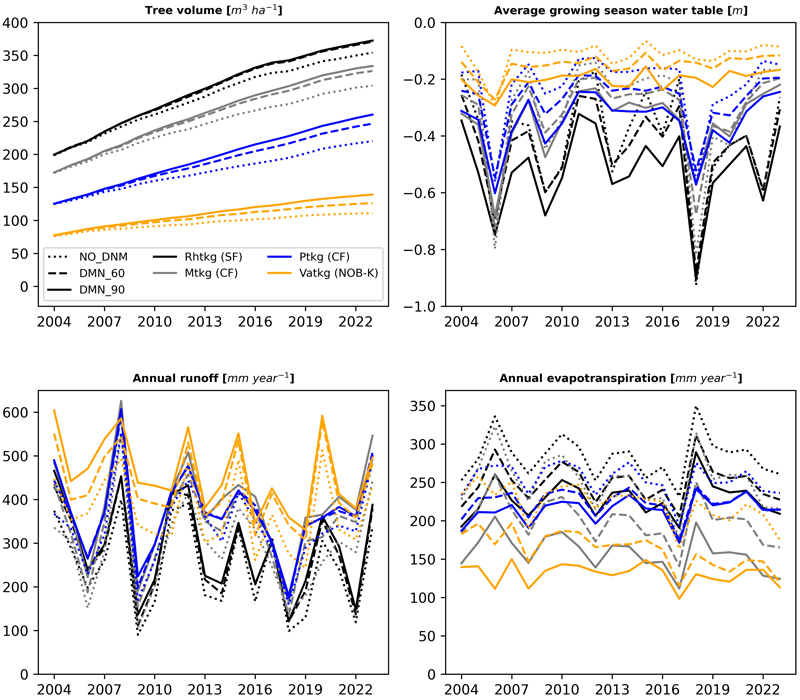
Fig. 4. Tree volume development, variation of the average growing season (May–October) water table below the soil surface, and annual water runoff and evapotranspiration during the 20-year simulation period in four example sites: a spruce-dominated herb-rich heath forest (Rhtkg) in southern Finland (SF), a spruce-dominated Vaccinium myrtillus-type peatland forest (Mtkg) and a pine-dominated V. vitis-idaea-type peatland forest (Ptkg) in central Finland (CF), and a nutrient-poor dwarf-shrub peatland forest (Vatkg) in the North Ostrobothnia–Kainuu region (NOB–K). Scenarios: NO_DNM = no ditch network maintenance, DNM_60 = reduced ditch depth of 60 cm, NDM_90 = conventional ditch depth of 90 cm.
Tree growth increased by an average of 0.8 m3 ha–1 yr–1 and 1.0 m3 ha–1 yr–1 in the DNM_60 and DNM_90 scenarios, respectively, compared with the NO_DNM scenario. However, our simulations also showed a negative growth response when WT was too low from the soil surface for optimal tree growth in southern Finland (Table 5). For example, in the Norway spruce-dominated Rhtkg (SF), the average annual growth response was 0.2 m3 ha–1 yr–1 in the DNM_60 scenario, but stand growth was predicted to decrease by an average of 0.6 m3 ha–1 yr–1 in the DNM_90 scenario. Overall, in more northerly regions, deeper ditches consistently increased stand growth and forest owners may benefit from DNM investments through increased timber production compared to the NO_DNM scenario. The DNM has the highest economic potential in the NOB–K and CF regions (Table 5). In contrast, DNM in the fertile site types (Rhtkg, Mtkg) had negative NPV in SF region. Furthermore, DNM conducted in the nutrient poor Vatkg site yielded in negative NPV in Lapland (Table 5).
| Table 5. Average forest volume growth in different regions, site fertility classes (SFC) and scenarios: NO_DNM = no ditch network maintenance, DNM60 = reduced ditch depth of 60 cm, DNM90 = conventional ditch depth of 90 cm. The net present value of ditch network maintenance (NPVDNM) in scenarios DNM_60 and DNM_90 was calculated using discount rates of 2%, 3% and 4%. NPVDNM was not calculated for scenarios with a negative volume growth response to DNM. SF = Southern Finland, CF = Central Finland, NOB–K = North Ostrobothnia–Kainuu. SFCs were classified according to Vasander and Laine (2008). | ||||||||||
| Region | SFC | Volume growth [m3 ha–1 yr–1] | NPVDNM [€ ha–1] (2%) | NPVDNM [€ ha–1] (3%) | NPVDNM [€ ha–1] (4%) | |||||
| NO_DNM | DNM_60 | DNM_90 | DNM_60 | DNM_90 | DNM_60 | DNM_90 | DNM_60 | DNM_90 | ||
| SF | Rhtkg | 8.7 | 8.9 | 8.1 | –94 € | –133 € | –164 € | |||
| SF | Mtkg (spruce) | 10.3 | 10.0 | 8.7 | ||||||
| SF | Mtkg (pine) | 6.9 | 6.5 | 6.0 | ||||||
| SF | Ptkg | 7.7 | 8.2 | 7.5 | 205 € | 113 € | 38 € | |||
| SF | Vtkg | 5.3 | 6.1 | 6.2 | 338 € | 366 € | 223 € | 246 € | 129 € | 148 € |
| CF | Rhtkg | 7.6 | 8.2 | 7.6 | 169 € | 83 € | 14 € | |||
| CF | Mtkg (spruce) | 7.9 | 8.8 | 8.8 | 489 € | 544 € | 347 € | 392 € | 231 € | 268 € |
| CF | Mtkg (pine) | 6.1 | 6.6 | 6.3 | 258 € | –31 € | 157 € | –81 € | 74 € | –122 € |
| CF | Ptkg | 5.9 | 7.0 | 7.3 | 648 € | 882 € | 477 € | 670 € | 338 € | 497 € |
| CF | Vtkg | 3.6 | 4.8 | 5.6 | 572 € | 1124 € | 415 € | 869 € | 287 € | 661 € |
| NOB–K | Rhtkg | 5.5 | 6.3 | 6.3 | 433 € | 529 € | 301 € | 380 € | 193 € | 258 € |
| NOB–K | Mtkg (spruce) | 6.0 | 6.9 | 7.1 | 460 € | 658 € | 323 € | 486 € | 211 € | 345 € |
| NOB–K | Mtkg (pine) | 5.7 | 6.6 | 6.7 | 500 € | 558 € | 356 € | 404 € | 238 € | 278 € |
| NOB–K | Ptkg | 4.8 | 5.8 | 6.2 | 491 € | 811 € | 349 € | 612 € | 232 € | 449 € |
| NOB–K | Vtkg | 2.5 | 3.4 | 4.1 | 297 € | 775 € | 189 € | 582 € | 101 € | 425 € |
| Lapland | Rhtkg | 4.1 | 4.8 | 4.8 | 298 € | 293 € | 190 € | 185 € | 101 € | 98 € |
| Lapland | Mtkg (spruce) | 3.9 | 4.7 | 4.9 | 263 € | 417 € | 161 € | 288 € | 78 € | 182 € |
| Lapland | Mtkg (pine) | 3.6 | 4.3 | 4.6 | 184 € | 351 € | 96 € | 233 € | 24 € | 137 € |
| Lapland | Ptkg | 2.9 | 3.6 | 3.9 | 86 € | 234 € | 15 € | 137 € | –42 € | 58 € |
| Lapland | Vtkg | 1.5 | 2.2 | 2.7 | –5 € | 191 € | –60 € | 102 € | –104 € | 29 € |
Without DNM, integrated over the whole simulation period, all study sites were carbon sinks at the ecosystem level (Table 6). However, in dry years (e.g. 2006 and 2018), some of the study sites in southern and central Finland were carbon sources even in the NO_DNM scenario due to low WT and consequent high soil CO2 emissions (Fig. 4, Fig. 5). Soil CO2 emissions increased almost linearly with WT in the growing season, indicating that omitting DNM or reducing ditch depth are straightforward strategies to improve the climate objectives of peatland forestry. In turn, soils emitted more CH4 when WT was closer than approximately 30 cm to the soil surface and consume CH4 at deeper WTs. Compared to the NO_DNM scenario, soil CO2eq emissions increased on average by 1700 kg ha–1 yr–1 and 4000 kg ha–1 yr–1 in the DNM_60 and DNM_90 scenarios, respectively.
| Table 6. Average annual soil and ecosystem (soil + biomass) CO2-equivalent greenhouse gas (GHG) balances in different regions, site fertility classes (SFC) and scenarios: NO_DNM = no ditch network maintenance, DNM60 = reduced ditch depth of 60 cm, DNM90 = conventional ditch depth of 90 cm. A negative value indicates a loss of carbon in soil or biomass (carbon source), and a positive value indicates an addition of carbon storage in forest ecosystem (carbon sink). Trade-offs between net present value (NPV) and increased soil GHG emissions (TO NPV GHG) were calculated using a discount rate of 3%. SF = Southern Finland, CF = Central Finland, NOB–K = North Ostrobothnia–Kainuu. SFCs were classified according to Vasander and Laine (2008). | |||||||||
| Region | SFC | Soil GHG balance [kg ha–1 yr–1] | TO NPV GHG (3%) | Ecosystem GHG balance [kg ha–1 yr–1] | |||||
| NO_DNM | DNM_60 | DNM_90 | DNM_60 | DNM_90 | NO_DNM | DNM_60 | DNM_90 | ||
| SF | Rhtkg | –6860 | –8220 | –10 570 | 2120 | 1030 | –2150 | ||
| SF | Mtkg (spruce) | –6530 | –8850 | –12 070 | 3980 | 1410 | –3100 | ||
| SF | Mtkg (pine) | –5720 | –9610 | –13 230 | 1340 | –2950 | –7130 | ||
| SF | Ptkg | –4260 | –6880 | –10 840 | 2 € | 3750 | 1650 | –2980 | |
| SF | Vtkg | –2910 | –5200 | –8470 | 5 € | 2 € | 2670 | 1800 | –1380 |
| CF | Rhtkg | –5600 | –7350 | –10 070 | 2 € | 2420 | 1370 | –1990 | |
| CF | Mtkg (spruce) | –4450 | –5440 | –7280 | 17 € | 7 € | 3650 | 3580 | 1840 |
| CF | Mtkg (pine) | –3980 | –6110 | –9640 | 4 € | 2270 | 720 | –3090 | |
| CF | Ptkg | –3160 | –4690 | –7040 | 16 € | 9 € | 3050 | 2680 | 680 |
| CF | Vtkg | –1830 | –3240 | –5220 | 15 € | 13 € | 1830 | 1720 | 520 |
| NOB–K | Rhtkg | –3830 | –4770 | –6450 | 16 € | 7 € | 2380 | 2310 | 760 |
| NOB–K | Mtkg (spruce) | –3020 | –3750 | –5080 | 22 € | 12 € | 3560 | 3790 | 2750 |
| NOB–K | Mtkg (pine) | –3360 | –5270 | –8230 | 9 € | 4 € | 2550 | 1640 | –1210 |
| NOB–K | Ptkg | –2110 | –3410 | –5160 | 13 € | 10 € | 2990 | 2750 | 1520 |
| NOB–K | Vtkg | –1010 | –2280 | –3820 | 7 € | 10 € | 1550 | 1240 | 520 |
| Lapland | Rhtkg | –2800 | –4110 | –6200 | 7 € | 3 € | 2110 | 1640 | –400 |
| Lapland | Mtkg (spruce) | –1840 | –2850 | –4320 | 8 € | 6 € | 2640 | 2520 | 1330 |
| Lapland | Mtkg (pine) | –2300 | –4070 | –6400 | 3 € | 3 € | 1620 | 600 | –1420 |
| Lapland | Ptkg | –1220 | –2530 | –3960 | 1 € | 2 € | 1970 | 1510 | 420 |
| Lapland | Vtkg | –670 | –2090 | –3650 | 2 € | 1080 | 410 | –580 | |
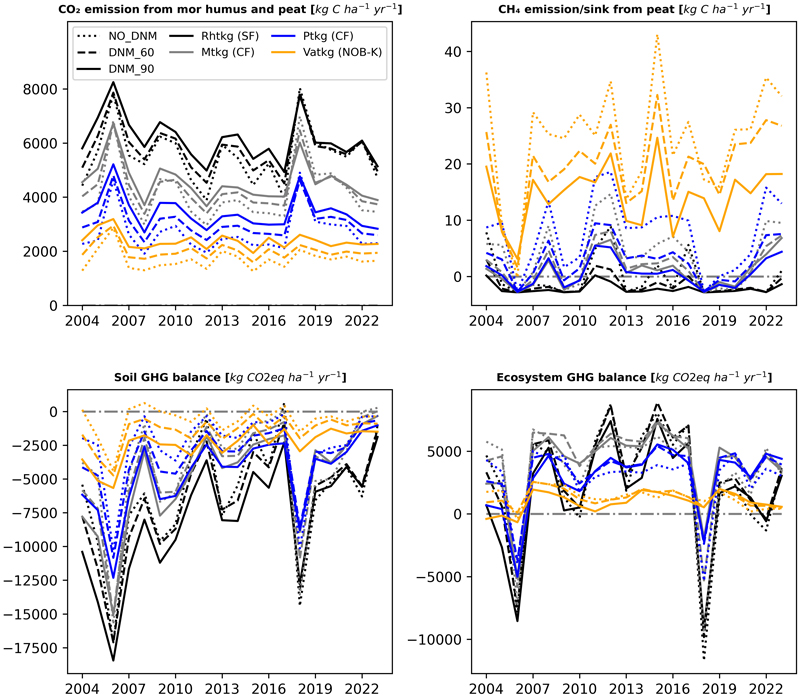
Fig. 5. Annual CO2 and CH4 emissions, and CO2-equivalent soil and ecosystem (soil + biomass) greenhouse gas (GHG) balance during the 20-year simulation period in four example sites (see Fig. 4).
At a discount rate of 3%, the trade-off between the stand NPV and the increased soil GHG emissions was on average 9 € per ton of additional soil GHG emissions in DNM_60 scenario and 6 € per ton in DNM_90 scenario. At the ecosystem level, increased forest volume growth may compensate some of the increased peat decomposition caused by DNM, but in general, the NO_DNM scenario was consistently the best ditch depth alternative in terms of ecosystem GHG balance (Table 6). On average, the ecosystem GHG balance (in CO2eq) was 2500 kg ha–1 yr–1, 1600 kg ha–1 yr–1, and –800 kg ha–1 yr–1 in the NO_DNM, DNM_60, and DNM_90 scenarios, respectively (positive values indicate carbon sinks and negative values indicate carbon sources).
In addition, DNM has a negative impact on downstream water quality, as both N and P export to water courses increased significantly with increasing ditch depth (Table 7), and that the largest nutrient loads occur after dry summers. The annual N exports were 1.6 kg ha–1, 2.3 kg ha–1, and 3.9 kg ha–1, and the annual P exports were 0.3 kg ha–1, 0.4 kg ha–1, and 0.6 kg ha–1, on average, in the NO_DNM, DNM_60, and DNM_90 scenarios, respectively.
| Table 7. Average annual nitrogen (N) and phosphorus (P) export in different regions, site fertility classes (SFC) and scenarios: NO_DNM = no ditch network maintenance, DNM60 = reduced ditch depth of 60 cm, DNM90 = conventional ditch depth of 90 cm. SF = Southern Finland, CF = Central Finland, NOB–K = North Ostrobothnia–Kainuu. SFCs were classified according to Vasander and Laine (2008). | |||||||
| Region | SFC | N export [kg ha–1 yr–1] | P export [kg ha–1 yr–1] | ||||
| NO_DNM | DNM_60 | DNM_90 | NO_DNM | DNM_60 | DNM_90 | ||
| SF | Rhtkg | 4.95 | 6.53 | 8.94 | 1.05 | 1.20 | 1.48 |
| SF | Mtkg (spruce) | 3.48 | 4.45 | 7.05 | 0.67 | 0.70 | 1.00 |
| SF | Mtkg (pine) | 2.09 | 5.36 | 10.39 | 0.40 | 0.90 | 1.50 |
| SF | Ptkg | 1.79 | 2.32 | 4.37 | 0.22 | 0.26 | 0.45 |
| SF | Vtkg | 1.25 | 1.96 | 3.07 | 0.13 | 0.19 | 0.30 |
| CF | Rhtkg | 3.59 | 4.87 | 7.46 | 0.87 | 0.97 | 1.24 |
| CF | Mtkg (spruce) | 2.04 | 2.39 | 3.67 | 0.52 | 0.58 | 0.71 |
| CF | Mtkg (pine) | 1.92 | 2.42 | 4.44 | 0.38 | 0.41 | 0.73 |
| CF | Ptkg | 1.17 | 1.63 | 2.47 | 0.17 | 0.21 | 0.27 |
| CF | Vtkg | 0.65 | 0.92 | 1.62 | 0.06 | 0.09 | 0.15 |
| NOB–K | Rhtkg | 1.77 | 2.50 | 4.27 | 0.64 | 0.75 | 0.93 |
| NOB–K | Mtkg (spruce) | 1.10 | 1.32 | 2.34 | 0.35 | 0.43 | 0.55 |
| NOB–K | Mtkg (pine) | 1.37 | 1.75 | 3.28 | 0.29 | 0.31 | 0.50 |
| NOB–K | Ptkg | 0.62 | 1.11 | 1.89 | 0.10 | 0.15 | 0.22 |
| NOB–K | Vtkg | 0.15 | 0.49 | 1.05 | 0.01 | 0.04 | 0.09 |
| Lapland | Rhtkg | 1.38 | 2.20 | 3.93 | 0.50 | 0.62 | 0.77 |
| Lapland | Mtkg (spruce) | 0.78 | 1.16 | 2.07 | 0.25 | 0.35 | 0.47 |
| Lapland | Mtkg (pine) | 1.07 | 1.54 | 2.24 | 0.32 | 0.30 | 0.35 |
| Lapland | Ptkg | 0.30 | 0.80 | 1.44 | 0.05 | 0.12 | 0.19 |
| Lapland | Vtkg | 0.08 | 0.48 | 1.06 | 0.01 | 0.04 | 0.10 |
4 Discussion
The rationale of this study was to investigate the effects of ditch depth on timber production, GHG emissions and nutrient export in drained peatland forests located in different geographical regions in Finland. The trade-offs between economic and environmental objectives were evaluated. Field experiments have shown that stand growth is highest when the average July–August WT is 25–30 cm, and no clear growth improvement occurs when WT is lowered below 35–40 cm from the soil surface (Sarkkola et al. 2012). Hökkä et al. (2021) have suggested a depth of 35 cm as an optimal target for peatland WT in late summer. In addition to ditch depth, stand volume is another key factor that affects WT through evapotranspiration. Sarkkola et al. (2010) have suggested that stand volumes of 120 m3 ha–1 and 150 m3 ha–1 are sufficient for keeping WT in optimal range for stand growth in southern and northern Finland, respectively. Our results showed that the lowest growth response to DNM was achieved in southern Finland, where DNM may even have a negative impact on tree growth especially in dry summers. However, our scenarios were based on regional averages of forest attributes, which means that the simulations representing Vtkg–Rhtkg sites in SF and CF were performed on peatland forests, where stand volume is so high that DNM is not recommended (Sarkkola et al. 2010). The highest economic outcome of DNM investment was possible on medium and low fertility drained peatlands in central Finland and NOB–K region.
Among previous empirical studies, Sarkkola et al. (2012) reported average volume growth increases of 0.6 m3 ha–1 yr–1 and 1.1 m3 ha–1 yr–1 during 20 years after DNM in southern and northern Finland, respectively, when they measured mainly V. vitis-idaea- and dwarf shrub-type peatlands at plot locations roughly corresponding to our study regions of CF and NOB–K. In the corresponding regions and SFCs, we simulated average growth responses of 1.0 m3 ha–1 yr–1 and 1.7 m3 ha–1 yr–1 in the DNM_60 and DNM_90 scenarios, respectively. Sikström et al. (2020) found an average growth response of 1.6 m3 ha–1 yr–1 during a 25-year period after DNM in Sweden and the growth response was higher in southern Sweden than in northern Sweden. Ahtikoski et al. (2008) reported mean growth responses of 0.6 m3 ha–1 yr–1 – 0.4 m3 ha–1 yr–1 for in Lapland (Vtkg) and in North Ostrobothnia (Mtkg), respectively, during 20-year simulation period after DNM.
Lower growing season WT implies increased CO2 emissions and decreased CH4 emissions (Ojanen et al. 2010, 2013). Ojanen and Minkkinen (2019) found that when WT was less than 60 cm from the soil surface, net soil CO2 emissions increased rather linearly with lower WT. Our simulations slightly overestimate the net CO2 emissions associated with WT compared with the linear models of Ojanen and Minkkinen (2019), but the annual results are still within the range of their empirical data, and the difference between nutrient-rich and nutrient-poor sites is similar. Further validation of the SUSI results would require simulations and gas measurements from the same study sites in the same years. In any case, the hydrological process models of SUSI have been validated against a peatland forest water balance experiment (Sarkkola et al. 2013; Laurén et al. 2021), and the peat decomposition model works logically with respect to soil WT, so it is justified to use these simulations at least to compare GHG emissions between forest management alternatives.
In our results, on average, the DNM_60 and DNM_90 scenarios increased CO2eq soil emissions by 49% and 119%, respectively, compared to the NO_DNM scenario. At the ecosystem level, which also includes carbon sequestered in aboveground biomass, almost all study sites were carbon sinks when ditch depth was 60 cm, but approximately half of the study sites (including all sites in southern Finland) were carbon sources under the conventional ditch depth strategy. On average, the trade-off between NPV and increased CO2eq GHG emissions was better in the DNM_60 scenario, where forest owner should be compensated by an average of 9 € per ton of soil GHG emissions if he/she refrains from DNM with reduced ditch depth, compared to the DNM_90 scenario, where the average cost was 6 € per ton of soil GHG emissions. Ahtikoski et al. (2024) reported a cost range of 5–20 € per ton of CO2 when comparing the respective trade-offs by simulating rotational and continuous cover forestry treatments on drained peatlands in North Ostrobothnia. They used slightly different methods to assess soil CO2 emissions, different ditch depth assumptions, lower stumpage prices and DNM unit costs, but the price of soil carbon was still in the same range as in our results. In addition, our results are consistent with Eyvindson et al. (2023), who found that maximizing timber production can significantly increase GHG emissions but showed that it is still possible to find reasonable trade-offs between economic benefits and climate goals.
Finland has committed to climate neutrality by 2035 (Huttunen et al. 2022), which means that carbon sinks in the land-use sector will need to be carefully considered in land-use planning and policy-making. Voluntary carbon markets may also develop to allow forest owners to earn income from storing additional carbon in forest biomass (Nonini and Fiala 2021). Note that the price of carbon permits in the European Union has been over 60 € per ton of CO2 since 2022, which is significantly higher than the price that a rational forest owner should accept for foregoing DNM treatment. In addition, the Water Framework Directive (Carvalho et al. 2019) and the European Union Biodiversity Strategy for 2030 (Hermoso et al. 2022) commit European countries to promote water quality and reverse ecosystem degradation. Furthermore, a growing number of forest owners want to consider environmental and social values in their decision-making (Westin et al. 2023), which requires multi-objective predictions of forest management alternatives for decision support. Our vision is to develop the mechanistic Peatland simulator SUSI into a multi-objective decision support system that can be used when forest owners want to understand how forest management affects the ecosystem and balance conflicting interests in their decision-making. Because SUSI calculates water, nutrient, and carbon fluxes and balances within the ecosystem simultaneously, the economic and environmental objectives can also be modeled simultaneously. Another advantage is that causal interactions can be modeled under climate change and changing site conditions. Understanding these ecosystem interactions holistically is also necessary for calculating peat soil carbon balances, which play a key role in analyzing the carbon balance of Finland’s land use sector.
SUSI simulates daily WT, ecosystem carbon and nutrient fluxes, and biomass growth based on soil and forest attributes and daily weather data. In this study, we used weather data from the last 20 years, which caused interannual variability in ecosystem services, especially during the hot and dry summer of 2018. The simulations showed that Norway spruce-dominated fertile peatlands were more vulnerable to drought than Scots pine-dominated nutrient-poor peatlands, suggesting that dry and hot summers can accelerate soil carbon loss, especially in fertile peatlands. Climate scenarios predict an increasing occurrence of droughts in the boreal region (Ruosteenoja and Jylhä 2021), thus the results for 2018 may indicate the direction in which ecosystem services will develop in a warming climate. However, the effects of dry summers on tree growth and other ecosystem services are not straightforward, as there are many feedback mechanisms in peatland ecosystems that need to be understood when considering optimal peatland forest management under the changing climate (Laurén et al. 2021).
Certain assumptions in SUSI require attention in the interpretation of the results. SUSI does not account for soil subsidence, which affects WT gradient and therefore the drain flow. Table 6 reveals that soil is losing C. Converting the C loss to organic material and assuming bulk density of 100 kg m–3, we end up to subsidence estimates of 3–7 cm for NO_DNM scenario and 8–14 cm for DNM_90 scenario during the 20-year simulation period in Southern Finland. For Northern Finland the subsidence rate was smaller. The estimate fits well within the range reported by Minkkinen and Laine (1998), who concluded that peat in Finnish pine mires subsided by 22 cm in 60 years. Shallowing of the ditch in the NO_DNM scenario was altogether 10 cm during the simulation period. We applied the shallowing rate from Hökkä et al. (2020) so that the shallowing rate becomes smaller when the initial ditch depth is shallow. Hökkä et al. (2020) reports ditch depths from field conditions, and the observations implicitly contained both the sedimentation and vegetation ingrowth-driven ditch shallowing and the subsidence-driven drawdown of the reference height (that is the ditch bank or the soil surface). Therefore, even though subsidence was not accounted for in SUSI, the effect of subsidence on the WT gradient became considered implicitly in the ditch shallowing dynamics.
Simulated N and P exports were in some cases higher compared to N (0.2–7.7 kg ha–1 yr–1) and P exports (0.01–0.42 kg ha–1 yr–1) reported in empirical studies (Finér et al. 2021). SUSI may overestimate the nutrient export loads due to the simplified calculation in which all nutrients released below the rooting zone are transported to water courses in annual time step. This assumption may overestimate the nutrient export especially in dry years and low WTs.
In the future, multi-objective peatland forest management will need to pay more attention to adjusting WT, especially in southern and central Finland climate. Our simulation results and the empirical observations of Hökkä et al. (2025) have shown the risk of decreasing tree growth by overly intensive drainage of peatland forests. The earlier principles that deep WT is required for profitable tree growth should be questioned, as the original drainage is now typically more than 50 years old and soil properties have changed significantly over time, especially due to the development of growing mor layer (Hökkä et al. 2025). In some cases, the optimal solution for balancing forest growth and GHG emissions under the risk of summer drought can be further reducing drainage intensity by blocking part of the ditches or using adjustable dams. Water management planning should be done at the catchment scale, where suitable locations for dams (Urzainki et al. 2020) and/or water protection structures (Niemi et al. 2023) can be optimized using hydrological models and spatial analysis. In any case, process-based ecosystem modeling allows prediction of forest development under global warming and offers great potential for research on multi-objective forest planning.
5 Conclusions
Multi-objective forest owners need information on the multiple ecosystem services of different forest management alternatives, and in this study, we presented how the process-based Peatland simulator SUSI can be used to evaluate the conflicting economic and environmental objectives of different ditch depth alternatives. In our simulations, annual stand growth increased by an average of 14% and 18% in the reduced and conventional ditch depth scenarios, respectively, compared to the 30 cm ditch depth scenario. However, soil GHG emissions increased by 49% and 119%, N leaching by 46% and 144%, and P leaching by 23% and 72% in the 60 cm and 90 cm ditch depth scenarios, respectively. The financial return of DNM depends strongly on stand characteristics, site fertility and soil location. Our results showed a positive NPV for DNM investments at a 4% discount rate in all the study sites located in central Finland and North Ostrobothnia–Kainuu region, but in southern Finland DNM may even have negative effect on tree growth due to over-drainage. Over the 20-year simulation period, our results showed that less intensive drainage is a cost-effective approach to mitigate climate change, as the trade-off between NPV and CO2 emissions ranged from 0–22 € per ton CO2, which is a very moderate cost in carbon units compared to market prices or other alternatives to produce these credits. Future developments of our research will focus on different harvesting treatments, fertilization alternatives and the use of climate change scenarios for decision support in multi-objective peatland forestry.
Declaration of openness of research materials, data, and code
The forest and weather data were obtained from open data sources of the Natural Resources Institute of Finland (2023), the Finnish Forest Centre (2023) and the Finnish Meteorological Institute (2024). The source code of the SUSI simulator is openly available at https://github.com/annamarilauren/susi_2024. All data, code and supplementary files are openly available at the Zenodo data repository: https://doi.org/10.5281/zenodo.17130513.
Authors’ contributions
All authors contributed to the conception of the research question and design of the work. M.N. processed the forest and weather data, A.L. implemented the simulations, and M.N. analyzed the results. All authors contributed to the critical revision of the results and scientific writing.
Acknowledgements
We would like to thank Professor Jari Vauhkonen from the University of Eastern Finland for his support of this work.
Funding
The work was supported by the UNITE flagship funded by the Flagship Programme of the Research Council of Finland (grant number 337127), by the Tandem Industry Academia (TIA) Postdoc (2024) project AEMES funded by the Finnish Research Impact Foundation, and by the European Union – NextGenerationEU instrument funded by the Research Council of Finland (MULTIRISK, grant number 353262).
References
Ahtikoski A, Kojola S, Hökkä H, Penttilä T (2008) Ditch network maintenance in peatland forest as a private investment: short- and long-term effects on financial performance at stand level. Mires Peat 3, article id 3. https://doi.org/10.19189/001c.128253.
Ahtikoski A, Repola J, Hökkä H, Sarkkola S, Ojanen P, Haikarainen S, Stenberg L, Juutinen A (2024) Trade-offs between nutrient export, greenhouse gas balance and financial performance in continuous cover and rotation forestry in drained peatlands in northern Finland. Mires Peat 31, article id 22. https://doi.org/10.19189/MAP.2023.OMB.SC.2411678.
Buck AL (1981) New equations for computing vapor pressure and enhancement factor. J Appl Meteorol 20: 1527–1532. https://doi.org/10.1175/1520-0450(1981)020%3C1527:NEFCVP%3E2.0.CO;2.
Carvalho L, Mackay EB, Cardoso AC, Baattrup-Pedersen A, Birk S, Blackstock KL, Borics G, Borja A, Feld CK, Ferreira MT, Globevnik L, Grizzetti B, Hendry S, Hering D, Kelly M, Langaas D, Meissner K, Panagopoulos Y, Penning E, Rouillard J, Sabater S, Schmedtje U, Spears BM, Venohr M, van de Bund W, Solheim AL (2019) Protecting and restoring Europe’s waters: an analysis of the future development needs of the Water Framework Directive. Sci Total Environ 658: 1228–1238. https://doi.org/10.1016/j.scitotenv.2018.12.255.
Eyvindson K, Launiainen S, Leppä K, Repo A, Salmivaara A, Lehtonen A (2023) Trade-offs between greenhouse gas mitigation and economic objectives with drained peatlands in Finnish landscapes. Can J For Res 53: 444–454. https://doi.org/10.1139/cjfr-2022-0101.
Finér L, Lepistö A, Karlsson K, Räike A, Härkönen L, Huttunen M, Joensuu S, Kortelainen P, Mattsson T, Piirainen S, Sallantaus T, Sarkkola S, Tattari S, Ukonmaanaho L (2021) Drainage for forestry increases N, P and TOC export to boreal surface waters. Sci Total Environ 762, article id 144098. https://doi.org/10.1016/j.scitotenv.2020.144098.
Finnish Forest Centre (FFC) (2023) Inventointikoealat. [Inventory plots]. https://www.metsakeskus.fi/fi/avoin-metsa-ja-luontotieto/aineistot-paikkatieto-ohjelmille/paikkatietoaineistot. Accessed 22 August 2023.
Finnish Meteorological Institute (FMI) (2024) The Finnish Meteorological Institute’s open data. https://en.ilmatieteenlaitos.fi/open-data. Accessed 10 September 2024.
Forster P, Storelvmo T, Armour K, Collins W, Dufresne J-L, Frame D, Lunt DJ, Mauritsen T, Palmer MD, Watanabe M, Wild M, Zhang H (2021) The earth’s energy budget, climate feedbacks, and climate sensitivity. In: Masson-Delmotte V, Zhai P, Pirani A, Connors SL, Péan C, Berger S, Caud N, Chen Y, Goldfarb L, Gomis MI, Huang M, Leitzell K, Lonnoy E, Matthews JBR, Maycock TK, Waterfield T, Yelekçi O, Yu R, Zhou B (eds) Climate change 2021: the physical science basis. Cambridge University Press, Cambridge, United Kingdom and New York, NY, USA, pp 923–1054. https://doi.org/10.1017/9781009157896.009.
Geological Survey of Finland (GTK) (2024) Peatland fertility level of Finland 1.0/2023. https://hakku.gtk.fi/en/locations?id=230. Accessed 31 July 2024.
Gilson LW, Eskelson BNI, Sattler DF (2025) What makes a forest growth model climate-sensitive? An examination of statistical and silvicultural model needs under climate change. Forestry 98(5): 649–660. https://doi.org/10.1093/forestry/cpaf020.
Heikurainen L (1964) Improvement of forest growth on poorly drained peat soils. Int Rev For Res 1: 39–113. https://doi.org/10.1016/B978-1-4831-9975-7.50007-7.
Heikurainen L (1980) Kuivatuksen tila ja puusto 20 vuotta vanhoilla ojitusalueilla. [Drainage condition and tree stands on peatlands drained 20 years ago]. Acta For Fenn 167, article id 7614. https://doi.org/10.14214/aff.7614.
Hökkä H, Stenberg L, Laurén A (2020) Modeling depth of drainage ditches in forested peatlands in Finland. Balt For 26, article id 453. https://doi.org/10.46490/BF453.
Hökkä H, Laurén A, Stenberg L, Launiainen S, Leppä K, Nieminen M (2021) Defining guidelines for ditch depth in drained Scots pine dominated peatland forests. Silva Fenn 55, article id 10494. https://doi.org/10.14214/sf.10494.
Hökkä H, Palviainen M, Stenberg L, Heikkinen J, Laurén A (2025) Changing role of water table and weather conditions in diameter growth of Scots pine in drained peatlands. Can J For Res 55: 1–12. https://doi.org/10.1139/cjfr-2024-0011.
Hermoso V, Carvalho SB, Giakoumi S, Goldsborough D, Katsanevakis S, Leontiou S, Markantonatou V, Rumes B, Vogiatzakis IN, Yates KL (2022) The EU Biodiversity Strategy for 2030: opportunities and challenges on the path towards biodiversity recovery. Environ Sci Policy 127: 263–271. https://doi.org/10.1016/j.envsci.2021.10.028.
Huttunen R, Kuuva P, Kinnunen M, Lemström B, Hirvonen P (eds) (2022) Carbon neutral Finland 2035 – national climate and energy strategy. Publications of the Ministry of Economic Affairs and Employment 2022:55. Ministry of Economic Affairs and Employment of Finland, Helsinki. https://urn.fi/URN:ISBN:978-952-327-843-1.
Hynynen J, Ojansuu R, Hökkä H, Siipilehto J, Salminen H, Haapala P(2002) Models for predicting stand development in MELA system. Finnish Forest Research Institute Research Papers 835. http://urn.fi/URN:ISBN:951-40-1815-X.
Jauhiainen J, Alm J, Bjarnadottir B, Callesen I, Christiansen JR, Clarke N, Dalsgaard L, He H, Jordan S, Kazanaviciute V, Klemedtsson L, Lauren A, Lazdins A, Lehtonen A, Lohila A, Lupikis A, Mander Ü, Minkkinen K, Kasimir Å, Olsson M, Ojanen P, Óskarsson H, Sigurdsson B, Søgaard G, Soosaar K, Vesterdal L, Laiho R (2019) Reviews and syntheses: greenhouse gas exchange data from drained organic forest soils – a review of current approaches and recommendations for future research. Biogeosciences 16: 4687–4703. https://doi.org/10.5194/bg-16-4687-2019.
Koivunen I, Muotka T, Jokikokko M, Virtanen R, Jyväsjärvi J (2023) Downstream impacts of peatland drainage on headwater stream biodiversity and ecosystem functioning. Forest Ecol Manag 543, article id 121143. https://doi.org/10.1016/j.foreco.2023.121143.
Korhonen KT (2023) Valtakunnan metsien inventointi 12. [The National Forest Inventory 12]. Luonnonvarakeskus. https://doi.org/10.23729/69e33efe-aefc-47df-ad37-f268389b56a9. Accessed 9 January 2025.
Korhonen KT, Räty M, Haakana H, Heikkinen J, Hotanen J-P, Kuronen M, Pitkänen J (2024) Forests of Finland 2019–2023 and their development 1921–2023. Silva Fenn 58(5), article id 24045. https://doi.org/10.14214/sf.24045.
Lämås T, Säengstuvall L, Öhman K, Lundström J, Årevall J, Holmström H, Nilsson L, Nordström E-M, Wikberg P-E, Wikström P, Eggers J (2023) The multi-faceted Swedish Heureka forest decision support system: context, functionality, design, and 10 years experiences of its use. Front For Glob Change 6, article id 1163105. https://doi.org/10.3389/ffgc.2023.1163105.
Laurén A, Palviainen M, Launiainen S, Leppä K, Stenberg L, Urzainki I, Nieminen M, Laiho R, Hökkä H (2021) Drainage and stand growth response in peatland forests—description, testing, and application of mechanistic peatland simulator SUSI. Forests 12, article id 293. https://doi.org/10.3390/f12030293.
Mäkelä A, Landsberg J, Ek AR, Burk TE, Ter-Mikaelian M, Ågren GI, Oliver CD, Puttonen P (2000) Process-based models for forest ecosystem management: current state of the art and challenges for practical implementation. Tree Physiol 20: 289–298. https://doi.org/10.1093/treephys/20.5-6.289.
Miettinen J, Ollikainen M, Aroviita J, Haikarainen S, Nieminen M, Turunen J, Valsta L (2020) Boreal peatland forests: ditch network maintenance effort and water protection in a forest rotation framework. Can J For Res 50: 1025–1038. https://doi.org/10.1139/cjfr-2019-0339.
Minkkinen K, Laine J (1998) Effect of forest drainage on the peat bulk density of pine mires in Finland. Can J For Res 28: 178–186. https://doi.org/10.1139/x97-206.
Natural Resources Institute Finland (2023) NFI computing service. https://vmilapa.luke.fi. Accessed 20 November 2023.
Niemi MT, Ojanen P, Sarkkola S, Vasander H, Minkkinen K, Vauhkonen J (2023) Using a digital elevation model to place overland flow fields and uncleaned ditch sections for water protection in peatland forest management. Ecol Eng 190, article id 106945. https://doi.org/10.1016/j.ecoleng.2023.106945.
Nieminen M, Sallantaus T, Ukonmaanaho L, Nieminen TM, Sarkkola S (2017) Nitrogen and phosphorus concentrations in discharge from drained peatland forests are increasing. Sci Total Environ 609: 974–981. https://doi.org/10.1016/j.scitotenv.2017.07.210.
Nonini L, Fiala M (2021) Estimation of carbon storage of forest biomass for voluntary carbon markets: preliminary results. J For Res 32: 329–338. https://doi.org/10.1007/s11676-019-01074-w.
Official Statistics of Finland (OSF) (2024) Silvicultural and forest improvement work. Natural Resources Institute Finland (Luke). https://www.luke.fi/en/statistics/silvicultural-and-forest-improvement-work. Accessed 16 January 2025.
Official Statistics of Finland (OSF) (2025a) Consumer price index. Statistics Finland. https://stat.fi/en/statistics/khi. Accessed 2 April 2025.
Official Statistics of Finland (OSF) (2025b) Volumes and prices in roundwood trade. Natural Resources Institute Finland (Luke). https://www.luke.fi/en/statistics/volumes-and-prices-in-industrial-roundwood-trade. Accessed 2 April 2025.
Ojanen P, Minkkinen K (2019) The dependence of net soil CO2 emissions on water table depth in boreal peatlands drained for forestry. Mires Peat 24, article id 27. https://doi.org/10.19189/MaP.2019.OMB.StA.1751.
Ojanen P, Minkkinen K, Alm J, Penttilä T (2010) Soil–atmosphere CO2, CH4 and N2O fluxes in boreal forestry-drained peatlands. For Ecol Manag 260: 411–421. https://doi.org/10.1016/j.foreco.2010.04.036.
Ojanen P, Minkkinen K, Penttilä T (2013) The current greenhouse gas impact of forestry-drained boreal peatlands. For Ecol Manag 289: 201–208. https://doi.org/10.1016/j.foreco.2012.10.008.
Päivänen J (1973) Hydraulic conductivity and water retention in peat soils. Acta For Fenn 129, article id 7563. https://doi.org/10.14214/aff.7563.
Päivänen J, Hånell B (2012) Peatland ecology and forestry – a sound approach. Helsingin yliopiston metsätieteiden laitoksen julkaisuja 3. Helsingin yliopiston metsätieteiden laitos, Helsinki. ISBN 978-952-10-4531-8.
Palviainen M, Pumpanen J, Mosquera V, Hasselquist EM, Laudon H, Ostonen I, Kull A, Wilson FR, Peltomaa E, Könönen M, Launiainen S, Peltola H, Ojala A, Laurén A (2024) Extending the SUSI peatland simulator to include dissolved organic carbon formation, transport and biodegradation – proper water management reduces lateral carbon fluxes and improves carbon balance. Sci Total Environ 950, article id 175173. https://doi.org/10.1016/j.scitotenv.2024.175173.
Rasinmäki J, Mäkinen A, Kalliovirta J (2009) SIMO: an adaptable simulation framework for multiscale forest resource data. Comput Electron Agr 66: 76–84. https://doi.org/10.1016/j.compag.2008.12.007.
Ruosteenoja K, Jylhä K (2021) Projected climate change in Finland during the 21st century calculated from CMIP6 model simulations. Geophysica 56: 39–69.
Saari A, Palviainen M, Niemi MT, Laurén A (2025) Impacts of reduced ditch network maintenance and ditch shallowing on ecosystem services of peatland forests in Finland. Silva Fenn 59, article id 25032. https://doi.org/10.14214/sf.25032.
Saarinen EKE (1935) Metsäojien syöpymisestä. Comm Inst For Fenniae 20.7. https://urn.fi/URN:NBN:fi-metla-201207171052.
Salminen H, Lehtonen M, Hynynen J (2005) Reusing legacy FORTRAN in the MOTTI growth and yield simulator. Comput Electron Agr 49: 103–113. https://doi.org/10.1016/j.compag.2005.02.005.
Sarkkola S, Hökkä H, Koivusalo H, Nieminen M, Ahti E, Päivänen J, Laine J (2010) Role of tree stand evapotranspiration in maintaining satisfactory drainage conditions in drained peatlands. Can J For Res 40: 1485–1496. https://doi.org/10.1139/X10-084.
Sarkkola S, Hökkä H, Ahti E, Koivusalo H, Nieminen M (2012) Depth of water table prior to ditch network maintenance is a key factor for tree growth response. Scand J For Res 27: 649–658. https://doi.org/10.1080/02827581.2012.689004.
Sarkkola S, Nieminen M, Koivusalo H, Laurén A, Ahti E, Launiainen S, Nikinmaa E, Marttila H, Laine J, Hökkä H (2013) Domination of growing-season evapotranspiration over runoff makes ditch network maintenance in mature peatland forests questionable. Mires Peat 11, article id 2. https://doi.org/10.19189/001c.128474.
Sikström U, Jansson G, Pettersson F (2020) Growth responses of Pinus sylvestris and Picea abies after ditch cleaning – a survey in Sweden. Scand J For Res 35: 69–84. https://doi.org/10.1080/02827581.2019.1705891.
Stenberg L (2016) Erosion and sediment transport mechanisms in drained peatland forest catchments after ditch network maintenance. Aalto University publication series, doctoral dissertations 202. https://urn.fi/URN:ISBN:978-952-60-7054-4.
Tong CHM, Noumonvi KD, Ratcliffe J, Laudon H, Järveoja J, Drott A, Nilsson MB, Peichl M (2024) A drained nutrient-poor peatland forest in boreal Sweden constitutes a net carbon sink after integrating terrestrial and aquatic fluxes. Glob Change Biol 30, article id e17246. https://doi.org/10.1111/gcb.17246.
Urzainki I, Laurén A, Palviainen M, Haahti K, Budiman A, Basuki I, Netzer M, Hökkä H (2020) Canal blocking optimization in restoration of drained peatlands. Biogeosciences 17: 4769–4784. https://doi.org/10.5194/bg-17-4769-2020.
Vanhatalo K, Väisänen P, Joensuu S, Sved J, Koistinen A, Äijälä O (eds) (2019) Metsänhoidon suositukset suometsien hoitoon, työopas. [Best practices for peatland forest management]. Tapion julkaisuja. Tapio Oy. ISBN 978-952-5632-74-3.
Vasander H, Laine J (2008) Site type classification on drained peatlands. In: Korhonen R, Korpela L, Sarkkola S (eds) Finland – Fenland : research and sustainable utilisation of mires and peat. Finnish Peatland Society Maahenki, pp 146–151. ISBN 978-952-5652-47-5.
Westin K, Bolte A, Haeler E, Haltia E, Jandl R, Juutinen A, Kuhlmey K, Lidestav G, Mäkipää R, Rosenkranz L, Triplat M, Skudnik M, Vilhar U, Schueler S (2023) Forest values and application of different management activities among small-scale forest owners in five EU countries. For Policy Econ 146, article id 102881. https://doi.org/10.1016/j.forpol.2022.102881.
Total of 56 references.
